None · Carnegie, OK
Flood risk 1/10 · Minimal
- FEMA flood zone
- X (unshaded)
- Chance of flooding over 30 yrs
- 0.0%
- Est. flood insurance / yr
- $507 – $1,088
Fire risk 10/10 · Severe
- Est. fire insurance / yr
- $2,463 – $4,575
Heat risk 6/10 · Moderate
- Hot days now (above 107°F)
- 7 days/yr
- Hot days in 30 yrs
- 20 days/yr
Wind risk 2/10 · Minimal
- Chance of severe wind over 30 yrs
- 4.0%
Air-quality risk 2/10 · Minimal
- Unhealthy air days now
- 0 days/yr
- Unhealthy air days in 30 yrs
- 1 days/yr
Risk factors via First Street. Map © Google.
Why this score? — see what drove the B- grade
The composite is a weighted blend of 9 inputs, each scored 0–100. Each bar is that input's sub-score; the figure is the points it added to the 100-point composite (weight × sub-score).
- Cash flow +30.0/30.0
- 1% rule +10.0/10.0
- DSCR +10.0/10.0
- ARV discount +7.5/15.0
- Livability +3.1/5.0
- Rent growth +2.5/5.0
- Condition / age +2.5/5.0
- Appreciation +1.4/10.0
- Schools +1.4/10.0
$50,000
🖨 Deal sheet 📄 Offer letter ✓ Due diligence
Listing remarks
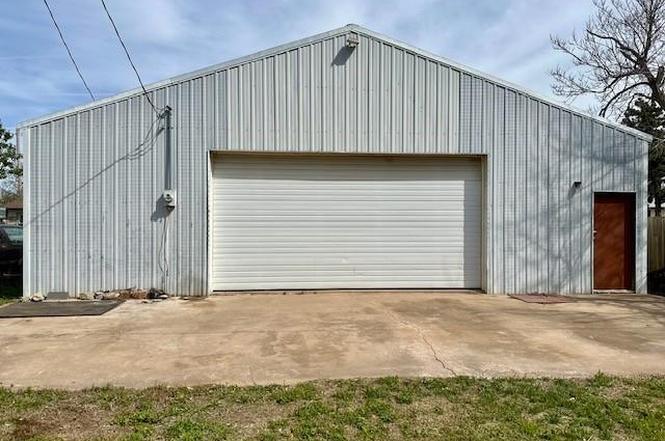
The dilapidated home needs to be torn down. However, the property consists of 2 city lots with a large barn, approximately 30x50. Garage has slab floor and overhead door with entrance off of the alley. This would be a great property with someone who needs additional room for their toys or wants an investment opportunity. The possibilities are endless Access to city utilities on the property.
Key facts
- 2 city lots
- Slab floor
- Large barn
Tags
Property features AI
Finance
- Other: Property is vacant; Days on market: 96; Previous status: Expired; Previous change type: Price Decrease; Directions note: Barn located behind house with alley entrance
- Financial info: Not assumable; Loan qualification: Unknown; Current price listed (from listing data)
- HOA & community: No mandatory association dues
Exterior
- Utilities: No homestead; Geocode source: Manual
- Home design: Single family residence; One level; Property faces north; Residential property
- Construction: Composition roof; Other construction materials; Slab foundation; Property listed as dilapidated; Built before or listed in assessor records (living area source: Assessor)
- Exterior features: Barn(s) on property; Workshop; Interior lot
Interior
- Bedrooms: 2 bedrooms
- Bathrooms: 1 full bathroom
- Heating & cooling: No heating; No cooling
- Interior features: One living area; No fireplace; No central heating; No central cooling; Vacant
Neighborhood map
What this means for you Summary
Snapshot
- This is a 2-bed/1.0-bath single-family listed at $50k.
Deal economics
- At list price, monthly cash flow is $356 ($4k/yr) — positive.
- The deal already cash-flows at list — no discount required.
- Meets the 1% rule at list price ($836 rent vs $50k).
- Recommended offer: $44k (12.0% below list) — sets the bar for market timing.
Location & tenants
- Location reads 62/100 on livability (#246 in OK) — a middle-class / working-renter tenant base. Strengths: crime A+, cost of living A+, housing A+; Watch: amenities F, commute F, employment F.
- Carnegie (rural): math 15% / reading 19% proficiency, ranked #212 of 270 in OK (top 78%) — low school quality limits family demand, transient renter base, plan for 1-2y turnover; 74% free/reduced lunch — lower-income household profile, screen leases tightly.
- Zoned schools: Carnegie Es (math 17% / reading 17%, grade F, #540 of 845 statewide, top 68%, 278 students, 0% FRL); Carnegie Hs (math 15% / reading 15%, grade F, #323 of 447 statewide, top 74%, 141 students, 0% FRL) — zoned schools average 0% FRL vs 74% district-wide (74 pts lower); this property's tenant base skews higher-income than the district average.
- Market conditions: 14 active listings in the ZIP.
Forward outlook
- Local home prices are declining (-3.0%/yr); year-one equity from $346 of loan paydown is wiped out by about $2k of value loss. Plan a longer hold.
- Caddo County population projected to shrink 7% by 2050 — rents likely to lag national; underwrite the cash flow, not the appreciation.
- At projected returns (-3.0% appreciation + 3.0% rent growth), your $14k cash investment doubles in ~4 years — after that, you're playing with house money.
Negotiation context
- It's been on market 167 days — a 12% lower offer ($44k) is reasonable based on typical stale-listing flexibility.
- 3 sale attempts since 2y ago; this cycle's ask has dropped $10k (17%) from the opening price — seller is motivated, your offer sets the floor, not the list.
- Current owner paid $18k; list at $50k implies a 186% gain — meaningful room to come down on a strong offer.
Risks & watch-outs
- Watch-outs: built in 1935 — expect roof / HVAC / electrical / plumbing capex.
- Climate carrying-cost: severe wildfire risk; extreme-heat days projected 7→20/yr by 2055 (HVAC capex compounding) — expect insurance premiums to compound above CPI over the hold.
Questions for the listing agent
- It's been on market 167 days. Have you received any prior offers? Is the seller open to a 12% concession, seller financing, or rate buy-down credit?
- Built in 1935 — when were the roof, HVAC, electrical panel, plumbing, and water heater last replaced?
- Why hasn't it sold? Are there any deal-killer items the seller is aware of (foundation, flood, title, zoning, code violations)?
- Is there a deadline driving the sale (1031 exchange, divorce, estate, relocation)? That informs how much negotiation room exists.
- Schools are D-rated, which usually means shorter tenancies and higher turnover. Who's the typical renter profile here, and what's been the actual vacancy rate?
- What's the average days-on-market for RENTAL listings here right now (not sales)? A rising rental-DOM trend means longer vacancies and softer asking-rent achievability than the comps imply.
- What's the recent tenant-quality profile in this submarket — average credit score on applications, eviction rate, late-payment / NSF rate, and stable-employment percentage? A property-management company in the area should have these aggregated.
- How much new for-sale + rental construction is in the pipeline within 1–3 miles? Heavy new supply typically softens prices + rents 12–24 months out; constrained supply supports both.
Investment metrics
- 1% rule
- 1.67% ✓
- Cap rate
- 14.84%
- Cash-on-cash
- 30.51%
- DSCR
- 2.36
- GRM
- 5.0
CMA / ARV
No comps found within radius.
Projected returns pro-forma
-3.0% appreciation · 3.0% rent growth · sell at horizon
- IRR
- 25.2%
- Equity multiple
- 2.04×
- Total profit
- $14,556
- Equity at exit
- $7,455
- IRR
- 32.9%
- Equity multiple
- 3.99×
- Total profit
- $41,816
- Equity at exit
- $4,323
Cash invested: $14,000 (down + closing). Projections, not guarantees.
Landlord ↔ Tenant lean methodology
- Overall (STATE)
- 83 Strongly Landlord-Friendly
- State Oklahoma
- 83 Strongly Landlord-Friendly · R+20
- County
- — inherits STATE
- City
- — inherits STATE
ZIP-level market 73015
- Home prices YoY
- -4.4%
- Active inventory
- 14
- Price-to-rent
- 5.0×
Monthly cashflow live
- Estimated rent
- $836 medium interval (Pro) →
- Mortgage (P&I)
- −$262
- Tax from tax record
- −$22 /mo · $258/yr
- Insurance
- −$21
- HOA
- −$0
- Vacancy / Maint / Mgmt
- −$176
- Net cashflow
- $356
Break-even live
UW: 25.0% down · 7.5% · 30yr · 1.5% tax · 5.0% vac · 8.0% maint · 8.0% mgmt
Financing live
Cash to close
- Down payment
- $12,500
- Closing costs
- $1,500
- Reserves months
- —
- Total cash needed
- —
Loan-product check · same deal, 3 products live
Conventional
25% down · 7.5% · 30yr
- Down + closing
- —
- Monthly P&I
- —
- Monthly cashflow
- —
- DSCR
- —
- Eligible?
- —
Personal DTI + credit; lowest rate.
DSCR
20% down · 8.5% · 30yr
- Down + closing
- —
- Monthly P&I
- —
- Monthly cashflow
- —
- DSCR
- —
- Eligible?
- —
No personal income docs; deal must DSCR.
Hard money
10% down · 12.0% · 12mo
- Down + closing
- —
- Monthly P&I
- —
- Monthly cashflow
- —
- DSCR
- —
- Eligible?
- —
Short-term bridge; refi at stabilization.
Listing history 22 events
-
2026-06-18days on market $50,000 Active 167 DOM
-
2026-06-17days on market $50,000 Active 166 DOM
-
2026-06-16days on market $50,000 Active 165 DOM
-
2026-06-15days on market $50,000 Active 164 DOM
-
2026-06-13days on market $50,000 Active 162 DOM
-
2026-06-12days on market $50,000 Active 161 DOM
-
2026-06-09days on market $50,000 Active 158 DOM
-
2026-06-08days on market $50,000 Active 157 DOM
-
2026-06-08days on market $50,000 Active 156 DOM
-
2026-06-07days on market $50,000 Active 155 DOM
-
2026-06-04days on market $50,000 Active 152 DOM
-
2026-06-02days on market $50,000 Active 151 DOM
-
2026-06-01days on market $50,000 Active 150 DOM
-
2026-05-31days on market $50,000 Active 149 DOM
-
2026-04-08price $50,000
-
2026-03-19status Active
-
2026-03-04historical
-
2025-12-18$60,000 Active
-
2024-11-01historical
-
2024-06-28price $40,000
-
2024-04-08$45,000 Active
-
2004-09-15soldstatus $17,500
ⓘ Source: listings_history table (triggers on properties + properties_extension) + one-shot
backfill from property_details.listing_events for pre-trigger history.
Tax reassessment forecast OK · Resets to sale price
- Current annual tax
- $258 · $22/mo
- Projected year-2 tax
- $450 · $37/mo
- Expected delta
- +$192/yr (+$16/mo · 74.4%)
ⓘ Screening estimate from a state-policy table — verify with the county assessor before closing.
Climate risk First Street
- Flood 1/10 Low FEMA zone X (unshaded) · 0% chance over 30 yrs
- Wildfire 10/10 Extreme
- Heat 6/10 Major 7 d/yr ≥107°F today · 20 d/yr by 30 yrs out
- Wind 2/10 Low 4% chance of damaging wind over 30 yrs
- Air quality 2/10 Low 0 unhealthy d/yr today · 1 by 30 yrs out
Nearby sold comps map
Loading sold comps map…
Walkable amenities ~0.75 mi
Loading nearby amenities…
Taxation est. · year 1
- Rental income
- $10,033
- − Mortgage interest
- −$2,801
- − Property taxes
- −$258
- − Insurance
- −$250
- − Repairs & maintenance
- −$803
- − Management
- −$803
- − Depreciation
- −$1,455
- Taxable income
- $3,664
- Est. tax owed @ 24.0%
- −$879
- After-tax cash flow
- $3,392/yr
For passive investors: Depreciation is non-cash, so a rental often shows a tax loss while cash-flowing — sheltering income. Rental losses are passive: they offset passive income freely, and up to $25,000/yr can offset ordinary (W-2) income if you actively participate and your MAGI is under $100k (phasing out to $0 by $150k); unused losses carry forward. On sale, claimed depreciation is recaptured at up to 25%, and gains may owe capital-gains tax (a 1031 exchange can defer both). Figures are a year-1 estimate at your 24.0% rate — not tax advice; consult a CPA.
Schools (NCES district)
- District
- Carnegie
- NCES district ID
- 4006630
- Math proficiency
- 15% ▼ -18.00%
- Reading proficiency
- 19% ▼ -18.00%
- Median HH income
- $32,189
- Composite
- 13.71/100
- National rank
- #9497
- State rank
- #212 of 270 in OK
Livability — Carnegie
- Score
- 62/100
- State rank
- #246
- US rank
- #16515
Category grades
Schools grade is shown separately in the Schools card above.
Census & demographics
- Census place
- Carnegie, OK
- Population (ZIP)
- 2,365
Population outlook (Caddo County) Hauer SSP2
- Today (2025)
- 28,391 people
- By 2030
- 27,844 · -1.9%
- By 2040
- 27,057 · -4.7%
- By 2050
- 26,484 · -6.7%
- By 2075
- 26,266 · -7.5%
- By 2100
- 26,077 · -8.2%
Race, ethnicity, and origin ACS 2023
- Neighborhood character
- Diverse neighborhood (Simpson 0.68)
- Race & ethnicity
- White 54% Native American 20% Hispanic / Latino 18% Two or more races 12% Black 2%
- Hispanic origin (detail)
- Mexican 16%
- Common ancestry
- Iranian 2% Italian 1% European 1%
- Foreign-born
- 2% · Canada
- Languages at home
- 87% English-only · Spanish 10%
Political lean MEDSL · Caddo
- 2024 margin
- Solid R (+47.1) · D 25.4% · R 72.5% · Other 2.1%
- 2008→2024 swing
- -16.4pp toward R · 2008: -30.7pp · 2024: -47.1pp
- All cycles
- 2024: R+47.1 2020: R+44.0 2016: R+43.4 2012: R+28.5 2008: R+30.7
Not yet ingested
- Civics
- —
Market trends
- HPI YoY
- ▼ -7.28%
- Current HPI
- 159.676
- Rent YoY
- —
- Metro
- —
- State GDP YoY
- ▲ 1.55%
- F500 in state
- 6
Industry mix (Fortune 500 HQ in OK)
| Industry | F500 HQs | Revenue |
|---|---|---|
| Energy | 3 | $48B |
|
||
Price history
+185.7% since first listed8 events — show timeline
- 2026-04-08 Price Changed $50,000 MLSOK
- 2026-03-19 Relisted — MLSOK
- 2026-03-04 Listing Removed — MLSOK
- 2025-12-18 Listed $60,000 MLSOK
- 2024-11-01 Listing Removed — MLSOK
- 2024-06-28 Price Changed $40,000 MLSOK
- 2024-04-08 Listed $45,000 MLSOK
- 2004-09-15 Sold (Public Records) $17,500 Public Records
Property tax history
+2.0%/yrLatest (2025): $258 · +2.4% YoY. Source: county tax records.
Cash-flow waterfall
monthlySold comps — $/sqft
last 12 mo · ≤1 miLoading sold comps…