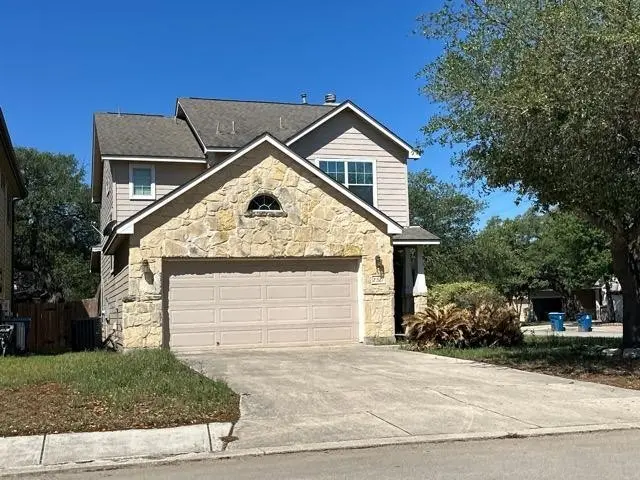
21527 Thunder Basin · San Antonio, TX
Flood risk 1/10 · Minimal
- FEMA flood zone
- X (unshaded)
- Chance of flooding over 30 yrs
- 0.0%
- Est. flood insurance / yr
- $507 – $1,088
Fire risk 4/10 · Minor
- Est. fire insurance / yr
- $1,222 – $2,270
Heat risk 8/10 · Major
- Hot days now (above 107°F)
- 7 days/yr
- Hot days in 30 yrs
- 22 days/yr
Wind risk 6/10 · Moderate
- Chance of severe wind over 30 yrs
- 76.0%
Air-quality risk 2/10 · Minimal
- Unhealthy air days now
- 1 days/yr
- Unhealthy air days in 30 yrs
- 1 days/yr
Risk factors via First Street. Map © Google.
Why this score? — see what drove the D grade
The composite is a weighted blend of 9 inputs, each scored 0–100. Each bar is that input's sub-score; the figure is the points it added to the 100-point composite (weight × sub-score).
- ARV discount +15.0/15.0
- Cash flow +7.8/30.0
- Livability +4.0/5.0
- Rent growth +3.8/5.0
- 1% rule +3.0/10.0
- Condition / age +2.5/5.0
- Schools +2.4/10.0
- DSCR +1.9/10.0
- Appreciation +0.0/10.0
$274,900
🖨 Deal sheet 📄 Offer letter ✓ Due diligence
Listing remarks MLS
Clean design meets smart living. This 3-bedroom, 2.5-bath home with a 2-car attached garage features high ceilings, open-concept living, and natural light throughout. The kitchen flows seamlessly with granite counters and ample cabinetry—perfect for hosting or everyday use. Private primary suite plus flexible secondary bedrooms. Located in Wortham Oaks near Wortham Oaks Park, with quick access to H-E-B Plus! at Bulverde Rd, Stone Oak shopping and dining, and TPC San Antonio Golf Club. Move-in ready and waiting for its next owner.
Key facts
- Ample cabinetry
- High ceilings
- Open-concept living
Tags
Neighborhood map
What this means for you Summary
Snapshot
- This is a 3-bed/2.5-bath single-family listed at $275k.
Deal economics
- At list price, monthly cash flow is $-310 ($-4k/yr) — negative.
- To cash-flow at today's rent, offer at most $220k (19.9% below list).
- To meet the 1% rule (rent ≥ 1% of price), the offer needs to be $219k (20.4% below list).
- Recommended offer: $219k (20.4% below list) — sets the bar for 1% rule.
- Cap rate 4.9% vs local median 3.8% in San Antonio — top-decile yield for the area; either an underpriced asset or a hidden risk that comps aren't pricing in. Stress-test before assuming the spread holds.
Location & tenants
- Location reads 80/100 on livability (#31 in TX, #1,616 nationally) — a professional / high-income tenant draw. Strengths: amenities A+, commute A+, cost of living A+; Watch: schools C-, crime F.
- Judson ISD (suburban): math 21% / reading 33% proficiency, ranked #660 of 826 in TX (top 80%) — low school quality limits family demand, transient renter base, plan for 1-2y turnover.
- Market conditions: Rents rising fast (+5.4%/yr); 236 active listings in the ZIP; 34 comparable units currently listed for rent nearby; rentals at typical pace (median 20d on market — plan ~3-4 weeks tenant-placement turnaround); high-income renter base; 8,308 units permitted in Bexar County in 2024 (2,506 in 5+ unit buildings).
- This rent is only 18% of the median local income ($148k/yr) — well below the 30% rent-burden line; pricing power to push rent on renewal without tenant pushback.
Forward outlook
- Local home prices are declining (-3.0%/yr); year-one equity from $2k of loan paydown is wiped out by about $8k of value loss. Plan a longer hold.
- Bexar County population projected at +50% by 2050 — long-run rental-demand tailwind backs the buy-and-hold thesis.
Negotiation context
- It's been on market 62 days — a 6% lower offer ($258k) is reasonable based on typical stale-listing flexibility.
- 6 sale attempts since 20y ago with the ask held roughly flat each time — persistent listings suggest the price (not the market) is what's stuck; bring a comps-based counter.
Risks & watch-outs
- Climate carrying-cost: major wind risk, 76% chance of damaging wind over 30y; extreme-heat days projected 7→22/yr by 2055 (HVAC capex compounding) — expect insurance premiums to compound above CPI over the hold.
Questions for the listing agent
- What do current leases actually rent for vs. the listed asking? Can we see a recent rent roll and the last 12 months of T-12 income?
- It's been on market 62 days. Have you received any prior offers? Is the seller open to a 20% concession, seller financing, or rate buy-down credit?
- What does the HOA fee cover, when was the last increase, and are there any pending special assessments or reserve-fund shortfalls?
- Why hasn't it sold? Are there any deal-killer items the seller is aware of (foundation, flood, title, zoning, code violations)?
- Is there a deadline driving the sale (1031 exchange, divorce, estate, relocation)? That informs how much negotiation room exists.
- Crime grade is F in this area — have there been break-ins, vandalism, or insurance claims at this property in the last 3 years? What carrier currently insures it and at what premium?
- The area grade is low — what's the realistic commute time and amenity access for the typical tenant pool here? Any planned neighborhood developments (good or bad) we should know about?
- What's the average days-on-market for RENTAL listings here right now (not sales)? A rising rental-DOM trend means longer vacancies and softer asking-rent achievability than the comps imply.
- What's the recent tenant-quality profile in this submarket — average credit score on applications, eviction rate, late-payment / NSF rate, and stable-employment percentage? A property-management company in the area should have these aggregated.
- How much new for-sale + rental construction is in the pipeline within 1–3 miles? Heavy new supply typically softens prices + rents 12–24 months out; constrained supply supports both.
Investment metrics
- 1% rule
- 0.80% ✗
- Cap rate
- 4.94%
- Cash-on-cash
- -4.83%
- DSCR
- 0.79
- GRM
- 10.5
CMA / ARV
- ARV (median comp)
- $337,672
- List price
- $274,900
- Delta
- -18.59%
- Verdict
- UNDERPRICED
- Comps
- 20 within 1.0 mi
Show comp detail 12 sales within ~0.75 mi
| Address | Dist | Beds/Ba | Sqft | Sold | Price | $/sf | Match |
|---|---|---|---|---|---|---|---|
| 21503 Riverton Rise | 0.18mi | 3/2.0 | 1,770 (-2%) | 1mo | $280,000 | $158 | 85 |
| 5610 Thunder Oaks | 0.21mi | 3/2.0 | 1,927 (+6%) | 2mo | $332,000 | $172 | 76 |
| 21154 Boulder Flts | 0.60mi | 4/2.5 (+1) | 1,823 (+1%) | 2mo | $391,950 | $215 | 65 |
| 21207 Boulder Flts | 0.56mi | 4/2.0 (+1) | 1,840 (+2%) | 0mo | $365,000 | $198 | 64 |
| 21138 Boulder Flts | 0.63mi | 4/2.5 (+1) | 1,823 (+1%) | 2mo | $393,950 | $216 | 63 |
| 21150 Boulder Flts | 0.60mi | 4/2.0 (+1) | 1,778 (-2%) | 1mo | $384,950 | $217 | 61 |
| 20944 Gravel Keep | 0.73mi | 4/2.5 (+1) | 1,823 (+1%) | 0mo | $417,500 | $229 | 60 |
| 21130 Boulder Flts | 0.64mi | 4/2.0 (+1) | 1,778 (-2%) | 0mo | $387,950 | $218 | 60 |
| 5911 Akin Stroll | 0.51mi | 4/3.0 (+1) | 1,955 (+8%) | 1mo | $344,999 | $176 | 55 |
| 21162 Boulder Flts | 0.58mi | 4/2.0 (+1) | 1,680 (-7%) | 1mo | $368,950 | $220 | 53 |
| 21118 Boulder Flts | 0.66mi | 4/2.0 (+1) | 1,680 (-7%) | 1mo | $367,950 | $219 | 49 |
| 21126 Boulder Flts | 0.65mi | 3/2.0 | 1,595 (-12%) | 0mo | $379,950 | $238 | 48 |
Match score weights: distance 35% · size 25% · config 20% · recency 20%. Top-matched comps best support the ARV.
Projected returns pro-forma
-3.0% appreciation · 5.37% rent growth · sell at horizon
- IRR
- -21.6%
- Equity multiple
- 0.24×
- Total profit
- $-58,814
- Equity at exit
- $40,988
- IRR
- -10.2%
- Equity multiple
- 0.31×
- Total profit
- $-53,135
- Equity at exit
- $23,768
Cash invested: $76,972 (down + closing). Projections, not guarantees.
Landlord ↔ Tenant lean methodology
- Overall (STATE)
- 87 Strongly Landlord-Friendly
- State Texas
- 87 Strongly Landlord-Friendly · R+5
- County
- — inherits STATE
- City
- — inherits STATE
ZIP-level market 78261
- Home prices YoY
- -15.0%
- Rents YoY
- 5.4%
- Active inventory
- 236
- Price-to-rent
- 10.5×
Monthly cashflow live
- Estimated rent
- $2,187 high interval (Pro) →
- Mortgage (P&I)
- −$1,442
- Tax from tax record
- −$453 /mo · $5,431/yr
- Insurance
- −$115
- HOA
- −$29
- Vacancy / Maint / Mgmt
- −$459
- Net cashflow
- $-310
Break-even live
UW: 25.0% down · 7.5% · 30yr · 1.5% tax · 5.0% vac · 8.0% maint · 8.0% mgmt
Financing live
Cash to close
- Down payment
- $68,725
- Closing costs
- $8,247
- Reserves months
- —
- Total cash needed
- —
Loan-product check · same deal, 3 products live
Conventional
25% down · 7.5% · 30yr
- Down + closing
- —
- Monthly P&I
- —
- Monthly cashflow
- —
- DSCR
- —
- Eligible?
- —
Personal DTI + credit; lowest rate.
DSCR
20% down · 8.5% · 30yr
- Down + closing
- —
- Monthly P&I
- —
- Monthly cashflow
- —
- DSCR
- —
- Eligible?
- —
No personal income docs; deal must DSCR.
Hard money
10% down · 12.0% · 12mo
- Down + closing
- —
- Monthly P&I
- —
- Monthly cashflow
- —
- DSCR
- —
- Eligible?
- —
Short-term bridge; refi at stabilization.
Rent comps 34 comps
| Address | Beds | Baths | Sqft | Rent | $/sqft | DOM | Units | Dist |
|---|---|---|---|---|---|---|---|---|
| 21514 Thunder Basin San Antonio, TX | 3.0 | 2.5 | 1928 | $2,100 | $1.09 | 17d | 1 | 0.07mi |
| 21735 Thunder Basin San Antonio, TX | 4.0 | 2.5 | 2363 | $2,150 | $0.91 | 43d | 1 | 0.09mi |
| 5515 Stormie Keep San Antonio, TX | 4.0 | 3.0 | 2257 | $2,450 | $1.09 | 21d | 1 | 0.34mi |
| 5518 Stormie Keep San Antonio, TX | 4.0 | 2.0 | 1779 | $2,250 | $1.26 | 2d | 1 | 0.35mi |
| 5518 Stormie Keep San Antonio, TX | 4.0 | 2.0 | 1778 | $2,250 | $1.27 | 1d | 1 | 0.35mi |
| 5951 Southern Knl San Antonio, TX | 3.0 | 2.0 | 1648 | $2,500 | $1.52 | 1d | 1 | 0.35mi |
| 5536 Jewel Curv San Antonio, TX | 4.0 | 2.0 | 1750 | $2,500 | $1.43 | 43d | 1 | 0.40mi |
| 5602 Chestnut Xing San Antonio, TX | 3.0 | 2.5 | 1958 | $2,250 | $1.15 | 23d | 1 | 0.49mi |
| 5714 Pin Pt San Antonio, TX | 4.0 | 2.5 | 2146 | $2,400 | $1.12 | 1d | 1 | 0.51mi |
| 6015 Akin Stroll San Antonio, TX | 3.0 | 2.0 | 1534 | $2,100 | $1.37 | 43d | 1 | 0.54mi |
| 21066 Gravel Keep San Antonio, TX | 4.0 | 2.5 | 2257 | $2,400 | $1.06 | 1d | 1 | 0.61mi |
| 22419 Carriage Bush San Antonio, TX | 4.0 | 3.0 | 2340 | $2,395 | $1.02 | 43d | 1 | 0.62mi |
| 5819 Akin Pl San Antonio, TX | 4.0 | 2.0 | 1648 | $1,800 | $1.09 | 23d | 1 | 0.68mi |
| 6035 Akin Pl San Antonio, TX | 3.0 | 2.0 | 1690 | $2,100 | $1.24 | 4d | 1 | 0.76mi |
| 6022 Akin Quay San Antonio, TX | 4.0 | 2.0 | 1739 | $2,200 | $1.27 | 4d | 1 | 0.77mi |
| 5103 Gully Way San Antonio, TX | 4.0 | 2.0 | 1778 | $2,200 | $1.24 | 12d | 1 | 0.78mi |
| 22219 Esperanza Way San Antonio, TX | 3.0 | 2.0 | 2428 | $2,350 | $0.97 | 2d | 1 | 0.85mi |
| 6050 Akin Cir San Antonio, TX | 4.0 | 2.0 | 2054 | $2,450 | $1.19 | 2d | 1 | 0.85mi |
| 5015 Gully Way San Antonio, TX | 4.0 | 2.5 | 2023 | $2,400 | $1.19 | 1d | 1 | 0.85mi |
| 6074 Akin Cir San Antonio, TX | 4.0 | 2.5 | 2092 | $2,300 | $1.10 | 43d | 1 | 0.87mi |
| 21266 Watercourse Way San Antonio, TX | 4.0 | 3.0 | 2257 | $2,400 | $1.06 | 43d | 1 | 0.88mi |
| 5714 Agave Spine San Antonio, TX | 4.0 | 3.0 | 2011 | $2,600 | $1.29 | 43d | 1 | 0.91mi |
| 21339 Watercourse Way San Antonio, TX | 4.0 | 2.5 | 2171 | $2,300 | $1.06 | 44d | 1 | 0.91mi |
| 22224 Backspin San Antonio, TX | 4.0 | 2.5 | 2323 | $2,290 | $0.99 | 10d | 1 | 0.93mi |
| 10822 Rindle Ln San Antonio, TX | 3.0 | 2.5 | 2320 | $1,949 | $0.84 | 43d | 1 | 1.00mi |
| 20859 Rindle Ln San Antonio, TX | 4.0 | 3.0 | 2032 | $2,500 | $1.23 | 19d | 1 | 1.04mi |
| 22618 Double Bogey San Antonio, TX | 4.0 | 2.0 | 1720 | $1,950 | $1.13 | 3d | 1 | 1.04mi |
| 22626 Double Bogey San Antonio, TX | 4.0 | 2.5 | 2309 | $2,500 | $1.08 | 43d | 1 | 1.05mi |
| 5131 Blind Shot San Antonio, TX | 4.0 | 2.0 | 1572 | $2,100 | $1.34 | 43d | 1 | 1.08mi |
| 22507 Green Jacket San Antonio, TX | 3.0 | 2.0 | 1535 | $2,100 | $1.37 | 43d | 1 | 1.09mi |
| 21027 Watercourse Way San Antonio, TX | 4.0 | 2.5 | 1823 | $2,195 | $1.20 | 20d | 1 | 1.10mi |
| 23215 Langdon Lndg San Antonio, TX | 4.0 | 2.5 | 2075 | $2,550 | $1.23 | 2d | 1 | 1.29mi |
| 22763 Tee Shot San Antonio, TX | 3.0 | 2.5 | 2041 | $2,300 | $1.13 | 43d | 1 | 1.31mi |
| 5707 Tpc Pkwy San Antonio, TX | 4.0 | 1.0–3.0 | 1013 | $1,564 | $1.54 | 1d | 19 | 1.48mi |
HOA detail
- Monthly dues
- $29 · $348/yr
Listing history 39 events
-
2026-06-18days on market $274,900 Active 62 DOM
-
2026-06-17days on market $274,900 Active 61 DOM
-
2026-06-16days on market $274,900 Active 60 DOM
-
2026-06-15days on market $274,900 Active 59 DOM
-
2026-06-13days on market $274,900 Active 57 DOM
-
2026-06-09days on market $274,900 Active 53 DOM
-
2026-06-08days on market $274,900 Active 52 DOM
-
2026-06-07days on market $274,900 Active 51 DOM
-
2026-06-04days on market $274,900 Active 48 DOM
-
2026-06-03days on market $274,900 Active 47 DOM
-
2026-06-02days on market $274,900 Active 46 DOM
-
2026-06-01days on market $274,900 Active 45 DOM
-
2026-05-31days on market $274,900 Active 44 DOM
-
2026-04-17$289,000 Active 541-char remark
Show marketing remark (541 chars)
Clean design meets smart living. This 3-bedroom, 2.5-bath home with a 2-car attached garage features high ceilings, open-concept living, and natural light throughout. The kitchen flows seamlessly with granite counters and ample cabinetry—perfect for hosting or everyday use. Private primary suite plus flexible secondary bedrooms. Located in Wortham Oaks near Wortham Oaks Park, with quick access to H-E-B Plus! at Bulverde Rd, Stone Oak shopping and dining, and TPC San Antonio Golf Club. Move-in ready and waiting for its next owner.
-
2024-04-08status Pending
-
2024-03-14historical
-
2024-03-12historical Active Option
-
2024-02-03price $300,000
-
2023-11-18price $310,000
-
2023-08-02price $320,000
-
2023-03-11$330,000 New
-
2015-01-18status Pending
-
2015-01-12historical Active Option
-
2015-01-12historical
-
2014-12-19$204,500 New
-
2014-02-19soldstatus
-
2014-02-18soldstatus Sold
-
2014-01-28status Pending
-
2014-01-21historical Active Option
-
2014-01-17price $205,000 Price Change
-
2013-12-11price $197,000 Price Change
-
2013-10-21price $195,000 Price Change
-
2013-09-11price $199,990 Price Change
-
2013-08-29price $204,000 Price Change
-
2013-08-23$205,000 New
-
2013-02-23historical
-
2012-04-12$210,000
-
2007-06-28soldstatus
-
2006-10-23$201,800
ⓘ Source: listings_history table (triggers on properties + properties_extension) + one-shot
backfill from property_details.listing_events for pre-trigger history.
Tax reassessment forecast TX · Resets to sale price
- Current annual tax
- $5,431 · $453/mo
- Projected year-2 tax
- $5,431 · $453/mo
- Expected delta
- $0/yr ($0/mo · 0.0%)
ⓘ Screening estimate from a state-policy table — verify with the county assessor before closing.
Climate risk First Street
- Flood 1/10 Low FEMA zone X (unshaded) · 0% chance over 30 yrs
- Wildfire 4/10 Moderate
- Heat 8/10 Severe 7 d/yr ≥107°F today · 22 d/yr by 30 yrs out
- Wind 6/10 Major 76% chance of damaging wind over 30 yrs
- Air quality 2/10 Low 1 unhealthy d/yr today · 1 by 30 yrs out
Nearby sold comps map
Loading sold comps map…
Walkable amenities ~0.75 mi
Loading nearby amenities…
Taxation est. · year 1
- Rental income
- $26,249
- − Mortgage interest
- −$15,399
- − Property taxes
- −$5,431
- − Insurance
- −$1,374
- − Repairs & maintenance
- −$2,100
- − Management
- −$2,100
- − HOA
- −$348
- − Depreciation
- −$7,997
- Taxable loss
- −$8,501
- Est. tax savings @ 24.0%
- +$2,040
- After-tax cash flow
- $-1,676/yr
For passive investors: Depreciation is non-cash, so a rental often shows a tax loss while cash-flowing — sheltering income. Rental losses are passive: they offset passive income freely, and up to $25,000/yr can offset ordinary (W-2) income if you actively participate and your MAGI is under $100k (phasing out to $0 by $150k); unused losses carry forward. On sale, claimed depreciation is recaptured at up to 25%, and gains may owe capital-gains tax (a 1031 exchange can defer both). Figures are a year-1 estimate at your 24.0% rate — not tax advice; consult a CPA.
Schools (NCES district)
- District
- Judson ISD
- NCES district ID
- 4824990
- Math proficiency
- 21% ▼ -21.00%
- Reading proficiency
- 33% ▼ -7.00%
- Median HH income
- $57,542
- Composite
- 24.39/100
- National rank
- #7689
- State rank
- #660 of 826 in TX
Livability — San Antonio
- Score
- 80/100
- State rank
- #31
- US rank
- #1616
Category grades
Schools grade is shown separately in the Schools card above.
Census & demographics
- County
- Bexar County · 1,990,555 people
- City population
- 1,806,925
- Metro
- San Antonio-New Braunfels, TX
- Population (ZIP)
- 26,657
- Household income
- $147,727
- Rent vs Own
- Severe rent burden
- 257.0
Population outlook (Bexar County) Hauer SSP2
- Today (2025)
- 2,336,851 people
- By 2030
- 2,560,728 · +9.6%
- By 2040
- 3,020,569 · +29.3%
- By 2050
- 3,493,522 · +49.5%
- By 2075
- 4,668,459 · +99.8%
- By 2100
- 5,533,242 · +136.8%
Race, ethnicity, and origin ACS 2023
- Neighborhood character
- Diverse neighborhood (Simpson 0.67)
- Race & ethnicity
- White 43% Hispanic / Latino 36% Two or more races 25% Black 9% Asian 5% Native American 1%
- Hispanic origin (detail)
- Mexican 30% Puerto Rican 1%
- Common ancestry
- Lithuanian 3% Romanian 2% Italian 2%
- Foreign-born
- 12% · Canada, Jamaica, South Korea
- Languages at home
- 74% English-only · Spanish 17% Other Indo-European 3% Russian/Polish/Slavic 3%
Political lean MEDSL · Bexar
- 2024 margin
- Lean D (+9.8) · D 54.3% · R 44.6% · Other 1.1%
- 2008→2024 swing
- +4.2pp toward D · 2008: 5.6pp · 2024: 9.8pp
- All cycles
- 2024: D+9.8 2020: D+18.2 2016: D+13.5 2012: D+4.6 2008: D+5.6
Not yet ingested
- Civics
- —
Market trends
- HPI YoY
- ▼ -40.32%
- Current HPI
- 227.8859
- Rent YoY
- ▲ 5.37%
- Metro
- San Antonio-New Braunfels, TX
- State GDP YoY
- ▲ 3.95%
- F500 in state
- 110
Industry mix (Fortune 500 HQ in TX)
| Industry | F500 HQs | Revenue |
|---|---|---|
| Energy | 16 | $1,198B |
|
||
| Technology | 5 | $198B |
|
||
| Engineering / Construction | 4 | $72B |
|
||
| Energy Services | 3 | $60B |
|
||
| Utilities | 3 | $41B |
|
||
| Healthcare | 2 | $330B |
|
||
Price history
+43.2% since first listed26 events — show timeline
- 2026-04-17 Listed $289,000 HARMLS
- 2024-04-08 Pending — LERA
- 2024-03-14 Listing Removed — LERA
- 2024-03-12 Contingent — LERA
- 2024-02-03 Price Changed $300,000 LERA
- 2023-11-18 Price Changed $310,000 LERA
- 2023-08-02 Price Changed $320,000 LERA
- 2023-03-11 Listed $330,000 LERA
- 2015-01-18 Pending — LERA
- 2015-01-12 Contingent — LERA
- 2015-01-12 Listing Removed — LERA
- 2014-12-19 Listed $204,500 LERA
- 2014-02-19 Sold (Public Records) — Public Records
- 2014-02-18 Sold (MLS) — LERA
- 2014-01-28 Pending — LERA
- 2014-01-21 Contingent — LERA
- 2014-01-17 Price Changed $205,000 LERA
- 2013-12-11 Price Changed $197,000 LERA
- 2013-10-21 Price Changed $195,000 LERA
- 2013-09-11 Price Changed $199,990 LERA
- 2013-08-29 Price Changed $204,000 LERA
- 2013-08-23 Listed $205,000 LERA
- 2013-02-23 Listing Removed — LERA
- 2012-04-12 Listed $210,000 LERA
- 2007-06-28 Sold (MLS) — LERA
- 2006-10-23 Listed $201,800 LERA
Property tax history
+10.8%/yrLatest (2025): $5,431 · +1.7% YoY. Source: county tax records.
Cash-flow waterfall
monthlySold comps — $/sqft
last 12 mo · ≤1 miLoading sold comps…