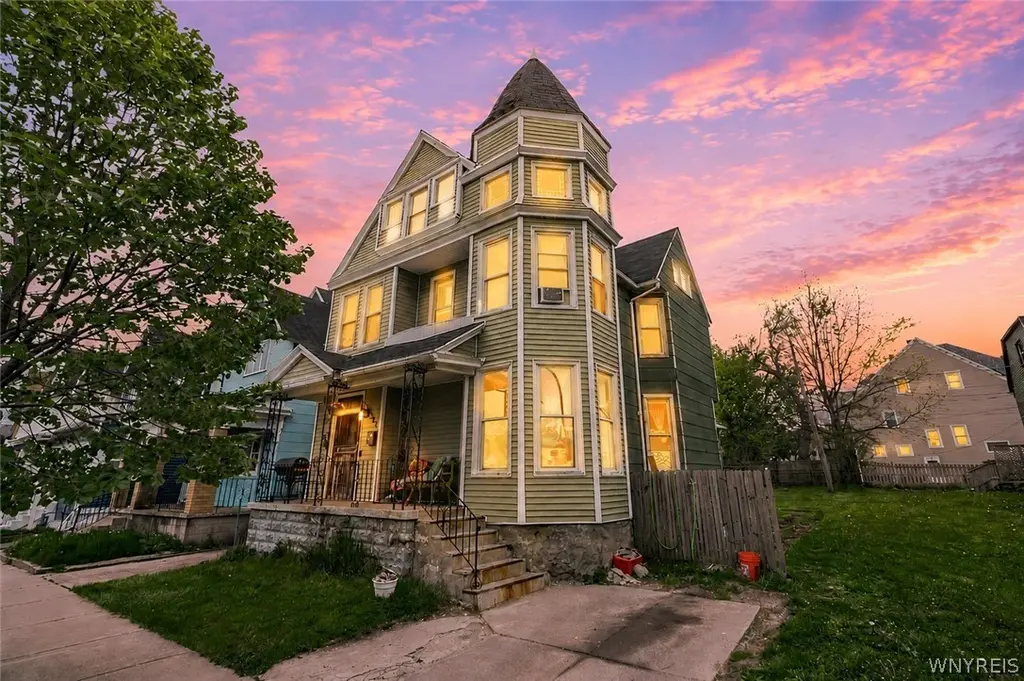
302 Massachusetts Ave · Buffalo, NY
Flood risk 7/10 · Major
- FEMA flood zone
- X (unshaded)
- Chance of flooding over 30 yrs
- 0.77%
- Est. flood insurance / yr
- $473 – $860
Fire risk 1/10 · Minimal
- Est. fire insurance / yr
- $691 – $1,283
Heat risk 3/10 · Minor
- Hot days now (above 91°F)
- 7 days/yr
- Hot days in 30 yrs
- 15 days/yr
Wind risk 1/10 · Minimal
- Chance of severe wind over 30 yrs
- —
Air-quality risk 4/10 · Minor
- Unhealthy air days now
- 4 days/yr
- Unhealthy air days in 30 yrs
- 9 days/yr
Risk factors via First Street. Map © Google.
Why this score? — see what drove the C+ grade
The composite is a weighted blend of 9 inputs, each scored 0–100. Each bar is that input's sub-score; the figure is the points it added to the 100-point composite (weight × sub-score).
- Cash flow +16.6/30.0
- ARV discount +15.0/15.0
- Appreciation +8.8/10.0
- DSCR +5.2/10.0
- 1% rule +4.5/10.0
- Livability +3.9/5.0
- Schools +3.3/10.0
- Condition / age +2.5/5.0
- Rent growth +2.4/5.0
$199,900
🖨 Deal sheet 📄 Offer letter ✓ Due diligence
Listing remarks
Welcome home to this spacious and opportunity-filled 5-bedroom, 1.5-bath home in the heart of Buffalo’s vibrant West Side! This home is packed with character, charm, and endless potential to truly make it your own. Enjoy the convenience of city living with easy access to public transportation, popular coffee shops, restaurants, parks, and the vibrant walkable lifestyle the West Side is known for. As soon as you arrive, you’re welcomed by a covered front porch, perfect for relaxing. The home also offers a driveway parking spot in addition to street parking for added convenience. Step inside to find a large living room and formal dining room with hardwood floors underneath the car
Key facts
- Covered front porch
- Half bath
- Formal dining room
Tags
Property features AI
Finance
- Other: Rectangular lot with 32x125 dimensions; Lot near public transit
Exterior
- Parking: No garage
- Utilities: Public water connected; Sewer connected; Circuit breaker electric service
- Home design: 2-story house; Existing construction
- Construction: Composite siding; Vinyl siding; Stone foundation
- Exterior features: Concrete driveway; Partial fencing; Covered porch
Interior
- Kitchen: Gas oven; Gas range; Refrigerator
- Bedrooms: 1 bedroom on the main level
- Flooring: Carpet; Ceramic tile; Varies
- Bathrooms: 1 full bathroom; 1 half bathroom; 1 main-level bathroom
- Heating & cooling: Gas heating; Forced air heating
- Interior features: Separate/formal dining room; Eat-in kitchen; Separate/formal living room; Bedroom on main level; Full basement
- Laundry & utility: Gas water heater
Neighborhood map
What this means for you Summary
Snapshot
- This is a 4-bed/1.5-bath single-family listed at $200k.
Deal economics
- At list price, monthly cash flow is $65 ($782/yr) — positive.
- The deal already cash-flows at list — no discount required.
- To meet the 1% rule (rent ≥ 1% of price), the offer needs to be $190k (4.9% below list).
- Recommended offer: $190k (4.9% below list) — sets the bar for 1% rule.
Location & tenants
- Location reads 77/100 on livability (#195 in NY, #3,011 nationally) — a middle-class / working-renter tenant base. Strengths: commute A+, housing A+, health & safety A+; Watch: crime F, employment D-.
- Buffalo City School District (urban): math 41% / reading 40% proficiency, ranked #535 of 590 in NY (top 91%) — families likely to look elsewhere, expect single-tenant / working-renter base with shorter leases; 75% free/reduced lunch — lower-income household profile, screen leases tightly.
- Market conditions: Rents soft (-0.5%/yr); 137 active listings in the ZIP; 15 comparable units currently listed for rent nearby; rentals at typical pace (median 20d on market — plan ~3-4 weeks tenant-placement turnaround); 1,244 units permitted in Erie County in 2024 (563 in 5+ unit buildings).
- This rent runs 42% of the median local income ($54k/yr) — at the standard rent-burdened threshold; future hikes will face affordability resistance.
Forward outlook
- In year one you build about $16k of equity ($1k loan paydown + $15k appreciation (7.5% local appreciation)).
- At projected returns (7.5% appreciation + 0.0% rent growth), your $56k cash investment doubles in ~4 years — after that, you're playing with house money.
- By year 3, paydown + projected appreciation supports a ~$41k cash-out refi (75% LTV) — recoverable capital for the next deal without selling this one.
Negotiation context
- It's been on market 29 days — a 2% lower offer ($197k) is reasonable based on typical stale-listing flexibility.
- Current owner paid $36k; list at $200k implies a 455% gain — meaningful room to come down on a strong offer.
Risks & watch-outs
- Watch-outs: flood insurance adds $56/mo; built in 1880 — expect roof / HVAC / electrical / plumbing capex.
- Climate carrying-cost: major flood risk — expect insurance premiums to compound above CPI over the hold.
Questions for the listing agent
- Built in 1880 — when were the roof, HVAC, electrical panel, plumbing, and water heater last replaced?
- What's the actual annual flood-insurance premium (NFIP or private), and is the property in a SFHA with mandatory coverage?
- Is there a deadline driving the sale (1031 exchange, divorce, estate, relocation)? That informs how much negotiation room exists.
- Crime grade is F in this area — have there been break-ins, vandalism, or insurance claims at this property in the last 3 years? What carrier currently insures it and at what premium?
- What's the average days-on-market for RENTAL listings here right now (not sales)? A rising rental-DOM trend means longer vacancies and softer asking-rent achievability than the comps imply.
- What's the recent tenant-quality profile in this submarket — average credit score on applications, eviction rate, late-payment / NSF rate, and stable-employment percentage? A property-management company in the area should have these aggregated.
- How much new for-sale + rental construction is in the pipeline within 1–3 miles? Heavy new supply typically softens prices + rents 12–24 months out; constrained supply supports both.
Investment metrics
- 1% rule
- 0.95% ✗
- Cap rate
- 7.02%
- Cash-on-cash
- 2.59%
- DSCR
- 1.12
- GRM
- 8.8
CMA / ARV
- ARV (on-the-fly)
- $375,728
- Comps found
- 12
Show comp detail 12 sales within ~0.75 mi
| Address | Dist | Beds/Ba | Sqft | Sold | Price | $/sf | Match |
|---|---|---|---|---|---|---|---|
| 36 Lawrence Pl | 0.10mi | 4/1.5 | 2,089 (+2%) | 5mo | $295,000 | $141 | 88 |
| 419 Normal Ave | 0.10mi | 4/2.0 | 1,994 (-2%) | 11mo | $377,000 | $189 | 80 |
| 71 Hoyt St | 0.46mi | 4/2.0 | 2,160 (+6%) | 2mo | $190,000 | $88 | 66 |
| 264 Highland Ave | 0.58mi | 4/1.5 | 1,972 (-3%) | 6mo | $280,000 | $142 | 62 |
| 20 Chenango St | 0.37mi | 4/1.5 | 1,824 (-11%) | 8mo | $175,000 | $96 | 58 |
| 128 Dewitt St | 0.67mi | 4/2.0 | 2,064 (+1%) | 10mo | $380,000 | $184 | 57 |
| 555 W Ferry St | 0.58mi | 4/1.5 | 2,226 (+9%) | 4mo | $529,000 | $238 | 55 |
| 15 Greenwood Pl | 0.64mi | 4/2.5 | 1,987 (-3%) | 10mo | $425,000 | $214 | 54 |
| 402 Breckenridge St | 0.42mi | 3/2.5 (-1) | 2,136 (+5%) | 13mo | $435,000 | $204 | 53 |
| 499 Breckenridge St | 0.52mi | 5/2.0 (+1) | 2,175 (+6%) | 9mo | $416,005 | $191 | 50 |
| 655 Prospect Ave | 0.50mi | 4/2.5 | 1,754 (-14%) | 2mo | $310,000 | $177 | 47 |
| 193 Parkdale Ave | 0.65mi | 3/1.5 (-1) | 1,756 (-14%) | 12mo | $315,000 | $179 | 32 |
Match score weights: distance 35% · size 25% · config 20% · recency 20%. Top-matched comps best support the ARV.
Projected returns pro-forma
7.51% appreciation · 0.0% rent growth · sell at horizon
- IRR
- 18.8%
- Equity multiple
- 2.34×
- Total profit
- $74,798
- Equity at exit
- $145,282
- IRR
- 16.9%
- Equity multiple
- 4.64×
- Total profit
- $203,810
- Equity at exit
- $282,318
Cash invested: $55,972 (down + closing). Projections, not guarantees.
Landlord ↔ Tenant lean methodology
- Overall (STATE)
- 15 Strongly Tenant-Friendly
- State New York
- 15 Strongly Tenant-Friendly · D+10
- County
- — inherits STATE
- City
- — inherits STATE
ZIP-level market 14213
- Home prices YoY
- 1.7%
- Rents YoY
- -0.5%
- Active inventory
- 137
- Price-to-rent
- 8.8×
Monthly cashflow live
- Estimated rent
- $1,902 high interval (Pro) →
- Mortgage (P&I)
- −$1,048
- Tax est. 1.5%
- −$250 /mo · $2,998/yr
- Insurance
- −$83
- Flood insurance flood zone
- −$56 /mo · $666/yr
- HOA
- −$0
- Vacancy / Maint / Mgmt
- −$399
- Net cashflow
- $65
Break-even live
UW: 25.0% down · 7.5% · 30yr · 1.5% tax · 5.0% vac · 8.0% maint · 8.0% mgmt
Financing live
Cash to close
- Down payment
- $49,975
- Closing costs
- $5,997
- Reserves months
- —
- Total cash needed
- —
Loan-product check · same deal, 3 products live
Conventional
25% down · 7.5% · 30yr
- Down + closing
- —
- Monthly P&I
- —
- Monthly cashflow
- —
- DSCR
- —
- Eligible?
- —
Personal DTI + credit; lowest rate.
DSCR
20% down · 8.5% · 30yr
- Down + closing
- —
- Monthly P&I
- —
- Monthly cashflow
- —
- DSCR
- —
- Eligible?
- —
No personal income docs; deal must DSCR.
Hard money
10% down · 12.0% · 12mo
- Down + closing
- —
- Monthly P&I
- —
- Monthly cashflow
- —
- DSCR
- —
- Eligible?
- —
Short-term bridge; refi at stabilization.
Rent comps 15 comps
| Address | Beds | Baths | Sqft | Rent | $/sqft | DOM | Units | Dist |
|---|---|---|---|---|---|---|---|---|
| 405 W Ferry St Unit Lower Buffalo, NY | 3.0 | 1.0 | 2480 | $1,500 | $0.60 | 44d | 1 | 0.32mi |
| 11 Hoyt St Buffalo, NY | 4.0 | 1.0 | 2848 | $1,775 | $0.62 | 14d | 1 | 0.34mi |
| 161 16th St Buffalo, NY | 3.0 | 1.5 | 1500 | $2,000 | $1.33 | 24d | 1 | 0.38mi |
| 501 West Ave Buffalo, NY | 3.0 | 1.0 | 2552 | $1,700 | $0.67 | 14d | 1 | 0.45mi |
| 501 West Ave Buffalo, NY | 3.0 | 1.0 | 2552 | $1,850 | $0.72 | 20d | 1 | 0.45mi |
| 184 14th St Buffalo, NY | 4.0 | 2.0 | 1950 | $4,400 | $2.26 | 24d | 1 | 0.48mi |
| 83 Baynes St Unit Lower Buffalo, NY | 3.0 | 1.0 | 2550 | $1,850 | $0.73 | 14d | 1 | 0.49mi |
| 40 Putnam St Buffalo, NY | 4.0 | 1.0 | 1600 | $2,100 | $1.31 | 24d | 1 | 0.53mi |
| 124 Normal Ave Unit 2 Buffalo, NY | 3.0 | 1.0 | 1727 | $2,000 | $1.16 | 24d | 1 | 0.61mi |
| 330 Bryant St Buffalo, NY | 3.0 | 2.0 | 2224 | $2,200 | $0.99 | 20d | 1 | 0.64mi |
| 740 Elmwood Ave Buffalo, NY | 3.0 | 1.0 | 2000 | $1,995 | $1.00 | 14d | 1 | 0.78mi |
| 550 Busti Ave Unit 2 Buffalo, NY | 3.0 | 1.0 | 1638 | $1,500 | $0.92 | 44d | 1 | 0.90mi |
| 836 Richmond Ave Buffalo, NY | 4.0 | 3.5 | 1982 | $4,500 | $2.27 | 44d | 1 | 1.09mi |
| 100 Forest Ave Buffalo, NY | 2.0–4.0 | 2.0–4.0 | 1304 | $2,560 | $1.96 | 2d | 14 | 1.16mi |
| 7 Berkley Pl Buffalo, NY | 3.0 | 1.0 | 2879 | $1,250 | $0.43 | 3d | 1 | 1.50mi |
Listing history 17 events
-
2026-06-18days on market $199,900 Active 29 DOM
-
2026-06-17days on market $199,900 Active 28 DOM
-
2026-06-16days on market $199,900 Active 27 DOM
-
2026-06-15days on market $199,900 Active 26 DOM
-
2026-06-13days on market $199,900 Active 24 DOM
-
2026-06-13days on market $199,900 Active 23 DOM
-
2026-06-10days on market $199,900 Active 21 DOM
-
2026-06-09days on market $199,900 Active 20 DOM
-
2026-06-08days on market $199,900 Active 19 DOM
-
2026-06-07days on market $199,900 Active 18 DOM
-
2026-06-03days on market $199,900 Active 14 DOM
-
2026-06-02statusdays on market $199,900 Active 13 DOM
-
2026-06-01days on market $199,900 Active Under Contract 12 DOM
-
2026-05-31days on market $199,900 Active Under Contract 11 DOM
-
2026-05-22historical Active Under Contract
-
2026-05-20$199,900 Active
-
1997-04-01soldstatus $36,000
ⓘ Source: listings_history table (triggers on properties + properties_extension) + one-shot
backfill from property_details.listing_events for pre-trigger history.
Climate risk First Street
- Flood 7/10 Severe FEMA zone X (unshaded) · 77% chance over 30 yrs
- Wildfire 1/10 Low
- Heat 3/10 Moderate 7 d/yr ≥91°F today · 15 d/yr by 30 yrs out
- Wind 1/10 Low
- Air quality 4/10 Moderate 4 unhealthy d/yr today · 9 by 30 yrs out
Nearby sold comps map
Loading sold comps map…
Walkable amenities ~0.75 mi
Loading nearby amenities…
Taxation est. · year 1
- Rental income
- $22,818
- − Mortgage interest
- −$11,198
- − Property taxes
- −$2,998
- − Insurance
- −$1,666
- − Repairs & maintenance
- −$1,825
- − Management
- −$1,825
- − Depreciation
- −$5,815
- Taxable loss
- −$2,510
- Est. tax savings @ 24.0%
- +$602
- After-tax cash flow
- $1,385/yr
For passive investors: Depreciation is non-cash, so a rental often shows a tax loss while cash-flowing — sheltering income. Rental losses are passive: they offset passive income freely, and up to $25,000/yr can offset ordinary (W-2) income if you actively participate and your MAGI is under $100k (phasing out to $0 by $150k); unused losses carry forward. On sale, claimed depreciation is recaptured at up to 25%, and gains may owe capital-gains tax (a 1031 exchange can defer both). Figures are a year-1 estimate at your 24.0% rate — not tax advice; consult a CPA.
Schools (NCES district)
- District
- Buffalo City School District
- NCES district ID
- 3605850
- Math proficiency
- 41% ▲ 11.00%
- Reading proficiency
- 40% ▲ 7.00%
- Median HH income
- $31,665
- Composite
- 33.17/100
- National rank
- #5544
- State rank
- #535 of 590 in NY
Livability — Buffalo
- Score
- 77/100
- State rank
- #195
- US rank
- #3011
Category grades
Schools grade is shown separately in the Schools card above.
Census & demographics
- Census place
- Buffalo, NY
- County
- Erie County · 714,559 people
- City population
- 440,021
- Metro
- Buffalo-Cheektowaga, NY
- Population (ZIP)
- 24,107
- Household income
- $53,870
- Rent vs Own
- Severe rent burden
- 1501.0
Population outlook (Erie County) Hauer SSP2
- Today (2025)
- 933,037 people
- By 2030
- 935,181 · +0.2%
- By 2040
- 928,531 · -0.5%
- By 2050
- 905,725 · -2.9%
- By 2075
- 834,037 · -10.6%
- By 2100
- 708,033 · -24.1%
Race, ethnicity, and origin ACS 2023
- Neighborhood character
- Highly diverse neighborhood (Simpson 0.70)
- Race & ethnicity
- White 46% Hispanic / Latino 20% Black 18% Asian 12% Two or more races 10%
- Hispanic origin (detail)
- Mexican 1% Puerto Rican 16% Dominican 1%
- Common ancestry
- Romanian 6% Slovak 3% Lithuanian 3%
- Foreign-born
- 16% · Philippines, Canada, India
- Languages at home
- 68% English-only · Spanish 12% Other Asian/Pacific 7% Arabic 3%
Political lean MEDSL · Erie
- 2024 margin
- Lean D (+9.7) · D 54.8% · R 45.2%
- 2008→2024 swing
- -7.9pp toward R · 2008: 17.5pp · 2024: 9.7pp
- All cycles
- 2024: D+9.7 2020: D+14.7 2016: D+4.8 2012: D+15.6 2008: D+17.5
Not yet ingested
- Civics
- —
Market trends
- HPI YoY
- ▲ 7.51%
- Current HPI
- 448.4879
- Rent YoY
- ▼ -0.49%
- Metro
- Buffalo-Cheektowaga, NY
- State GDP YoY
- ▲ 2.60%
- F500 in state
- 92
Industry mix (Fortune 500 HQ in NY)
| Industry | F500 HQs | Revenue |
|---|---|---|
| Financial Services | 10 | $950B |
|
||
| Consumer Goods | 9 | $162B |
|
||
| Insurance | 4 | $225B |
|
||
| Telecommunications | 2 | $144B |
|
||
| Pharmaceuticals | 2 | $112B |
|
||
| Media / Entertainment | 2 | $69B |
|
||
Price history
+455.3% since first listed3 events — show timeline
- 2026-05-22 Contingent — WNYREIS
- 2026-05-20 Listed $199,900 WNYREIS
- 1997-04-01 Sold (Public Records) $36,000 Public Records
Property tax history
+4.4%/yrLatest (2025): $305 · +0.0% YoY. Source: county tax records.
Cash-flow waterfall
monthlySold comps — $/sqft
last 12 mo · ≤1 miLoading sold comps…