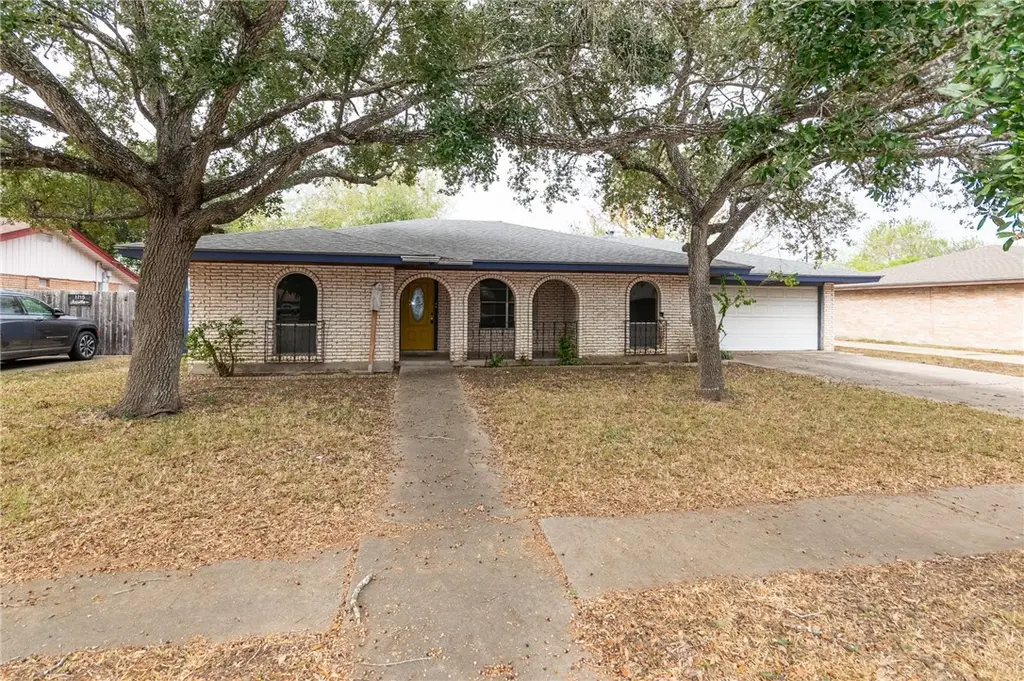
1709 Annette St · Kingsville, TX
Flood risk 1/10 · Minimal
- FEMA flood zone
- X (unshaded)
- Chance of flooding over 30 yrs
- 0.0%
- Est. flood insurance / yr
- $507 – $1,088
Fire risk 5/10 · Moderate
- Est. fire insurance / yr
- $1,222 – $2,270
Heat risk 9/10 · Severe
- Hot days now (above 111°F)
- 7 days/yr
- Hot days in 30 yrs
- 22 days/yr
Wind risk 9/10 · Severe
- Chance of severe wind over 30 yrs
- 99.0%
Air-quality risk 1/10 · Minimal
- Unhealthy air days now
- 0 days/yr
- Unhealthy air days in 30 yrs
- 0 days/yr
Risk factors via First Street. Map © Google.
Why this score? — see what drove the B grade
The composite is a weighted blend of 9 inputs, each scored 0–100. Each bar is that input's sub-score; the figure is the points it added to the 100-point composite (weight × sub-score).
- Cash flow +27.0/30.0
- ARV discount +15.0/15.0
- DSCR +9.4/10.0
- 1% rule +8.4/10.0
- Rent growth +4.3/5.0
- Livability +3.5/5.0
- Condition / age +2.5/5.0
- Schools +1.5/10.0
- Appreciation +0.0/10.0
$139,900
🖨 Deal sheet (PDF) 📄 Offer letter ✓ Due diligence
Listing remarks MLS
PRELIMENARY TERMITE SHOWS CLEAR IN FEB. 2000-SELLER IS EXEMPT FROM PROVIDING SELLER DISCLOSURE. COVERED PATIO, DOUBLE GARAGE, DEN, INGROUND POOL.
Key facts
- Brick property
- Huge backyard
- Covered patio
Tags
Property features AI
Finance
- HOA & community: Short-term rentals allowed
Exterior
- Parking: Attached front-entry garage; 2 covered garage spaces
- Security: Smoke detector(s)
- Utilities: Public water; Public sewer
- Home design: Single-story; Brick construction; Shingle roof; Slab foundation
- Construction: Brick construction; Shingle roof; Slab foundation; Built as a single-story home
- Exterior features: Covered patio; Wood fencing; Interior lot
Interior
- Kitchen: Electric cooktop; Range hood
- Flooring: Carpet; Tile
- Bathrooms: 2 full bathrooms
- Heating & cooling: Central heating (electric); Central air conditioning
- Interior features: Split bedrooms; Carpet flooring; Tile flooring
- Laundry & utility: Washer hookup; Dryer hookup
Neighborhood map
What this means for you Summary
Snapshot
- This is a 3-bed/2.0-bath single-family listed at $140k.
Deal economics
- At list price, monthly cash flow is $393 ($5k/yr) — positive.
- The deal already cash-flows at list — no discount required.
- Meets the 1% rule at list price ($2k rent vs $140k).
- Recommended offer: $123k (12.0% below list) — sets the bar for market timing.
- Cap rate 9.7% vs local median 5.4% in Kingsville — top-decile yield for the area; either an underpriced asset or a hidden risk that comps aren't pricing in. Stress-test before assuming the spread holds.
Location & tenants
- Location reads 70/100 on livability (#364 in TX) — a middle-class / working-renter tenant base. Strengths: cost of living A+, housing A+, health & safety A+; Watch: schools D+, employment D, amenities F.
- Kingsville ISD (town): math 13% / reading 22% proficiency, ranked #800 of 826 in TX (top 97%) — low school quality limits family demand, transient renter base, plan for 1-2y turnover; 71% free/reduced lunch — lower-income household profile, screen leases tightly.
- Market conditions: Rents rising fast (+7.2%/yr); 216 active listings in the ZIP; 5 comparable units currently listed for rent nearby; rentals at typical pace (median 22d on market — plan ~3-4 weeks tenant-placement turnaround); 24 units permitted in Kleberg County in 2024 (0 in 5+ unit buildings).
- This rent runs 37% of the median local income ($61k/yr) — at the standard rent-burdened threshold; future hikes will face affordability resistance.
Forward outlook
- Local home prices are declining (-3.0%/yr); year-one equity from $967 of loan paydown is wiped out by about $4k of value loss. Plan a longer hold.
- Kleberg County population projected at +9% by 2050 — modest demand growth; plan on rents tracking national, not racing it.
- At projected returns (-3.0% appreciation + 7.2% rent growth), your $39k cash investment doubles in ~7 years — after that, you're playing with house money.
Negotiation context
- It's been on market 146 days — a 12% lower offer ($123k) is reasonable based on typical stale-listing flexibility.
- 3 sale attempts since 26y ago; this cycle's ask has dropped $30k (18%) from the opening price — seller is motivated, your offer sets the floor, not the list.
Risks & watch-outs
- Watch-outs: property tax is 2.6% of price.
- Climate carrying-cost: severe wind risk, 99% chance of damaging wind over 30y; moderate wildfire risk; extreme-heat days projected 7→22/yr by 2055 (HVAC capex compounding) — expect insurance premiums to compound above CPI over the hold.
Questions for the listing agent
- It's been on market 146 days. Have you received any prior offers? Is the seller open to a 12% concession, seller financing, or rate buy-down credit?
- Built in 1968 — when were the roof, HVAC, electrical panel, plumbing, and water heater last replaced?
- Property tax is high relative to price — has the assessment been appealed recently, and will the sale trigger a re-assessment?
- Why hasn't it sold? Are there any deal-killer items the seller is aware of (foundation, flood, title, zoning, code violations)?
- Is there a deadline driving the sale (1031 exchange, divorce, estate, relocation)? That informs how much negotiation room exists.
- Schools are D-rated, which usually means shorter tenancies and higher turnover. Who's the typical renter profile here, and what's been the actual vacancy rate?
- What's the average days-on-market for RENTAL listings here right now (not sales)? A rising rental-DOM trend means longer vacancies and softer asking-rent achievability than the comps imply.
- What's the recent tenant-quality profile in this submarket — average credit score on applications, eviction rate, late-payment / NSF rate, and stable-employment percentage? A property-management company in the area should have these aggregated.
- How much new for-sale + rental construction is in the pipeline within 1–3 miles? Heavy new supply typically softens prices + rents 12–24 months out; constrained supply supports both.
Investment metrics
- 1% rule
- 1.34% ✓
- Cap rate
- 9.67%
- Cash-on-cash
- 12.05%
- DSCR
- 1.54
- GRM
- 6.2
CMA / ARV
- ARV (on-the-fly)
- $199,176
- Comps found
- 12
Show comp detail 12 sales within ~0.75 mi
| Address | Dist | Beds/Ba | Sqft | Sold | Price | $/sf | Match |
|---|---|---|---|---|---|---|---|
| 1101 Elizabeth Ave | 0.04mi | 3/2.0 | 1,660 (+8%) | 2mo | $220,000 | $133 | 84 |
| 1410 Lawndale Dr | 0.21mi | 3/1.5 | 1,584 (+3%) | 3mo | $129,900 | $82 | 81 |
| 1760 Paraiso Dr | 0.55mi | 3/2.0 | 1,602 (+4%) | 1mo | $322,800 | $201 | 67 |
| 1007 S 21st St | 0.70mi | 3/2.0 | 1,556 (+1%) | 1mo | $163,900 | $105 | 65 |
| 1482 Virginia Ave | 0.57mi | 3/2.0 | 1,465 (-5%) | 2mo | $282,000 | $192 | 63 |
| 1513 Parker St | 0.43mi | 3/2.0 | 1,706 (+10%) | 2mo | $220,000 | $129 | 61 |
| 1013 S 21st St | 0.69mi | 3/2.0 | 1,480 (-4%) | 1mo | $165,000 | $111 | 60 |
| 1406 S 11th St | 0.45mi | 4/1.5 (+1) | 1,426 (-8%) | 4mo | $169,900 | $119 | 56 |
| 1213 Palm Ave | 0.41mi | 3/2.0 | 1,770 (+15%) | 4mo | $249,999 | $141 | 53 |
| 622 S 12th St | 0.75mi | 3/2.0 | 1,368 (-11%) | 2mo | $24,950 | $18 | 44 |
| 230 Carol Ave | 0.67mi | 3/2.0 | 1,346 (-13%) | 5mo | $123,000 | $91 | 43 |
| 829 Inez St | 0.73mi | 3/2.0 | 1,342 (-13%) | 1mo | $185,000 | $138 | 43 |
Match score weights: distance 35% · size 25% · config 20% · recency 20%. Top-matched comps best support the ARV.
Projected returns pro-forma
-3.0% appreciation · 7.18% rent growth · sell at horizon
- IRR
- 6.7%
- Equity multiple
- 1.27×
- Total profit
- $10,716
- Equity at exit
- $20,860
- IRR
- 19.7%
- Equity multiple
- 3.01×
- Total profit
- $78,851
- Equity at exit
- $12,096
Cash invested: $39,172 (down + closing). Projections, not guarantees.
Landlord ↔ Tenant lean methodology
- Overall (STATE)
- 87 Strongly Landlord-Friendly
- State Texas
- 87 Strongly Landlord-Friendly · R+5
- County
- — inherits STATE
- City
- — inherits STATE
ZIP-level market 78363
- Rents YoY
- 7.2%
- Active inventory
- 216
- Price-to-rent
- 6.2×
Monthly cashflow live
- Estimated rent
- $1,879 high interval (Pro) →
- Mortgage (P&I)
- −$734
- Tax from tax record
- −$299 /mo · $3,594/yr
- Insurance
- −$58
- HOA
- −$0
- Vacancy / Maint / Mgmt
- −$395
- Net cashflow
- $393
Break-even live
Sensitivity live
| Price | -10% $472 | -5% $433 | +0% $393 | +5% $354 | +10% $314 |
|---|---|---|---|---|---|
| Rent | -10% $245 | -5% $319 | +0% $393 | +5% $467 | +10% $542 |
| Rate | -1.0pp $464 | -0.5pp $429 | base $393 | +0.5pp $357 | +1.0pp $320 |
UW: 25.0% down · 7.5% · 30yr · 1.5% tax · 5.0% vac · 8.0% maint · 8.0% mgmt
Financing live
Cash to close
- Down payment
- $34,975
- Closing costs
- $4,197
- Reserves months
- —
- Total cash needed
- —
Loan-product check · same deal, 3 products live
Conventional
25% down · 7.5% · 30yr
- Down + closing
- —
- Monthly P&I
- —
- Monthly cashflow
- —
- DSCR
- —
- Eligible?
- —
Personal DTI + credit; lowest rate.
DSCR
20% down · 8.5% · 30yr
- Down + closing
- —
- Monthly P&I
- —
- Monthly cashflow
- —
- DSCR
- —
- Eligible?
- —
No personal income docs; deal must DSCR.
Hard money
10% down · 12.0% · 12mo
- Down + closing
- —
- Monthly P&I
- —
- Monthly cashflow
- —
- DSCR
- —
- Eligible?
- —
Short-term bridge; refi at stabilization.
Rent comps 5 comps
| Address | Beds | Baths | Sqft | Rent | $/sqft | DOM | Units | Dist |
|---|---|---|---|---|---|---|---|---|
| 1342 Virginia Ave Kingsville, TX | 3.0 | 2.0 | 1764 | $2,500 | $1.42 | 21d | 1 | 0.57mi |
| 908 E Doddridge Ave Kingsville, TX | 3.0 | 1.0 | 1100 | $850 | $0.77 | 44d | 1 | 0.64mi |
| 915 S 23rd St Kingsville, TX | 3.0 | 2.0 | 1713 | $1,900 | $1.11 | 14d | 1 | 0.80mi |
| 1107 E Kenedy Ave Kingsville, TX | 3.0 | 2.5 | 1526 | $2,300 | $1.51 | 21d | 1 | 0.93mi |
| 2007 Margaret Ln Kingsville, TX | 3.0 | 2.0 | 1520 | $1,875 | $1.23 | 21d | 1 | 1.09mi |
Listing history 12 events
-
2026-05-07status Pending
-
2026-04-30historical
-
2026-04-22price $139,900
-
2026-03-03price $155,000
-
2025-12-04$170,000 Active
-
2024-05-10price $198,900
-
2024-04-30price $208,888
-
2024-04-10$218,888 Active
-
2021-10-29soldstatus
-
2004-01-16soldstatus
-
2000-06-09soldstatus 145-char remark
Show marketing remark (145 chars)
PRELIMENARY TERMITE SHOWS CLEAR IN FEB. 2000-SELLER IS EXEMPT FROM PROVIDING SELLER DISCLOSURE. COVERED PATIO, DOUBLE GARAGE, DEN, INGROUND POOL.
-
2000-02-29$73,000 145-char remark
Show marketing remark (145 chars)
PRELIMENARY TERMITE SHOWS CLEAR IN FEB. 2000-SELLER IS EXEMPT FROM PROVIDING SELLER DISCLOSURE. COVERED PATIO, DOUBLE GARAGE, DEN, INGROUND POOL.
ⓘ Source: listings_history table (triggers on properties + properties_extension) + one-shot
backfill from property_details.listing_events for pre-trigger history.
Tax reassessment forecast TX · Resets to sale price
- Current annual tax
- $3,594 · $299/mo
- Projected year-2 tax
- $3,594 · $299/mo
- Expected delta
- $0/yr ($0/mo · 0.0%)
ⓘ Screening estimate from a state-policy table — verify with the county assessor before closing.
Climate risk First Street
- Flood 1/10 Low FEMA zone X (unshaded) · 0% chance over 30 yrs
- Wildfire 5/10 Major
- Heat 9/10 Extreme 7 d/yr ≥111°F today · 22 d/yr by 30 yrs out
- Wind 9/10 Extreme 99% chance of damaging wind over 30 yrs
- Air quality 1/10 Low 0 unhealthy d/yr today · 0 by 30 yrs out
Nearby sold comps map
Loading sold comps map…
Walkable amenities ~0.75 mi
Loading nearby amenities…
Taxation est. · year 1
- Rental income
- $22,552
- − Mortgage interest
- −$7,837
- − Property taxes
- −$3,594
- − Insurance
- −$700
- − Repairs & maintenance
- −$1,804
- − Management
- −$1,804
- − Depreciation
- −$4,070
- Taxable income
- $2,744
- Est. tax owed @ 24.0%
- −$658
- After-tax cash flow
- $4,060/yr
For passive investors: Depreciation is non-cash, so a rental often shows a tax loss while cash-flowing — sheltering income. Rental losses are passive: they offset passive income freely, and up to $25,000/yr can offset ordinary (W-2) income if you actively participate and your MAGI is under $100k (phasing out to $0 by $150k); unused losses carry forward. On sale, claimed depreciation is recaptured at up to 25%, and gains may owe capital-gains tax (a 1031 exchange can defer both). Figures are a year-1 estimate at your 24.0% rate — not tax advice; consult a CPA.
Schools (NCES district)
- District
- Kingsville ISD
- NCES district ID
- 4825680
- Math proficiency
- 13% ▼ -22.00%
- Reading proficiency
- 22% ▼ -7.00%
- Median HH income
- $36,308
- Composite
- 14.5/100
- National rank
- #9425
- State rank
- #800 of 826 in TX
Livability — Kingsville
- Score
- 70/100
- State rank
- #364
- US rank
- #7787
Category grades
Schools grade is shown separately in the Schools card above.
Census & demographics
- Census place
- Kingsville, TX
- County
- Kleberg County · 28,920 people
- City population
- 28,920
- Metro
- Kingsville, TX
- Population (ZIP)
- 28,920
- Household income
- $60,574
- Rent vs Own
- Severe rent burden
- 1663.0
Population outlook (Kleberg County) Hauer SSP2
- Today (2025)
- 31,615 people
- By 2030
- 32,054 · +1.4%
- By 2040
- 33,008 · +4.4%
- By 2050
- 34,536 · +9.2%
- By 2075
- 40,931 · +29.5%
- By 2100
- 46,001 · +45.5%
Race, ethnicity, and origin ACS 2023
- Neighborhood character
- Predominantly Hispanic (72%)
- Race & ethnicity
- Hispanic / Latino 72% Two or more races 36% White 20% Black 3% Asian 1% Native American 1%
- Hispanic origin (detail)
- Mexican 67%
- Common ancestry
- Italian 2% Slovak 1% Portuguese 1%
- Foreign-born
- 7% · Canada, China
- Languages at home
- 65% English-only · Spanish 32% Other Indo-European 1%
Political lean MEDSL · Kleberg
- 2024 margin
- R (+12.7) · D 43.3% · R 56.1%
- 2008→2024 swing
- -20.0pp toward R · 2008: 7.2pp · 2024: -12.7pp
- All cycles
- 2024: R+12.7 2020: R+1.7 2016: D+3.7 2012: D+7.8 2008: D+7.2
Not yet ingested
- Civics
- —
Market trends
- HPI YoY
- ▼ -87.12%
- Current HPI
- 147.6473
- Rent YoY
- ▲ 7.18%
- Metro
- Kingsville, TX
- State GDP YoY
- ▲ 3.95%
- F500 in state
- 110
Industry mix (Fortune 500 HQ in TX)
| Industry | F500 HQs | Revenue |
|---|---|---|
| Energy | 16 | $1,198B |
|
||
| Technology | 5 | $198B |
|
||
| Engineering / Construction | 4 | $72B |
|
||
| Energy Services | 3 | $60B |
|
||
| Utilities | 3 | $41B |
|
||
| Healthcare | 2 | $330B |
|
||
Price history
+91.6% since first listed12 events — show timeline
- 2026-05-07 Pending — CBMLS
- 2026-04-30 Delisted — CBMLS
- 2026-04-22 Price Changed $139,900 CBMLS
- 2026-03-03 Price Changed $155,000 CBMLS
- 2025-12-04 Listed $170,000 CBMLS
- 2024-05-10 Price Changed $198,900 CBMLS
- 2024-04-30 Price Changed $208,888 CBMLS
- 2024-04-10 Listed $218,888 CBMLS
- 2021-10-29 Sold (Public Records) — Public Records
- 2004-01-16 Sold (Public Records) — Public Records
- 2000-06-09 Sold (MLS) — CBMLS
- 2000-02-29 Listed $73,000 CBMLS
Property tax history
-0.1%/yrLatest (2025): $3,594 · +19.7% YoY. Source: county tax records.
Cash-flow waterfall
monthlySold comps — $/sqft
last 12 mo · ≤1 miLoading sold comps…