 Triplex
236 Gunnison Ave · Grand Junction, CO
Flood risk 1/10 · Minimal
- FEMA flood zone
- X (unshaded)
- Chance of flooding over 30 yrs
- 0.0%
- Est. flood insurance / yr
- $507 – $1,088
Fire risk 1/10 · Minimal
- Est. fire insurance / yr
- $939 – $1,743
Heat risk 5/10 · Moderate
- Hot days now (above 96°F)
- 7 days/yr
- Hot days in 30 yrs
- 18 days/yr
Wind risk 1/10 · Minimal
- Chance of severe wind over 30 yrs
- —
Air-quality risk 2/10 · Minimal
- Unhealthy air days now
- 0 days/yr
- Unhealthy air days in 30 yrs
- 1 days/yr
Risk factors via First Street. Map © Google.
Why this score? — see what drove the D grade
The composite is a weighted blend of 9 inputs, each scored 0–100. Each bar is that input's sub-score; the figure is the points it added to the 100-point composite (weight × sub-score).
- Cash flow +14.0/30.0
- ARV discount +7.5/15.0
- DSCR +4.2/10.0
- Rent growth +4.2/5.0
- Livability +4.0/5.0
- Schools +2.8/10.0
- 1% rule +2.6/10.0
- Condition / age +2.5/5.0
- Appreciation +0.0/10.0
$719,950
🖨 Deal sheet 📄 Offer letter ✓ Due diligence
Multi-family units
County records classify this as Multi-Family (2-4 Unit). Listing-text estimate: 3 units. confirmed
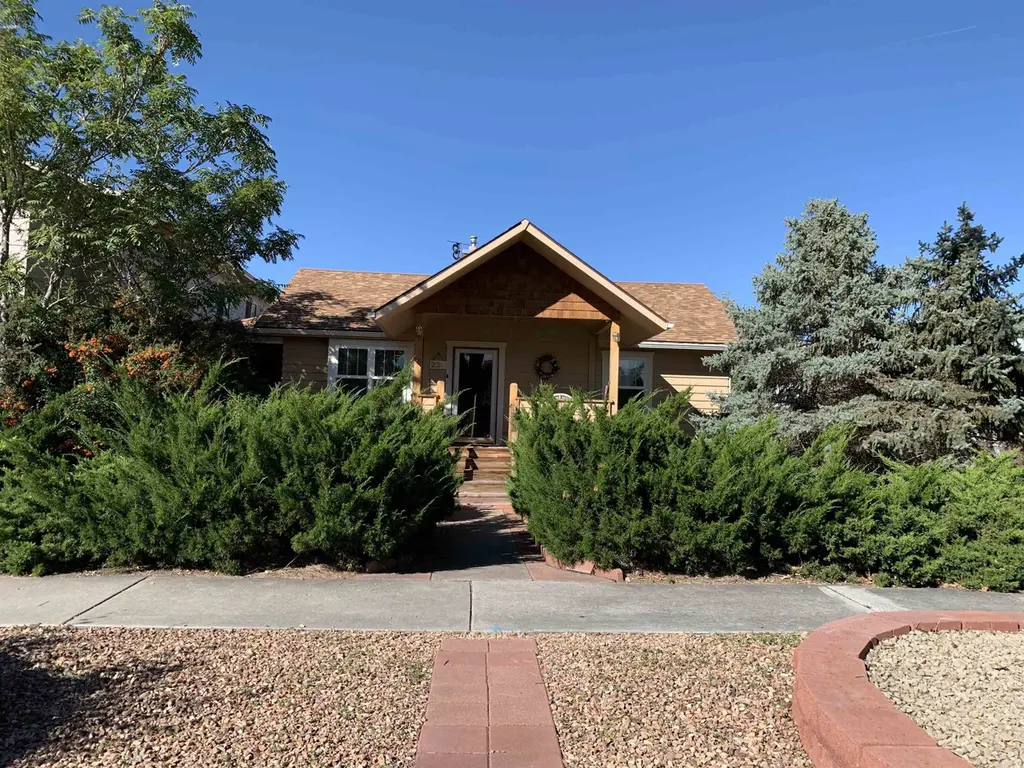
Listing remarks
Triplex in the heart of downtown Grand Junction. Walk, bike or drive to everything GJ has to offer. Only 1.2 miles from CMU. Owner is a professionally licensed architect and remodel / updating utilized top of the line materials and has all been permitted. Unit 1 is the upper unit, 2 bedrooms and 2 bathrooms. Unit 2 is the lower level with a separate entrance, 1 bedroom and 1 bathroom, Unit 3 is detached behind the main house with 1 bedroom and 1 bathroom. 1 car attached garage PLUS partially cover (4) additional parking space. All tenants are long term with good rental histories. The owner occupies Unit 1. Upgrades and remodel to numerouse to list. This is not a drive by. Serious Buyers don
Key facts
- Upgrades and remodel
- Separate entrance
- Long term tenants
Tags
Property features AI
Finance
- Other: Lot dimensions approximately 151' x 50' (0.17 acre); City-maintained paved street frontage
- HOA & community: No association amenities
Exterior
- Utilities: Public water; Sewer connected
- Home design: Residential income property (triplex); Single-story; Faces south
- Construction: Stucco and wood siding exterior; Asphalt/composition roof; Slab foundation; Built as part of a triplex (multi-family)
- Exterior features: Patio; Landscaped lot; Outbuilding / shed(s)
Interior
- Kitchen: Dishwasher; Electric oven; Electric range; Disposal; Microwave; Refrigerator; Range hood
- Flooring: Hardwood flooring; Laminate flooring; Simulated wood flooring
- Heating & cooling: Forced air heating; Hot water heating; Natural gas heat source; Evaporative cooling
- Interior features: Laminate countertops; Finished full basement with exterior entry
Neighborhood map
What this means for you Summary
Snapshot
- This is a 3 × 4-bed/4.0-bath units multifamily listed at $720k.
Deal economics
- At list price, monthly cash flow is $89 ($1k/yr) — positive. Per door: $30/mo.
- The deal already cash-flows at list — no discount required.
- To meet the 1% rule (rent ≥ 1% of price), the offer needs to be $546k (24.2% below list).
- Recommended offer: $546k (24.2% below list) — sets the bar for 1% rule.
- Cap rate 6.4% vs local median 3.1% in Grand Junction — top-decile yield for the area; either an underpriced asset or a hidden risk that comps aren't pricing in. Stress-test before assuming the spread holds.
Location & tenants
- Location reads 79/100 on livability (#15 in CO, #2,222 nationally) — a middle-class / working-renter tenant base. Strengths: commute A+, health & safety A+, housing A; Watch: employment D+, crime F.
- Mesa County Valley School District No. 51 (suburban): math 26% / reading 38% proficiency, ranked #43 of 86 in CO (top 50%) — families likely to look elsewhere, expect single-tenant / working-renter base with shorter leases.
- Zoned schools: Chipeta Elementary School (math 17% / reading 22%, grade F, #706 of 966 statewide, top 75%, 375 students, 66% FRL); West Middle School (math 28% / reading 35%, grade F, #121 of 270 statewide, top 46%, 316 students, 34% FRL); Grand Junction High School (math 25% / reading 53%, grade F, #188 of 381 statewide, top 49%, 1,522 students, 36% FRL).
- Market conditions: Rents rising fast (+6.9%/yr); 161 active listings in the ZIP; 8 comparable units currently listed for rent nearby; rentals leasing fast (median 14d on market — plan ~1-2 weeks tenant-placement turnaround); 1,014 units permitted in Mesa County in 2024 (240 in 5+ unit buildings).
- At $5,460/mo this rent would consume 122% of the median local household income ($54k/yr) (locally 1317% of renters already pay >50% of income on rent) — very limited rent-growth headroom before tenants either downsize or default.
Forward outlook
- Local home prices are declining (-3.0%/yr); year-one equity from $5k of loan paydown is wiped out by about $22k of value loss. Plan a longer hold.
Negotiation context
- It's been on market 93 days — a 9% lower offer ($655k) is reasonable based on typical stale-listing flexibility.
- 3 sale attempts with the ask held roughly flat each time — persistent listings suggest the price (not the market) is what's stuck; bring a comps-based counter.
- Current owner paid $106k; list at $720k implies a 576% gain — meaningful room to come down on a strong offer.
Risks & watch-outs
- Watch-outs: built in 1939 — expect roof / HVAC / electrical / plumbing capex.
- Climate carrying-cost: extreme-heat days projected 7→18/yr by 2055 (HVAC capex compounding) — expect insurance premiums to compound above CPI over the hold.
Questions for the listing agent
- It's been on market 93 days. Have you received any prior offers? Is the seller open to a 24% concession, seller financing, or rate buy-down credit?
- Can we see the unit-by-unit rent roll, current vacancy, and any below-market leases? What's the average tenancy length?
- What capital expenditures (roof, boiler, parking lot, exteriors) have been made in the last 5 years, and what's planned in the next 2?
- Built in 1939 — when were the roof, HVAC, electrical panel, plumbing, and water heater last replaced?
- Why hasn't it sold? Are there any deal-killer items the seller is aware of (foundation, flood, title, zoning, code violations)?
- Is there a deadline driving the sale (1031 exchange, divorce, estate, relocation)? That informs how much negotiation room exists.
- Schools are D-rated, which usually means shorter tenancies and higher turnover. Who's the typical renter profile here, and what's been the actual vacancy rate?
- Crime grade is F in this area — have there been break-ins, vandalism, or insurance claims at this property in the last 3 years? What carrier currently insures it and at what premium?
- The area grade is low — what's the realistic commute time and amenity access for the typical tenant pool here? Any planned neighborhood developments (good or bad) we should know about?
- What's the average days-on-market for RENTAL listings here right now (not sales)? A rising rental-DOM trend means longer vacancies and softer asking-rent achievability than the comps imply.
- What's the recent tenant-quality profile in this submarket — average credit score on applications, eviction rate, late-payment / NSF rate, and stable-employment percentage? A property-management company in the area should have these aggregated.
- How much new apartment / multifamily construction is in the pipeline within 1–3 miles? Heavy new supply (>2% of stock underway) typically softens rents 12–24 months out; light construction supports rent growth.
Investment metrics
- 1% rule
- 0.76% ✗
- Cap rate
- 6.44%
- Cash-on-cash
- 0.53%
- DSCR
- 1.02
- GRM
- 11.0
CMA / ARV
No comps found within radius.
Projected returns pro-forma
-3.0% appreciation · 6.92% rent growth · sell at horizon
- IRR
- -11.8%
- Equity multiple
- 0.56×
- Total profit
- $-88,964
- Equity at exit
- $107,347
- IRR
- 1.7%
- Equity multiple
- 1.14×
- Total profit
- $27,907
- Equity at exit
- $62,248
Cash invested: $201,586 (down + closing). Projections, not guarantees.
Landlord ↔ Tenant lean methodology
- Overall (STATE)
- 38 Tenant-Leaning
- State Colorado
- 38 Tenant-Leaning · D+4
- County
- — inherits STATE
- City
- — inherits STATE
ZIP-level market 81501
- Rents YoY
- 6.9%
- Active inventory
- 161
- Price-to-rent
- 33.0×
Monthly cashflow live
- Estimated rent
- $5,460 medium interval (Pro) →
- Mortgage (P&I)
- −$3,775
- Tax from tax record
- −$149 /mo · $1,782/yr
- Insurance
- −$300
- HOA
- −$0
- Vacancy / Maint / Mgmt
- −$1,147
- Net cashflow
- $89
Break-even live
3-unit breakdown (identical units grouped — click to expand)
| Units | Beds | Baths | Est. rent |
|---|---|---|---|
| 3× units | 4 | 4 | $5,460 |
| #1 | 4 | 4 | $1,820 |
| #2 | 4 | 4 | $1,820 |
| #3 | 4 | 4 | $1,820 |
| Total (3 units) | $5,460 | ||
UW: 25.0% down · 7.5% · 30yr · 1.5% tax · 5.0% vac · 8.0% maint · 8.0% mgmt
Financing live
Cash to close
- Down payment
- $179,988
- Closing costs
- $21,598
- Reserves months
- —
- Total cash needed
- —
Loan-product check · same deal, 3 products live
Conventional
25% down · 7.5% · 30yr
- Down + closing
- —
- Monthly P&I
- —
- Monthly cashflow
- —
- DSCR
- —
- Eligible?
- —
Personal DTI + credit; lowest rate.
DSCR
20% down · 8.5% · 30yr
- Down + closing
- —
- Monthly P&I
- —
- Monthly cashflow
- —
- DSCR
- —
- Eligible?
- —
No personal income docs; deal must DSCR.
Hard money
10% down · 12.0% · 12mo
- Down + closing
- —
- Monthly P&I
- —
- Monthly cashflow
- —
- DSCR
- —
- Eligible?
- —
Short-term bridge; refi at stabilization.
Rent comps 8 comps
| Address | Beds | Baths | Sqft | Rent | $/sqft | DOM | Units | Dist |
|---|---|---|---|---|---|---|---|---|
| 909 Ouray Ave Grand Junction, CO | 4.0 | 1.0 | 1560 | $2,000 | $1.28 | 21d | 1 | 0.66mi |
| 1015 Belford Ave Grand Junction, CO | 4.0 | 2.0 | 1518 | $2,256 | $1.49 | 13d | 1 | 0.75mi |
| 530 Lilac Ln Grand Junction, CO | 3.0 | 3.0 | 1964 | $2,100 | $1.07 | 13d | 1 | 0.96mi |
| 1290 N 13th St Grand Junction, CO | 4.0 | 3.0 | 1700 | $3,365 | $1.98 | 13d | 1 | 1.06mi |
| 457 N 19th St Grand Junction, CO | 5.0 | 2.0 | 2356 | $2,800 | $1.19 | 13d | 1 | 1.39mi |
| 2040 N 15th St Grand Junction, CO | 4.0 | 2.0 | 1351 | $2,600 | $1.92 | 13d | 1 | 1.42mi |
| 401 E Mayfield Dr Grand Junction, CO | 3.0 | 2.0 | 1295 | $2,300 | $1.78 | 13d | 1 | 1.43mi |
| 942 Northern Way Unit 1 Grand Junction, CO | 3.0 | 2.0 | 1276 | $1,800 | $1.41 | 13d | 1 | 1.48mi |
Listing history 22 events
-
2026-06-19days on market $719,950 Active 93 DOM
-
2026-06-18days on market $719,950 Active 92 DOM
-
2026-06-17days on market $719,950 Active 91 DOM
-
2026-06-16days on market $719,950 Active 90 DOM
-
2026-06-15days on market $719,950 Active 89 DOM
-
2026-06-14days on market $719,950 Active 87 DOM
-
2026-06-13days on market $719,950 Active 86 DOM
-
2026-06-10days on market $719,950 Active 84 DOM
-
2026-06-09days on market $719,950 Active 83 DOM
-
2026-06-08days on market $719,950 Active 82 DOM
-
2026-06-07days on market $719,950 Active 81 DOM
-
2026-06-05days on market $719,950 Active 78 DOM
-
2026-06-02days on market $719,950 Active 76 DOM
-
2026-06-01days on market $719,950 Active 75 DOM
-
2026-05-31days on market $719,950 Active 74 DOM
-
2026-05-30days on market $719,950 Active 73 DOM
-
2026-03-17$719,950 Active
-
2025-10-03status Active
-
2025-09-13price $728,900
-
2025-06-09$749,000 Active
-
2000-05-24soldstatus $106,500
-
1996-11-21soldstatus $91,000
ⓘ Source: listings_history table (triggers on properties + properties_extension) + one-shot
backfill from property_details.listing_events for pre-trigger history.
Tax reassessment forecast CO · Resets to sale price
- Current annual tax
- $1,782 · $149/mo
- Projected year-2 tax
- $3,960 · $330/mo
- Expected delta
- +$2,178/yr (+$181/mo · 122.2%)
ⓘ Screening estimate from a state-policy table — verify with the county assessor before closing.
Climate risk First Street
- Flood 1/10 Low FEMA zone X (unshaded) · 0% chance over 30 yrs
- Wildfire 1/10 Low
- Heat 5/10 Major 7 d/yr ≥96°F today · 18 d/yr by 30 yrs out
- Wind 1/10 Low
- Air quality 2/10 Low 0 unhealthy d/yr today · 1 by 30 yrs out
Nearby sold comps map
Loading sold comps map…
Walkable amenities ~0.75 mi
Loading nearby amenities…
Taxation est. · year 1
- Rental income
- $65,520
- − Mortgage interest
- −$40,328
- − Property taxes
- −$1,782
- − Insurance
- −$3,600
- − Repairs & maintenance
- −$5,242
- − Management
- −$5,242
- − Depreciation
- −$20,944
- Taxable loss
- −$11,617
- Est. tax savings @ 24.0%
- +$2,788
- After-tax cash flow
- $3,861/yr
For passive investors: Depreciation is non-cash, so a rental often shows a tax loss while cash-flowing — sheltering income. Rental losses are passive: they offset passive income freely, and up to $25,000/yr can offset ordinary (W-2) income if you actively participate and your MAGI is under $100k (phasing out to $0 by $150k); unused losses carry forward. On sale, claimed depreciation is recaptured at up to 25%, and gains may owe capital-gains tax (a 1031 exchange can defer both). Figures are a year-1 estimate at your 24.0% rate — not tax advice; consult a CPA.
Schools (NCES district)
- District
- Mesa County Valley School District No. 51
- NCES district ID
- 0804350
- Math proficiency
- 26% ▲ 1.00%
- Reading proficiency
- 38% ▬ 0.00%
- Median HH income
- $50,189
- Composite
- 27.83/100
- National rank
- #6884
- State rank
- #43 of 86 in CO
Livability — Grand Junction
- Score
- 79/100
- State rank
- #15
- US rank
- #2222
Category grades
Schools grade is shown separately in the Schools card above.
Census & demographics
- Census place
- Grand Junction, CO
- County
- Mesa County · 143,088 people
- City population
- 113,583
- Metro
- Grand Junction, CO
- Population (ZIP)
- 24,011
- Household income
- $53,666
- Rent vs Own
- Severe rent burden
- 1317.0
Population outlook (Mesa County) Hauer SSP2
- Today (2025)
- 153,000 people
- By 2030
- 154,479 · +1.0%
- By 2040
- 155,257 · +1.5%
- By 2050
- 153,384 · +0.3%
- By 2075
- 144,735 · -5.4%
- By 2100
- 123,825 · -19.1%
Race, ethnicity, and origin ACS 2023
- Neighborhood character
- Predominantly White (76%)
- Race & ethnicity
- White 76% Hispanic / Latino 17% Two or more races 9% Native American 1% Asian 1% Black 1%
- Hispanic origin (detail)
- Mexican 9%
- Common ancestry
- Slovak 3% Lithuanian 3% Italian 3%
- Foreign-born
- 5% · Canada
- Languages at home
- 93% English-only · Spanish 5% Russian/Polish/Slavic 1% Other Asian/Pacific 1%
Political lean MEDSL · Mesa
- 2024 margin
- Strong R (+24.3) · D 36.6% · R 61.0% · Other 2.4%
- 2008→2024 swing
- +5.2pp toward D · 2008: -29.5pp · 2024: -24.3pp
- All cycles
- 2024: R+24.3 2020: R+28.0 2016: R+36.3 2012: R+32.8 2008: R+29.5
Not yet ingested
- Civics
- —
Market trends
- HPI YoY
- ▼ -385.18%
- Current HPI
- 331.3836
- Rent YoY
- ▲ 6.92%
- Metro
- Grand Junction, CO
- State GDP YoY
- ▲ 1.95%
- F500 in state
- 14
Industry mix (Fortune 500 HQ in CO)
| Industry | F500 HQs | Revenue |
|---|---|---|
| Technology Distribution | 1 | $31B |
|
||
| Food / Agriculture | 1 | $18B |
|
||
| Packaging | 1 | $14B |
|
||
| Healthcare | 1 | $13B |
|
||
| Energy | 1 | $10B |
|
||
| Technology | 1 | $4B |
|
||
Price history
+691.2% since first listed6 events — show timeline
- 2026-03-17 Listed $719,950 GJARA
- 2025-10-03 Relisted — GJARA
- 2025-09-13 Price Changed $728,900 GJARA
- 2025-06-09 Listed $749,000 GJARA
- 2000-05-24 Sold (Public Records) $106,500 Public Records
- 1996-11-21 Sold (Public Records) $91,000 Public Records
Property tax history
+4.8%/yrLatest (2025): $1,782 · +68.4% YoY. Source: county tax records.
Cash-flow waterfall
monthlySold comps — $/sqft
last 12 mo · ≤1 miLoading sold comps…