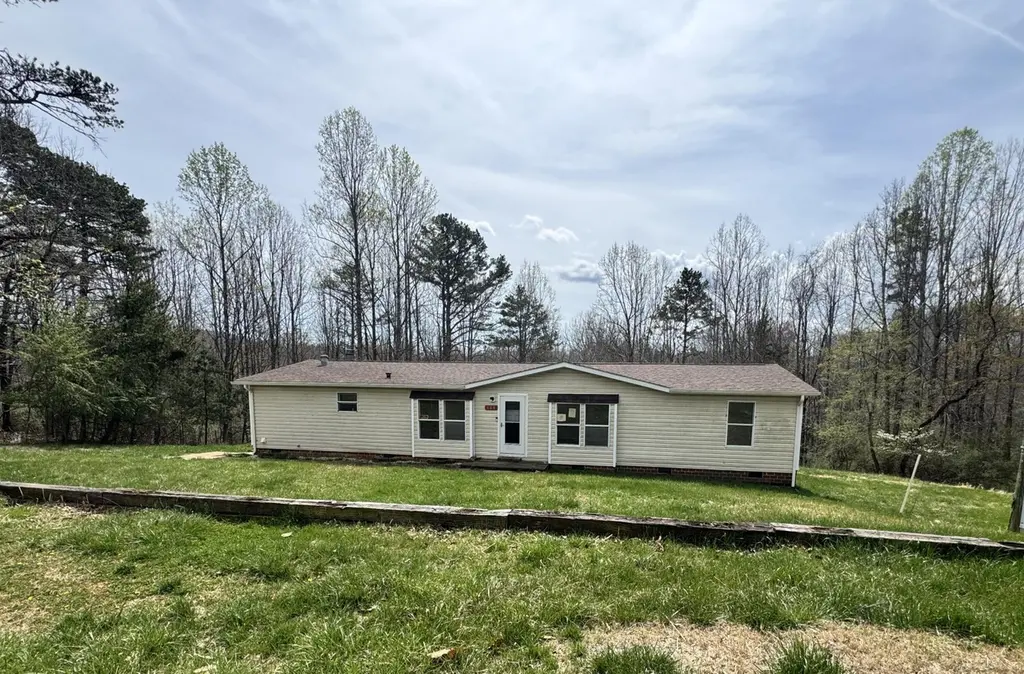
108 Cherokee Ln · Montvale, VA
Flood risk 1/10 · Minimal
- FEMA flood zone
- X (unshaded)
- Chance of flooding over 30 yrs
- 0.0%
- Est. flood insurance / yr
- $507 – $1,088
Fire risk 5/10 · Moderate
- Est. fire insurance / yr
- $666 – $1,236
Heat risk 5/10 · Moderate
- Hot days now (above 101°F)
- 7 days/yr
- Hot days in 30 yrs
- 18 days/yr
Wind risk 2/10 · Minimal
- Chance of severe wind over 30 yrs
- 1.0%
Air-quality risk 2/10 · Minimal
- Unhealthy air days now
- 1 days/yr
- Unhealthy air days in 30 yrs
- 1 days/yr
Risk factors via First Street. Map © Google.
Why this score? — see what drove the A grade
The composite is a weighted blend of 9 inputs, each scored 0–100. Each bar is that input's sub-score; the figure is the points it added to the 100-point composite (weight × sub-score).
- Cash flow +30.0/30.0
- ARV discount +15.0/15.0
- 1% rule +10.0/10.0
- DSCR +10.0/10.0
- Appreciation +10.0/10.0
- Schools +5.5/10.0
- Livability +3.5/5.0
- Rent growth +2.5/5.0
- Condition / age +2.5/5.0
$142,500
🖨 Deal sheet (PDF) 📄 Offer letter ✓ Due diligence
Listing remarks MLS
Come enjoy the tranquil surroundings on this 1.83-acre property. The home consists of 3 bedrooms, 2 baths with large master with garden tub & shower. The rear deck overlooks the backyard and wooded lot. All information taken from county sources and deemed correct but should be verified by the buyer or buyer's agent.
Key facts
- Wooded lot
- Rear deck
- 1.83 acre lot
Tags
Neighborhood map
What this means for you Summary
Snapshot
- This is a 3-bed/2.0-bath single-family listed at $142k.
Deal economics
- At list price, monthly cash flow is $3k ($32k/yr) — positive.
- The deal already cash-flows at list — no discount required.
- Meets the 1% rule at list price ($4k rent vs $142k).
- Recommended offer: $138k (3.0% below list) — sets the bar for market timing.
Location & tenants
- Location reads 70/100 on livability (#225 in VA) — a middle-class / working-renter tenant base. Strengths: cost of living A+, housing A+, health & safety A+; Watch: crime C-, employment D, amenities F.
- Bedford County Public School District (rural): math 55% / reading 73% proficiency, ranked #41 of 131 in VA (top 31%) — acceptable for families but not a draw, mixed tenant base, ~2y average lease.
- Market conditions: 19 active listings in the ZIP; 1 comparable units currently listed for rent nearby; 294 units permitted in Bedford County in 2024 (0 in 5+ unit buildings).
Forward outlook
- In year one you build about $15k of equity ($985 loan paydown + $14k appreciation (10.0% local appreciation)).
- Bedford County population projected at +8% by 2050 — modest demand growth; plan on rents tracking national, not racing it.
- At projected returns (10.0% appreciation + 3.0% rent growth), your $40k cash investment doubles in ~1 year — after that, you're playing with house money.
- By year 3, paydown + projected appreciation supports a ~$39k cash-out refi (75% LTV) — recoverable capital for the next deal without selling this one.
Negotiation context
- It's been on market 47 days — a 3% lower offer ($138k) is reasonable based on typical stale-listing flexibility.
- 3 sale attempts since 20y ago; this cycle's ask has dropped $18k (11%) from the opening price — seller is motivated, your offer sets the floor, not the list.
Risks & watch-outs
- Climate carrying-cost: moderate wildfire risk; extreme-heat days projected 7→18/yr by 2055 (HVAC capex compounding) — expect insurance premiums to compound above CPI over the hold.
Questions for the listing agent
- It's been on market 47 days. Have you received any prior offers? Is the seller open to a 3% concession, seller financing, or rate buy-down credit?
- Is there a deadline driving the sale (1031 exchange, divorce, estate, relocation)? That informs how much negotiation room exists.
- Schools are B-rated — typically a magnet for longer-tenancy family renters. What's the average tenant stay here, and is there a school-zone premium baked into asking?
- What's the average days-on-market for RENTAL listings here right now (not sales)? A rising rental-DOM trend means longer vacancies and softer asking-rent achievability than the comps imply.
- What's the recent tenant-quality profile in this submarket — average credit score on applications, eviction rate, late-payment / NSF rate, and stable-employment percentage? A property-management company in the area should have these aggregated.
- How much new for-sale + rental construction is in the pipeline within 1–3 miles? Heavy new supply typically softens prices + rents 12–24 months out; constrained supply supports both.
Investment metrics
- 1% rule
- 3.16% ✓
- Cap rate
- 29.02%
- Cash-on-cash
- 81.15%
- DSCR
- 4.61
- GRM
- 2.6
CMA / ARV
- ARV (median comp)
- $197,891
- List price
- $142,500
- Delta
- -27.99%
- Verdict
- UNDERPRICED
- Comps
- 2 within 2.0 mi
Projected returns pro-forma
10.0% appreciation · 3.0% rent growth · sell at horizon
- IRR
- 91.0%
- Equity multiple
- 7.25×
- Total profit
- $249,452
- Equity at exit
- $128,375
- IRR
- 85.8%
- Equity multiple
- 16.02×
- Total profit
- $599,428
- Equity at exit
- $276,846
Cash invested: $39,900 (down + closing). Projections, not guarantees.
Landlord ↔ Tenant lean methodology
- Overall (STATE)
- 55 Moderately Landlord-Leaning
- State Virginia
- 55 Moderately Landlord-Leaning · D+2
- County
- — inherits STATE
- City
- — inherits STATE
ZIP-level market 24174
- Home prices YoY
- 24.9%
- Active inventory
- 19
- Price-to-rent
- 2.6×
Monthly cashflow live
- Estimated rent
- $4,500 medium interval (Pro) →
- Mortgage (P&I)
- −$747
- Tax from tax record
- −$50 /mo · $601/yr
- Insurance
- −$59
- HOA
- −$0
- Vacancy / Maint / Mgmt
- −$945
- Net cashflow
- $2,698
Break-even live
Sensitivity live
| Price | -10% $2,779 | -5% $2,739 | +0% $2,698 | +5% $2,658 | +10% $2,618 |
|---|---|---|---|---|---|
| Rent | -10% $2,343 | -5% $2,521 | +0% $2,698 | +5% $2,876 | +10% $3,054 |
| Rate | -1.0pp $2,770 | -0.5pp $2,734 | base $2,698 | +0.5pp $2,661 | +1.0pp $2,624 |
UW: 25.0% down · 7.5% · 30yr · 1.5% tax · 5.0% vac · 8.0% maint · 8.0% mgmt
Financing live
Cash to close
- Down payment
- $35,625
- Closing costs
- $4,275
- Reserves months
- —
- Total cash needed
- —
Loan-product check · same deal, 3 products live
Conventional
25% down · 7.5% · 30yr
- Down + closing
- —
- Monthly P&I
- —
- Monthly cashflow
- —
- DSCR
- —
- Eligible?
- —
Personal DTI + credit; lowest rate.
DSCR
20% down · 8.5% · 30yr
- Down + closing
- —
- Monthly P&I
- —
- Monthly cashflow
- —
- DSCR
- —
- Eligible?
- —
No personal income docs; deal must DSCR.
Hard money
10% down · 12.0% · 12mo
- Down + closing
- —
- Monthly P&I
- —
- Monthly cashflow
- —
- DSCR
- —
- Eligible?
- —
Short-term bridge; refi at stabilization.
Rent comps 1 comps
| Address | Beds | Baths | Sqft | Rent | $/sqft | DOM | Units | Dist |
|---|---|---|---|---|---|---|---|---|
| 5870 Quarterwood Rd Thaxton, VA | 3.0 | 2.0 | 1900 | $4,500 | $2.37 | 22d | 1 | 1.20mi |
Listing history 13 events
-
2026-06-03statusdays on market $142,500 Pending 47 DOM
-
2026-06-02days on market $142,500 Active 46 DOM
-
2026-06-01days on market $142,500 Active 45 DOM
-
2026-05-31days on market $142,500 Active 44 DOM
-
2026-05-30days on market $142,500 Active 43 DOM
-
2026-05-19price $142,500 323-char remark
Show marketing remark (323 chars)
Come enjoy the tranquil surroundings on this 1.83-acre property. The home consists of 3 bedrooms, 2 baths with large master with garden tub & shower. The rear deck overlooks the backyard and wooded lot. All information taken from county sources and deemed correct but should be verified by the buyer or buyer's agent.
-
2026-04-16$160,000 Active 323-char remark
Show marketing remark (323 chars)
Come enjoy the tranquil surroundings on this 1.83-acre property. The home consists of 3 bedrooms, 2 baths with large master with garden tub & shower. The rear deck overlooks the backyard and wooded lot. All information taken from county sources and deemed correct but should be verified by the buyer or buyer's agent.
-
2022-06-02soldstatus $147,000
-
2022-06-01soldstatus $147,000 Closed 193-char remark
Show marketing remark (193 chars)
Welcome home! Over 1.8 acres surround this home with a newly installed roof, gutters, exterior doors, hot water heater and water tank. Come make it your own and enjoy the tranquil surroundings!
-
2022-04-11historical 193-char remark
Show marketing remark (193 chars)
Welcome home! Over 1.8 acres surround this home with a newly installed roof, gutters, exterior doors, hot water heater and water tank. Come make it your own and enjoy the tranquil surroundings!
-
2022-02-11$129,900 193-char remark
Show marketing remark (193 chars)
Welcome home! Over 1.8 acres surround this home with a newly installed roof, gutters, exterior doors, hot water heater and water tank. Come make it your own and enjoy the tranquil surroundings!
-
2007-06-22soldstatus $109,900
-
2006-12-28$114,900
ⓘ Source: listings_history table (triggers on properties + properties_extension) + one-shot
backfill from property_details.listing_events for pre-trigger history.
Tax reassessment forecast VA · Resets to sale price
- Current annual tax
- $601 · $50/mo
- Projected year-2 tax
- $1,168 · $97/mo
- Expected delta
- +$567/yr (+$47/mo · 94.4%)
ⓘ Screening estimate from a state-policy table — verify with the county assessor before closing.
Climate risk First Street
- Flood 1/10 Low FEMA zone X (unshaded) · 0% chance over 30 yrs
- Wildfire 5/10 Major
- Heat 5/10 Major 7 d/yr ≥101°F today · 18 d/yr by 30 yrs out
- Wind 2/10 Low 100% chance of damaging wind over 30 yrs
- Air quality 2/10 Low 1 unhealthy d/yr today · 1 by 30 yrs out
Nearby sold comps map
Loading sold comps map…
Walkable amenities ~0.75 mi
Loading nearby amenities…
Taxation est. · year 1
- Rental income
- $54,000
- − Mortgage interest
- −$7,982
- − Property taxes
- −$601
- − Insurance
- −$712
- − Repairs & maintenance
- −$4,320
- − Management
- −$4,320
- − Depreciation
- −$4,145
- Taxable income
- $31,919
- Est. tax owed @ 24.0%
- −$7,661
- After-tax cash flow
- $24,719/yr
For passive investors: Depreciation is non-cash, so a rental often shows a tax loss while cash-flowing — sheltering income. Rental losses are passive: they offset passive income freely, and up to $25,000/yr can offset ordinary (W-2) income if you actively participate and your MAGI is under $100k (phasing out to $0 by $150k); unused losses carry forward. On sale, claimed depreciation is recaptured at up to 25%, and gains may owe capital-gains tax (a 1031 exchange can defer both). Figures are a year-1 estimate at your 24.0% rate — not tax advice; consult a CPA.
Schools (NCES district)
- District
- Bedford County Public School District
- NCES district ID
- 5100360
- Math proficiency
- 55% ▼ -29.00%
- Reading proficiency
- 73% ▼ -7.00%
- Median HH income
- $56,288
- Composite
- 54.92/100
- National rank
- #1310
- State rank
- #41 of 131 in VA
Livability — Montvale
- Score
- 70/100
- State rank
- #225
- US rank
- #7450
Category grades
Schools grade is shown separately in the Schools card above.
Census & demographics
- Population (ZIP)
- 2,335
Population outlook (Bedford County) Hauer SSP2
- Today (2025)
- 83,194 people
- By 2030
- 85,499 · +2.8%
- By 2040
- 88,834 · +6.8%
- By 2050
- 90,060 · +8.3%
- By 2075
- 94,131 · +13.1%
- By 2100
- 89,832 · +8.0%
Race, ethnicity, and origin ACS 2023
- Neighborhood character
- Predominantly White (93%)
- Race & ethnicity
- White 93% Asian 4% Two or more races 3%
- Common ancestry
- Italian 3% German 2% Romanian 1%
- Foreign-born
- 4% · Vietnam, Canada
- Languages at home
- 94% English-only · Vietnamese 2% Russian/Polish/Slavic 2% Spanish 2%
Political lean MEDSL · Bedford
- 2024 margin
- Solid R (+50.4) · D 24.4% · R 74.8%
- 2008→2024 swing
- -13.0pp toward R · 2008: -37.4pp · 2024: -50.4pp
- All cycles
- 2024: R+50.4 2020: R+48.1 2016: R+49.4 2012: R+45.0 2008: R+37.4
Not yet ingested
- Civics
- —
Market trends
- HPI YoY
- ▲ 61.56%
- Current HPI
- 308.8944
- Rent YoY
- —
- Metro
- —
- State GDP YoY
- ▲ 2.40%
- F500 in state
- 50
Industry mix (Fortune 500 HQ in VA)
| Industry | F500 HQs | Revenue |
|---|---|---|
| Aerospace / Defense | 4 | $236B |
|
||
| Technology / Defense | 3 | $32B |
|
||
| Financial Services | 2 | $176B |
|
||
| Utilities | 2 | $27B |
|
||
| Insurance | 2 | $25B |
|
||
| Technology | 2 | $15B |
|
||
Price history
+24.0% since first listed8 events — show timeline
- 2026-05-19 Price Changed $142,500 MLSRV
- 2026-04-16 Listed $160,000 MLSRV
- 2022-06-02 Sold (Public Records) $147,000 Public Records
- 2022-06-01 Sold (MLS) $147,000 MLSRV
- 2022-04-11 Listing Removed — MLSRV
- 2022-02-11 Listed $129,900 MLSRV
- 2007-06-22 Sold (MLS) $109,900 MLSRV
- 2006-12-28 Listed $114,900 MLSRV
Property tax history
+1.0%/yrLatest (2025): $601 · +0.0% YoY. Source: county tax records.
Cash-flow waterfall
monthlySold comps — $/sqft
last 12 mo · ≤1 miLoading sold comps…