 Duplex
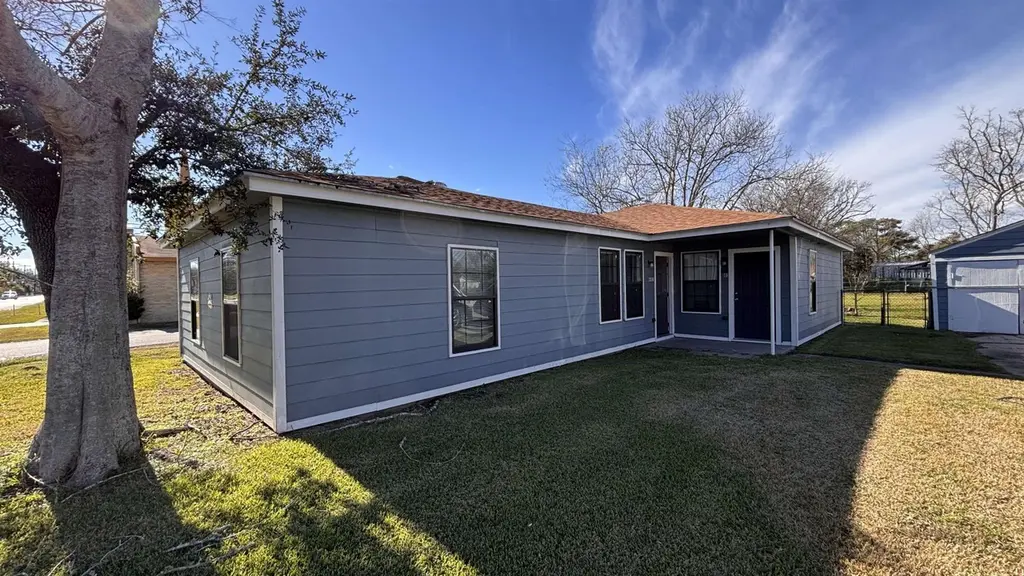
4433 & 4435 Neches Ave · Port Arthur, TX
Flood risk No data
- FEMA flood zone
- —
- Chance of flooding over 30 yrs
- —
- Est. flood insurance / yr
- —
Fire risk No data
- Est. fire insurance / yr
- —
Heat risk No data
- Hot days now (above threshold)
- —
- Hot days in 30 yrs
- —
Wind risk No data
- Chance of severe wind over 30 yrs
- —
Air-quality risk No data
- Unhealthy air days now
- —
- Unhealthy air days in 30 yrs
- —
Risk factors via First Street. Map © Google.
Why this score? — see what drove the C+ grade
The composite is a weighted blend of 9 inputs, each scored 0–100. Each bar is that input's sub-score; the figure is the points it added to the 100-point composite (weight × sub-score).
- Cash flow +25.3/30.0
- DSCR +8.3/10.0
- ARV discount +7.5/15.0
- 1% rule +6.6/10.0
- Rent growth +5.0/5.0
- Condition / age +3.8/5.0
- Livability +3.1/5.0
- Schools +1.5/10.0
- Appreciation +0.0/10.0
$275,000
🖨 Deal sheet 📄 Offer letter ✓ Due diligence
Multi-family units
County records classify this as Multi-Family (2-4 Unit). Listing-text estimate: 2 units. confirmed
Listing remarks MLS
Expand your investment portfolio with these 2 properties This listing features 2 duplex's. 4 Units, each 2bed1bath units updated with new paint, vinyl flooring, cabinets, roofs are 3 years old, each unit-709sq ft. All Units are vacant. The one unit is on the corner of Neches Ave. and the other on the corner of Trinity Ave. Don’t miss the chance to own this rare gem!
Key facts
- Garage
- Listed 322 days
Neighborhood map
What this means for you Summary
Snapshot
- This is a 2 × 4-bed/?-bath units multifamily listed at $275k. Condition is rated good.
Deal economics
- At list price, monthly cash flow is $621 ($7k/yr) — positive. Per door: $311/mo.
- The deal already cash-flows at list — no discount required.
- Meets the 1% rule at list price ($3k rent vs $275k).
- Recommended offer: $242k (12.0% below list) — sets the bar for market timing.
- Cap rate 9.0% vs local median 5.0% in Port Arthur — top-decile yield for the area; either an underpriced asset or a hidden risk that comps aren't pricing in. Stress-test before assuming the spread holds.
Location & tenants
- Location reads 61/100 on livability (#1,014 in TX) — a middle-class / working-renter tenant base. Strengths: cost of living A+, housing A+; Watch: schools D-, crime F, amenities F.
- Port Arthur ISD (urban): math 15% / reading 22% proficiency, ranked #796 of 826 in TX (top 96%) — low school quality limits family demand, transient renter base, plan for 1-2y turnover; 80% free/reduced lunch — lower-income household profile, screen leases tightly.
- Market conditions: Rents rising fast (+14.4%/yr); 115 active listings in the ZIP; lower-income renter base — watch delinquency; 343 units permitted in Jefferson County in 2024 (0 in 5+ unit buildings).
- At $3,192/mo this rent would consume 89% of the median local household income ($43k/yr) (locally 1775% of renters already pay >50% of income on rent) — very limited rent-growth headroom before tenants either downsize or default.
Forward outlook
- Local home prices are declining (-3.0%/yr); year-one equity from $2k of loan paydown is wiped out by about $8k of value loss. Plan a longer hold.
- At projected returns (-3.0% appreciation + 8.0% rent growth), your $77k cash investment doubles in ~8 years — after that, you're playing with house money.
Negotiation context
- It's been on market 322 days — a 12% lower offer ($242k) is reasonable based on typical stale-listing flexibility.
- 2 sale attempts with the ask held roughly flat each time — persistent listings suggest the price (not the market) is what's stuck; bring a comps-based counter.
Questions for the listing agent
- It's been on market 322 days. Have you received any prior offers? Is the seller open to a 12% concession, seller financing, or rate buy-down credit?
- Can we see the unit-by-unit rent roll, current vacancy, and any below-market leases? What's the average tenancy length?
- What capital expenditures (roof, boiler, parking lot, exteriors) have been made in the last 5 years, and what's planned in the next 2?
- Why hasn't it sold? Are there any deal-killer items the seller is aware of (foundation, flood, title, zoning, code violations)?
- Is there a deadline driving the sale (1031 exchange, divorce, estate, relocation)? That informs how much negotiation room exists.
- Schools are D-rated, which usually means shorter tenancies and higher turnover. Who's the typical renter profile here, and what's been the actual vacancy rate?
- Crime grade is F in this area — have there been break-ins, vandalism, or insurance claims at this property in the last 3 years? What carrier currently insures it and at what premium?
- What's the average days-on-market for RENTAL listings here right now (not sales)? A rising rental-DOM trend means longer vacancies and softer asking-rent achievability than the comps imply.
- What's the recent tenant-quality profile in this submarket — average credit score on applications, eviction rate, late-payment / NSF rate, and stable-employment percentage? A property-management company in the area should have these aggregated.
- How much new apartment / multifamily construction is in the pipeline within 1–3 miles? Heavy new supply (>2% of stock underway) typically softens rents 12–24 months out; light construction supports rent growth.
Investment metrics
- 1% rule
- 1.16% ✓
- Cap rate
- 9.00%
- Cash-on-cash
- 9.68%
- DSCR
- 1.43
- GRM
- 7.2
CMA / ARV
No comps found within radius.
Projected returns pro-forma
-3.0% appreciation · 8.0% rent growth · sell at horizon
- IRR
- 3.8%
- Equity multiple
- 1.15×
- Total profit
- $11,921
- Equity at exit
- $41,003
- IRR
- 17.6%
- Equity multiple
- 2.80×
- Total profit
- $138,301
- Equity at exit
- $23,777
Cash invested: $77,000 (down + closing). Projections, not guarantees.
Landlord ↔ Tenant lean methodology
- Overall (STATE)
- 87 Strongly Landlord-Friendly
- State Texas
- 87 Strongly Landlord-Friendly · R+5
- County
- — inherits STATE
- City
- — inherits STATE
ZIP-level market 77642
- Rents YoY
- 14.4%
- Active inventory
- 115
- Price-to-rent
- 14.4×
Monthly cashflow live
- Estimated rent
- $3,192 medium interval (Pro) →
- Mortgage (P&I)
- −$1,442
- Tax est. 1.5%
- −$344 /mo · $4,125/yr
- Insurance
- −$115
- HOA
- −$0
- Vacancy / Maint / Mgmt
- −$670
- Net cashflow
- $621
Break-even live
2-unit breakdown (identical units grouped — click to expand)
| Units | Beds | Baths | Est. rent |
|---|---|---|---|
| 2× units | 4 | — | $3,192 |
| #1 | 4 | — | $1,596 |
| #2 | 4 | — | $1,596 |
| Total (2 units) | $3,192 | ||
UW: 25.0% down · 7.5% · 30yr · 1.5% tax · 5.0% vac · 8.0% maint · 8.0% mgmt
Financing live
Cash to close
- Down payment
- $68,750
- Closing costs
- $8,250
- Reserves months
- —
- Total cash needed
- —
Loan-product check · same deal, 3 products live
Conventional
25% down · 7.5% · 30yr
- Down + closing
- —
- Monthly P&I
- —
- Monthly cashflow
- —
- DSCR
- —
- Eligible?
- —
Personal DTI + credit; lowest rate.
DSCR
20% down · 8.5% · 30yr
- Down + closing
- —
- Monthly P&I
- —
- Monthly cashflow
- —
- DSCR
- —
- Eligible?
- —
No personal income docs; deal must DSCR.
Hard money
10% down · 12.0% · 12mo
- Down + closing
- —
- Monthly P&I
- —
- Monthly cashflow
- —
- DSCR
- —
- Eligible?
- —
Short-term bridge; refi at stabilization.
Listing history 18 events
-
2026-06-18days on market $275,000 Active 322 DOM
-
2026-06-17days on market $275,000 Active 321 DOM
-
2026-06-16days on market $275,000 Active 320 DOM
-
2026-06-15days on market $275,000 Active 319 DOM
-
2026-06-14days on market $275,000 Active 317 DOM
-
2026-06-13days on market $275,000 Active 316 DOM
-
2026-06-10days on market $275,000 Active 314 DOM
-
2026-06-09days on market $275,000 Active 313 DOM
-
2026-06-08days on market $275,000 Active 312 DOM
-
2026-06-07days on market $275,000 Active 311 DOM
-
2026-06-03days on market $275,000 Active 307 DOM
-
2026-06-02days on market $275,000 Active 306 DOM
-
2026-06-01days on market $275,000 Active 305 DOM
-
2026-05-31days on market $275,000 Active 304 DOM
-
2026-05-30days on market $275,000 Active 303 DOM
-
2025-07-31$275,000 Active 374-char remark
Show marketing remark (374 chars)
Expand your investment portfolio with these 2 properties This listing features 2 duplex's. 4 Units, each 2bed1bath units updated with new paint, vinyl flooring, cabinets, roofs are 3 years old, each unit-709sq ft. All Units are vacant. The one unit is on the corner of Neches Ave. and the other on the corner of Trinity Ave. Don’t miss the chance to own this rare gem!
-
2025-05-08price $275,000
-
2025-01-17$330,000 Active
ⓘ Source: listings_history table (triggers on properties + properties_extension) + one-shot
backfill from property_details.listing_events for pre-trigger history.
Nearby sold comps map
Loading sold comps map…
Walkable amenities ~0.75 mi
Loading nearby amenities…
Taxation est. · year 1
- Rental income
- $38,304
- − Mortgage interest
- −$15,404
- − Property taxes
- −$4,125
- − Insurance
- −$1,375
- − Repairs & maintenance
- −$3,064
- − Management
- −$3,064
- − Depreciation
- −$8,000
- Taxable income
- $3,271
- Est. tax owed @ 24.0%
- −$785
- After-tax cash flow
- $6,670/yr
For passive investors: Depreciation is non-cash, so a rental often shows a tax loss while cash-flowing — sheltering income. Rental losses are passive: they offset passive income freely, and up to $25,000/yr can offset ordinary (W-2) income if you actively participate and your MAGI is under $100k (phasing out to $0 by $150k); unused losses carry forward. On sale, claimed depreciation is recaptured at up to 25%, and gains may owe capital-gains tax (a 1031 exchange can defer both). Figures are a year-1 estimate at your 24.0% rate — not tax advice; consult a CPA.
Condition & rehab AI · 8 photos
This 2-unit property is in good condition with updated interiors and a well-maintained exterior. Minor touch-ups and landscaping improvements would further enhance its value.
Value-add opportunities
- Both Paint touch-ups — Enhances curb appeal and interior aesthetics
- Both Landscaping improvements — Enhances curb appeal and property value
- Both New flooring in bathrooms — Improves functionality and aesthetics
- Both New countertops in kitchen — Enhances functionality and aesthetics
- Both New lighting fixtures — Enhances functionality and aesthetics
Renovation cost estimate screening
Value-add ROI direction
- Both Paint touch-ups — Enhances curb appeal and interior aesthetics ↑
- Both Landscaping improvements — Enhances curb appeal and property value ↑
- Both New flooring in bathrooms — Improves functionality and aesthetics ↑
- Both New countertops in kitchen — Enhances functionality and aesthetics ↑
- Both New lighting fixtures — Enhances functionality and aesthetics ↑
ⓘ Cost ranges are severity-bucket heuristics (US national rule-of-thumb). Get contractor quotes + a written scope before underwriting a rehab budget.
Schools (NCES district)
- District
- Port Arthur ISD
- NCES district ID
- 4835400
- Math proficiency
- 15% ▼ -22.00%
- Reading proficiency
- 22% ▼ -10.00%
- Median HH income
- $31,795
- Composite
- 14.9/100
- National rank
- #9373
- State rank
- #796 of 826 in TX
Livability — Port Arthur
- Score
- 61/100
- State rank
- #1014
- US rank
- #18061
Category grades
Schools grade is shown separately in the Schools card above.
Census & demographics
- Census place
- Port Arthur, TX
- County
- Jefferson County · 203,592 people
- City population
- 38,358
- Metro
- Beaumont-Port Arthur, TX
- Population (ZIP)
- 38,358
- Household income
- $42,950
- Rent vs Own
- Severe rent burden
- 1775.0
Population outlook (Jefferson County) Hauer SSP2
- Today (2025)
- 259,015 people
- By 2030
- 260,685 · +0.6%
- By 2040
- 263,309 · +1.7%
- By 2050
- 265,237 · +2.4%
- By 2075
- 270,193 · +4.3%
- By 2100
- 255,628 · -1.3%
Race, ethnicity, and origin ACS 2023
- Neighborhood character
- Diverse neighborhood (Simpson 0.66)
- Race & ethnicity
- Hispanic / Latino 42% Black 37% Two or more races 18% White 12% Asian 7% Native American 1%
- Hispanic origin (detail)
- Mexican 35% Cuban 1%
- Common ancestry
- Lithuanian 2% European 1%
- Foreign-born
- 25% · Canada, Vietnam
- Languages at home
- 56% English-only · Spanish 37% Vietnamese 4% Other Indo-European 1%
Political lean MEDSL · Jefferson
- 2024 margin
- Lean R (+8.9) · D 45.1% · R 54.0%
- 2008→2024 swing
- -11.1pp toward R · 2008: 2.2pp · 2024: -8.9pp
- All cycles
- 2024: R+8.9 2020: R+1.6 2016: R+0.5 2012: D+1.6 2008: D+2.2
Not yet ingested
- Civics
- —
Market trends
- HPI YoY
- ▼ -86.58%
- Current HPI
- 152.1615
- Rent YoY
- ▲ 14.42%
- Metro
- Beaumont-Port Arthur, TX
- State GDP YoY
- ▲ 3.95%
- F500 in state
- 110
Industry mix (Fortune 500 HQ in TX)
| Industry | F500 HQs | Revenue |
|---|---|---|
| Energy | 16 | $1,198B |
|
||
| Technology | 5 | $198B |
|
||
| Engineering / Construction | 4 | $72B |
|
||
| Energy Services | 3 | $60B |
|
||
| Utilities | 3 | $41B |
|
||
| Healthcare | 2 | $330B |
|
||
Price history
-16.7% since first listed3 events — show timeline
- 2025-07-31 Listed $275,000 BBOR
- 2025-05-08 Price Changed $275,000 BBOR
- 2025-01-17 Listed $330,000 BBOR
Cash-flow waterfall
monthlySold comps — $/sqft
last 12 mo · ≤1 miLoading sold comps…