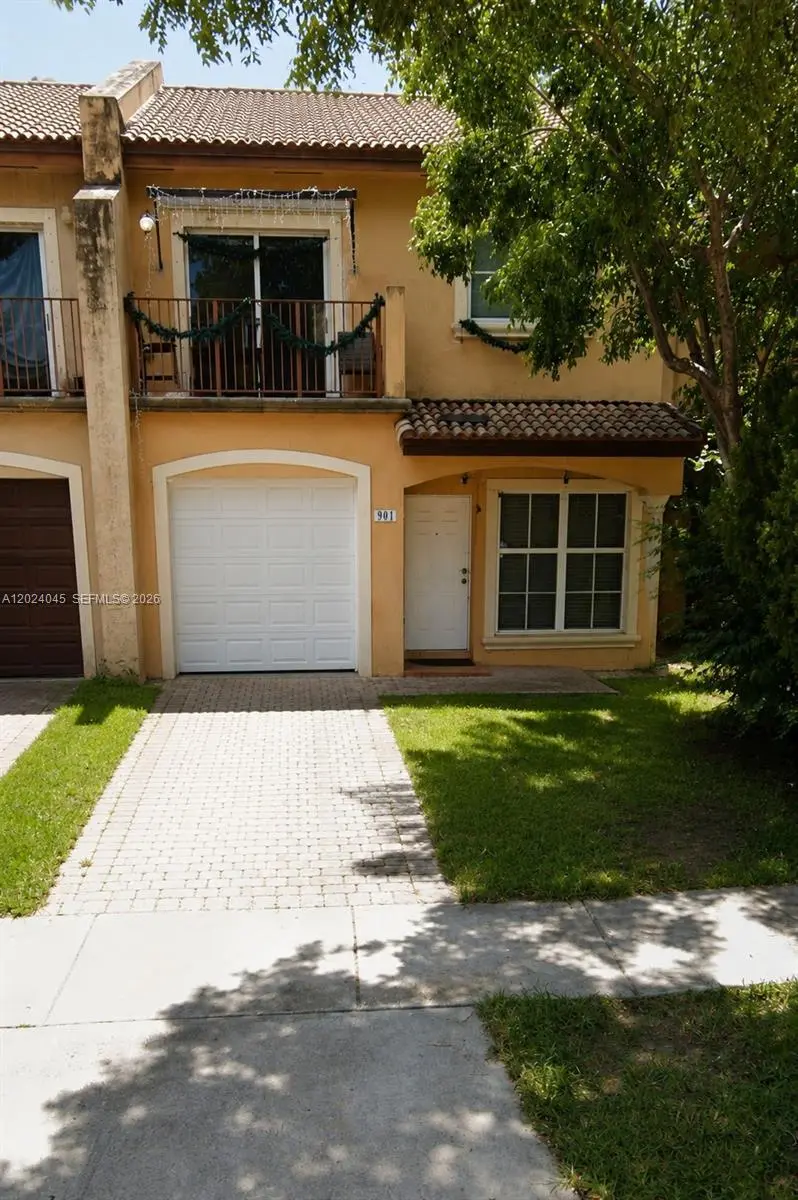
901 SW 6th Ct · Florida City, FL
Flood risk 4/10 · Minor
- FEMA flood zone
- X (unshaded)
- Chance of flooding over 30 yrs
- 0.23%
- Est. flood insurance / yr
- $507 – $1,088
Fire risk 3/10 · Minor
- Est. fire insurance / yr
- $947 – $1,759
Heat risk 10/10 · Severe
- Hot days now (above 108°F)
- 7 days/yr
- Hot days in 30 yrs
- 32 days/yr
Wind risk 10/10 · Severe
- Chance of severe wind over 30 yrs
- 99.0%
Air-quality risk 2/10 · Minimal
- Unhealthy air days now
- 1 days/yr
- Unhealthy air days in 30 yrs
- 1 days/yr
Risk factors via First Street. Map © Google.
Why this score? — see what drove the D grade
The composite is a weighted blend of 9 inputs, each scored 0–100. Each bar is that input's sub-score; the figure is the points it added to the 100-point composite (weight × sub-score).
- Cash flow +13.2/30.0
- ARV discount +10.9/15.0
- Schools +4.2/10.0
- DSCR +4.0/10.0
- 1% rule +3.7/10.0
- Livability +3.2/5.0
- Condition / age +2.5/5.0
- Rent growth +1.8/5.0
- Appreciation +0.0/10.0
$309,999
🖨 Deal sheet (PDF) 📄 Offer letter ✓ Due diligence
Listing remarks
Spacious townhouse located in the desirable Keys Winds community. Property offers a functional layout with spacious living areas, tile flooring, ample natural light, and great potential for customization or investment. Property needs TLC and is priced accordingly. Seller is highly motivated and ready to review all reasonable offers. Excellent opportunity for first-time buyers, investors, or anyone looking to add their personal touch. Conveniently located near major highways, schools, shopping centers, restaurants, and the Florida Keys. No HOA. Property is currently tenant occupied. Please do not disturb tenant under any circumstances. Showings by appointment only with proper notice. Propert
Key facts
- Natural light
- Tile flooring
- No hoa
Tags
Property features AI
Finance
- Financial info: Pets allowed with no restrictions
Exterior
- Parking: One parking space
- Home design: 2 stories; Entry level 1; Entry located on level 1
- Construction: Block construction; Resale property
- Exterior features: Has property attached
Interior
- Flooring: Tile
- Bathrooms: 2 full bathrooms; 1 half bathroom
- Heating & cooling: Central heating; Central air conditioning
- Interior features: First floor entry; Other interior features
- Laundry & utility: Washer hookup; Dryer hookup
Neighborhood map
What this means for you Summary
Snapshot
- This is a 4-bed/2.0-bath townhouse listed at $310k.
Deal economics
- At list price, monthly cash flow is $-7 ($-80/yr) — negative.
- To cash-flow at today's rent, offer at most $309k (0.4% below list).
- To meet the 1% rule (rent ≥ 1% of price), the offer needs to be $268k (13.4% below list).
- Recommended offer: $268k (13.4% below list) — sets the bar for 1% rule.
- Cap rate 6.3% vs local median 4.2% in Florida City — top-decile yield for the area; either an underpriced asset or a hidden risk that comps aren't pricing in. Stress-test before assuming the spread holds.
Location & tenants
- Location reads 65/100 on livability (#654 in FL) — a middle-class / working-renter tenant base. Strengths: commute A+, cost of living A+, housing A+; Watch: crime F, amenities F, employment F.
- Miami-Dade (suburban): math 45% / reading 54% proficiency, ranked #40 of 73 in FL (top 55%) — families likely to look elsewhere, expect single-tenant / working-renter base with shorter leases; 64% free/reduced lunch — lower-income household profile, screen leases tightly.
- Zoned schools: Florida City Elementary School (math 23% / reading 34%, grade F, #1,943 of 2,144 statewide, top 91%, 608 students, 82% FRL); Homestead Middle School (math 23% / reading 25%, grade F, #532 of 571 statewide, top 94%, 666 students, 81% FRL); Homestead Senior High School (math 24% / reading 23%, grade F, #533 of 667 statewide, top 80%, 2,020 students, 74% FRL).
- Zoned-school proficiency averages 25% at this address vs 50% district-wide (-24 pts) — the specific schools serving this property underperform the Miami-Dade average; the district grade overstates school quality for this exact location.
- Market conditions: Rents soft (-2.9%/yr); 617 active listings in the ZIP; 40 comparable units currently listed for rent nearby; rentals at typical pace (median 24d on market — plan ~3-4 weeks tenant-placement turnaround); 10,051 units permitted in Miami-Dade County in 2024 (7,758 in 5+ unit buildings).
- At $2,684/mo this rent would consume 68% of the median local household income ($47k/yr) (locally 1516% of renters already pay >50% of income on rent) — very limited rent-growth headroom before tenants either downsize or default.
Forward outlook
- Local home prices are declining (-3.0%/yr); year-one equity from $2k of loan paydown is wiped out by about $9k of value loss. Plan a longer hold.
- Miami-Dade County population projected at +28% by 2050 — long-run rental-demand tailwind backs the buy-and-hold thesis.
Negotiation context
- It's been on market 30 days — a 2% lower offer ($305k) is reasonable based on typical stale-listing flexibility.
- 2 sale attempts since 14y ago with the ask held roughly flat each time — persistent listings suggest the price (not the market) is what's stuck; bring a comps-based counter.
- Current owner paid $150k; list at $310k implies a 107% gain — meaningful room to come down on a strong offer.
Risks & watch-outs
- Climate carrying-cost: severe wind risk, 99% chance of damaging wind over 30y; extreme-heat days projected 7→32/yr by 2055 (HVAC capex compounding) — expect insurance premiums to compound above CPI over the hold.
Questions for the listing agent
- What do current leases actually rent for vs. the listed asking? Can we see a recent rent roll and the last 12 months of T-12 income?
- Is there a deadline driving the sale (1031 exchange, divorce, estate, relocation)? That informs how much negotiation room exists.
- Schools are F-rated, which usually means shorter tenancies and higher turnover. Who's the typical renter profile here, and what's been the actual vacancy rate?
- Crime grade is F in this area — have there been break-ins, vandalism, or insurance claims at this property in the last 3 years? What carrier currently insures it and at what premium?
- The area grade is low — what's the realistic commute time and amenity access for the typical tenant pool here? Any planned neighborhood developments (good or bad) we should know about?
- What's the average days-on-market for RENTAL listings here right now (not sales)? A rising rental-DOM trend means longer vacancies and softer asking-rent achievability than the comps imply.
- What's the recent tenant-quality profile in this submarket — average credit score on applications, eviction rate, late-payment / NSF rate, and stable-employment percentage? A property-management company in the area should have these aggregated.
- How much new for-sale + rental construction is in the pipeline within 1–3 miles? Heavy new supply typically softens prices + rents 12–24 months out; constrained supply supports both.
Investment metrics
- 1% rule
- 0.87% ✗
- Cap rate
- 6.27%
- Cash-on-cash
- -0.09%
- DSCR
- 1.00
- GRM
- 9.6
CMA / ARV
- ARV (on-the-fly)
- $335,356
- Comps found
- 4
Show comp detail 4 sales within ~0.75 mi
| Address | Dist | Beds/Ba | Sqft | Sold | Price | $/sf | Match |
|---|---|---|---|---|---|---|---|
| 870 SW 6th Ct | 0.03mi | 4/2.5 | 1,527 (-11%) | 4mo | $295,000 | $193 | 76 |
| 626 SW 11th St | 0.11mi | 4/2.5 | 1,711 (0%) | 23mo | $335,000 | $196 | 74 |
| 646 SW 11th St | 0.11mi | 3/2.5 (-1) | 1,799 (+5%) | 21mo | $335,000 | $186 | 61 |
| 890 SW 11th Ter | 0.35mi | 3/2.5 (-1) | 1,476 (-14%) | 6mo | $394,490 | $267 | 48 |
Match score weights: distance 35% · size 25% · config 20% · recency 20%. Top-matched comps best support the ARV.
Projected returns pro-forma
-3.0% appreciation · 0.0% rent growth · sell at horizon
- IRR
- -19.8%
- Equity multiple
- 0.33×
- Total profit
- $-58,491
- Equity at exit
- $46,222
- IRR
- -20.9%
- Equity multiple
- 0.06×
- Total profit
- $-81,752
- Equity at exit
- $26,803
Cash invested: $86,800 (down + closing). Projections, not guarantees.
Landlord ↔ Tenant lean methodology
- Overall (STATE)
- 87 Strongly Landlord-Friendly
- State Florida
- 87 Strongly Landlord-Friendly · R+3
- County
- — inherits STATE
- City
- — inherits STATE
ZIP-level market 33034
- Home prices YoY
- -5.9%
- Rents YoY
- -2.9%
- Active inventory
- 617
- Price-to-rent
- 9.6×
Monthly cashflow live
- Estimated rent
- $2,684 high interval (Pro) →
- Mortgage (P&I)
- −$1,626
- Tax from tax record
- −$372 /mo · $4,469/yr
- Insurance
- −$129
- HOA
- −$0
- Vacancy / Maint / Mgmt
- −$564
- Net cashflow
- $-7
Break-even live
Sensitivity live
| Price | -10% $169 | -5% $81 | +0% $-7 | +5% $-94 | +10% $-182 |
|---|---|---|---|---|---|
| Rent | -10% $-219 | -5% $-113 | +0% $-7 | +5% $99 | +10% $205 |
| Rate | -1.0pp $149 | -0.5pp $72 | base $-7 | +0.5pp $-87 | +1.0pp $-169 |
UW: 25.0% down · 7.5% · 30yr · 1.5% tax · 5.0% vac · 8.0% maint · 8.0% mgmt
Financing live
Cash to close
- Down payment
- $77,500
- Closing costs
- $9,300
- Reserves months
- —
- Total cash needed
- —
Loan-product check · same deal, 3 products live
Conventional
25% down · 7.5% · 30yr
- Down + closing
- —
- Monthly P&I
- —
- Monthly cashflow
- —
- DSCR
- —
- Eligible?
- —
Personal DTI + credit; lowest rate.
DSCR
20% down · 8.5% · 30yr
- Down + closing
- —
- Monthly P&I
- —
- Monthly cashflow
- —
- DSCR
- —
- Eligible?
- —
No personal income docs; deal must DSCR.
Hard money
10% down · 12.0% · 12mo
- Down + closing
- —
- Monthly P&I
- —
- Monthly cashflow
- —
- DSCR
- —
- Eligible?
- —
Short-term bridge; refi at stabilization.
Rent comps 40 comps
| Address | Beds | Baths | Sqft | Rent | $/sqft | DOM | Units | Dist |
|---|---|---|---|---|---|---|---|---|
| 825 SW 6th Pl Homestead, FL | 3.0 | 2.5 | 1527 | $2,000 | $1.31 | 26d | 1 | 0.04mi |
| 875 SW 6th Pl Unit TH Homestead, FL | 3.0 | 2.5 | 1527 | $2,250 | $1.47 | 26d | 1 | 0.04mi |
| 785 SW 6th Pl Unit 1 Homestead, FL | 3.0 | 2.5 | 1600 | $2,200 | $1.38 | 18d | 1 | 0.05mi |
| 840 SW 6th Pl Homestead, FL | 4.0 | 2.5 | 1711 | $2,300 | $1.34 | 26d | 1 | 0.07mi |
| 681 SW 7th St #681 Florida City, FL | 3.0 | 2.5 | 1600 | $2,300 | $1.44 | 23d | 1 | 0.11mi |
| 687 SW 10th St Homestead, FL | 4.0 | 2.5 | 1799 | $2,200 | $1.22 | 23d | 1 | 0.13mi |
| 768 SW 9th St Homestead, FL | 3.0 | 2.0 | 1099 | $2,250 | $2.05 | 26d | 1 | 0.16mi |
| 617 SW 11th St Homestead, FL | 3.0 | 2.5 | 1466 | $2,890 | $1.97 | 26d | 1 | 0.17mi |
| 617 SW 11th St Homestead, FL | 3.0 | 2.5 | 1466 | $3,000 | $2.05 | 4d | 1 | 0.17mi |
| 721 SW 11th St Homestead, FL | 3.0 | 2.5 | 1466 | $2,400 | $1.64 | 12d | 1 | 0.20mi |
| 721 SW 11th St Homestead, FL | 3.0 | 2.5 | 1466 | $2,400 | $1.64 | 15d | 1 | 0.20mi |
| 1156 SW 6th Ct Unit 1156 Florida City, FL | 3.0 | 2.5 | 1466 | $2,450 | $1.67 | 26d | 1 | 0.21mi |
| 1116 SW 7th Ct Homestead, FL | 3.0 | 2.5 | 1466 | $2,600 | $1.77 | 26d | 1 | 0.23mi |
| 1116 SW 7th Ct Homestead, FL | 3.0 | 2.5 | 1466 | $2,400 | $1.64 | 3d | 1 | 0.23mi |
| 1161 SW 7th Ct Homestead, FL | 4.0 | 2.5 | 1530 | $3,450 | $2.25 | 26d | 1 | 0.25mi |
| 902 SW 8th Pl Homestead, FL | 3.0 | 2.5 | 1469 | $2,900 | $1.97 | 26d | 1 | 0.25mi |
| 937 SW 8th Pl Homestead, FL | 3.0 | 2.0 | 1065 | $2,100 | $1.97 | 26d | 1 | 0.25mi |
| 848 SW 10th St Homestead, FL | 3.0 | 2.0 | 1053 | $2,200 | $2.09 | 0d | 1 | 0.25mi |
| 848 SW 10th St Homestead, FL | 3.0 | 2.0 | 1053 | $2,200 | $2.09 | 4d | 1 | 0.25mi |
| 1181 SW 7th Ct Unit 1181 Florida City, FL | 3.0 | 2.5 | 1466 | $2,750 | $1.88 | 26d | 1 | 0.26mi |
| 1170 SW 7th Ct #1170 Florida City, FL | 3.0 | 2.5 | 1466 | $2,500 | $1.71 | 26d | 1 | 0.27mi |
| 822 SW 11th Ter Homestead, FL | 3.0 | 2.5 | 1426 | $3,000 | $2.10 | 23d | 1 | 0.29mi |
| 841 SW 6th St Florida City, FL | 4.0 | 2.5 | 2160 | $3,299 | $1.53 | 23d | 1 | 0.30mi |
| 834 SW 11th Ter Unit 834 Florida City, FL | 3.0 | 2.5 | 1381 | $2,600 | $1.88 | 26d | 1 | 0.30mi |
| 639 SW 3rd Ter Homestead, FL | 3.0 | 2.0 | 1175 | $2,850 | $2.43 | 23d | 1 | 0.34mi |
| 17891 SW 356th St Homestead, FL | 3.0 | 2.5 | 1414 | $2,300 | $1.63 | 5d | 1 | 0.36mi |
| 17905 SW 356th St Homestead, FL | 4.0 | 2.5 | 1600 | $2,750 | $1.72 | 19d | 1 | 0.36mi |
| 17859 SW 356th St Homestead, FL | 3.0 | 2.5 | 1300 | $2,500 | $1.92 | 0d | 1 | 0.36mi |
| 17887 SW 356th St Unit 17887 Homestead, FL | 3.0 | 3.0 | 1400 | $2,350 | $1.68 | 26d | 1 | 0.36mi |
| 582 SW 2nd Pl Homestead, FL | 3.0 | 2.0 | 1276 | $2,500 | $1.96 | 26d | 1 | 0.37mi |
| 17920 SW 358th St Unit 17920 Homestead, FL | 3.0 | 2.5 | 1504 | $2,350 | $1.56 | 5d | 1 | 0.39mi |
| 17920 SW 358th St Unit 17920 Homestead, FL | 3.0 | 2.5 | 1504 | $2,350 | $1.56 | 21d | 1 | 0.39mi |
| 17904 SW 358th St Homestead, FL | 3.0 | 2.5 | 1450 | $1,285 | $0.89 | 6d | 1 | 0.40mi |
| 17958 SW 357th St Homestead, FL | 3.0 | 3.0 | 1330 | $2,650 | $1.99 | 9d | 1 | 0.41mi |
| 17958 SW 357th St Homestead, FL | 3.0 | 3.0 | 1330 | $2,650 | $1.99 | 12d | 1 | 0.41mi |
| 17966 SW 357th St Homestead, FL | 3.0 | 3.0 | 1330 | $2,650 | $1.99 | 9d | 1 | 0.41mi |
| 17938 SW 357th St Homestead, FL | 3.0 | 2.5 | 1545 | $2,500 | $1.62 | 15d | 1 | 0.41mi |
| 17938 SW 357th St Homestead, FL | 3.0 | 2.5 | 1545 | $2,500 | $1.62 | 9d | 1 | 0.41mi |
| 17966 SW 357th St Homestead, FL | 3.0 | 3.0 | 1330 | $2,650 | $1.99 | 12d | 1 | 0.41mi |
| 17950 SW 357th St Homestead, FL | 3.0 | 2.5 | 1414 | $2,500 | $1.77 | 0d | 1 | 0.41mi |
Listing history 22 events
-
2026-06-21days on market $309,999 Active 30 DOM
-
2026-06-18days on market $309,999 Active 27 DOM
-
2026-06-17days on market $309,999 Active 26 DOM
-
2026-06-16days on market $309,999 Active 25 DOM
-
2026-06-15days on market $309,999 Active 24 DOM
-
2026-06-13days on market $309,999 Active 22 DOM
-
2026-06-09days on market $309,999 Active 18 DOM
-
2026-06-08days on market $309,999 Active 17 DOM
-
2026-06-07days on market $309,999 Active 16 DOM
-
2026-06-04days on market $309,999 Active 13 DOM
-
2026-06-03days on market $309,999 Active 12 DOM
-
2026-06-02days on market $309,999 Active 11 DOM
-
2026-06-02price $309,999 Active 10 DOM
-
2026-06-01days on market $319,999 Active 10 DOM
-
2026-05-31days on market $319,999 Active 9 DOM
-
2026-05-22$319,999 Active
-
2018-10-11soldstatus $150,000
-
2016-12-02soldstatus $135,000
-
2013-01-21soldstatus $49,361
-
2013-01-18soldstatus $49,400
-
2012-11-01$45,900
-
2005-05-13soldstatus $10,500,000
ⓘ Source: listings_history table (triggers on properties + properties_extension) + one-shot
backfill from property_details.listing_events for pre-trigger history.
Tax reassessment forecast FL · Resets to sale price
- Current annual tax
- $4,469 · $372/mo
- Projected year-2 tax
- $4,469 · $372/mo
- Expected delta
- $0/yr ($0/mo · 0.0%)
ⓘ Screening estimate from a state-policy table — verify with the county assessor before closing.
Climate risk First Street
- Flood 4/10 Moderate FEMA zone X (unshaded) · 23% chance over 30 yrs
- Wildfire 3/10 Moderate
- Heat 10/10 Extreme 7 d/yr ≥108°F today · 32 d/yr by 30 yrs out
- Wind 10/10 Extreme 99% chance of damaging wind over 30 yrs
- Air quality 2/10 Low 1 unhealthy d/yr today · 1 by 30 yrs out
Nearby sold comps map
Loading sold comps map…
Walkable amenities ~0.75 mi
Loading nearby amenities…
Taxation est. · year 1
- Rental income
- $32,212
- − Mortgage interest
- −$17,365
- − Property taxes
- −$4,469
- − Insurance
- −$1,550
- − Repairs & maintenance
- −$2,577
- − Management
- −$2,577
- − Depreciation
- −$9,018
- Taxable loss
- −$5,344
- Est. tax savings @ 24.0%
- +$1,283
- After-tax cash flow
- $1,203/yr
For passive investors: Depreciation is non-cash, so a rental often shows a tax loss while cash-flowing — sheltering income. Rental losses are passive: they offset passive income freely, and up to $25,000/yr can offset ordinary (W-2) income if you actively participate and your MAGI is under $100k (phasing out to $0 by $150k); unused losses carry forward. On sale, claimed depreciation is recaptured at up to 25%, and gains may owe capital-gains tax (a 1031 exchange can defer both). Figures are a year-1 estimate at your 24.0% rate — not tax advice; consult a CPA.
Schools (NCES district)
- District
- Miami-Dade
- NCES district ID
- 1200390
- Math proficiency
- 45% ▼ -16.00%
- Reading proficiency
- 54% ▼ -5.00%
- Median HH income
- $43,928
- Composite
- 41.76/100
- National rank
- #3397
- State rank
- #40 of 73 in FL
Livability — Florida City
- Score
- 65/100
- State rank
- #654
- US rank
- #13036
Category grades
Schools grade is shown separately in the Schools card above.
Census & demographics
- Census place
- Florida City, FL
- County
- Miami-Dade County · 2,697,751 people
- City population
- 23,823
- Metro
- Miami-Fort Lauderdale-Pompano Beach, FL
- Population (ZIP)
- 23,823
- Household income
- $47,170
- Rent vs Own
- Severe rent burden
- 1516.0
Population outlook (Miami-Dade County) Hauer SSP2
- Today (2025)
- 3,126,439 people
- By 2030
- 3,325,765 · +6.4%
- By 2040
- 3,697,561 · +18.3%
- By 2050
- 4,012,134 · +28.3%
- By 2075
- 4,605,612 · +47.3%
- By 2100
- 4,866,598 · +55.7%
Race, ethnicity, and origin ACS 2023
- Neighborhood character
- Majority Hispanic (62%)
- Race & ethnicity
- Hispanic / Latino 62% Black 28% Two or more races 24% White 8%
- Hispanic origin (detail)
- Mexican 20% Puerto Rican 5% Cuban 13% Dominican 2%
- Common ancestry
- Hispanic 4%
- Foreign-born
- 34% · Canada, Dominican Republic, Guatemala
- Languages at home
- 38% English-only · Spanish 56% French/Haitian/Cajun 5%
Political lean MEDSL · Miami-Dade
- 2024 margin
- R (+11.4) · D 43.9% · R 55.4%
- 2008→2024 swing
- -27.6pp toward R · 2008: 16.1pp · 2024: -11.4pp
- All cycles
- 2024: R+11.4 2020: D+7.3 2016: D+29.6 2012: D+23.7 2008: D+16.1
Not yet ingested
- Civics
- —
Market trends
- HPI YoY
- ▼ -32.64%
- Current HPI
- 521.6856
- Rent YoY
- ▼ -2.85%
- Metro
- Miami-Fort Lauderdale-Pompano Beach, FL
- State GDP YoY
- ▲ 3.28%
- F500 in state
- 36
Industry mix (Fortune 500 HQ in FL)
| Industry | F500 HQs | Revenue |
|---|---|---|
| Industrial Technology | 2 | $29B |
|
||
| Insurance | 2 | $17B |
|
||
| Retail | 1 | $60B |
|
||
| Technology Distribution | 1 | $58B |
|
||
| Homebuilding | 1 | $35B |
|
||
| Technology Manufacturing | 1 | $35B |
|
||
Price history
-97.0% since first listed7 events — show timeline
- 2026-05-22 Listed $319,999 MARMLS
- 2018-10-11 Sold (Public Records) $150,000 Public Records
- 2016-12-02 Sold (Public Records) $135,000 Public Records
- 2013-01-21 Sold (MLS) $49,361 MARMLS
- 2013-01-18 Sold (Public Records) $49,400 Public Records
- 2012-11-01 Listed $45,900 MARMLS
- 2005-05-13 Sold (Public Records) $10,500,000 Public Records
Property tax history
+9.0%/yrLatest (2025): $4,469 · +6.7% YoY. Source: county tax records.
Cash-flow waterfall
monthlySold comps — $/sqft
last 12 mo · ≤1 miLoading sold comps…