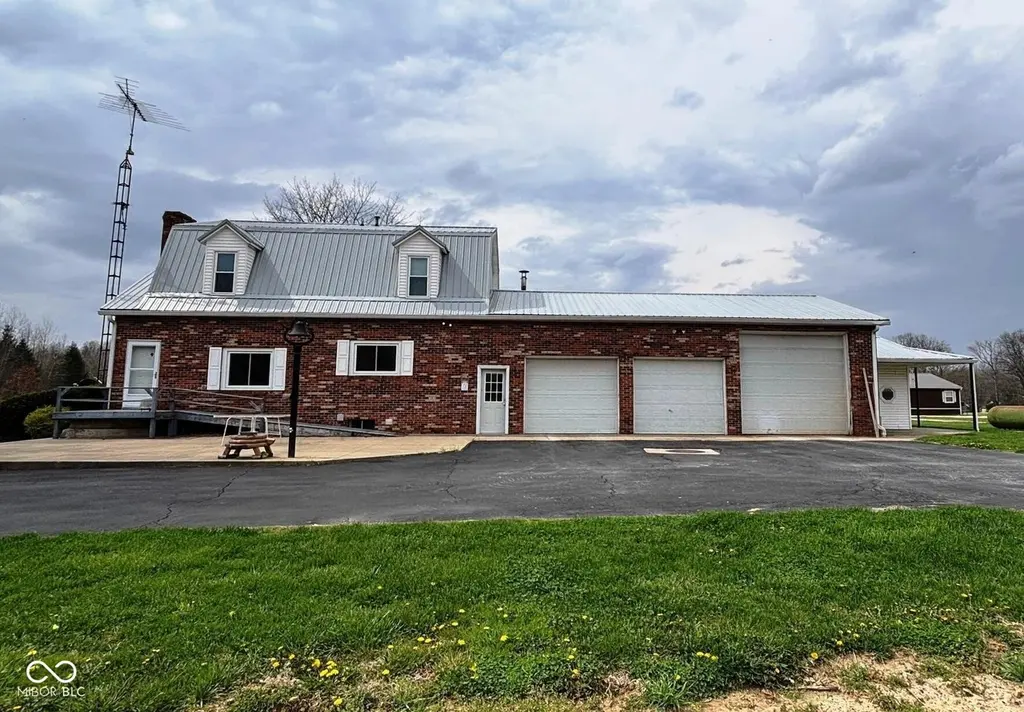
3840 E County Road 20 N · Grayford, IN
Flood risk 1/10 · Minimal
- FEMA flood zone
- X (unshaded)
- Chance of flooding over 30 yrs
- 0.0%
- Est. flood insurance / yr
- $507 – $1,088
Fire risk 1/10 · Minimal
- Est. fire insurance / yr
- $717 – $1,331
Heat risk 4/10 · Minor
- Hot days now (above 105°F)
- 7 days/yr
- Hot days in 30 yrs
- 19 days/yr
Wind risk 2/10 · Minimal
- Chance of severe wind over 30 yrs
- 1.0%
Air-quality risk 2/10 · Minimal
- Unhealthy air days now
- 1 days/yr
- Unhealthy air days in 30 yrs
- 2 days/yr
Risk factors via First Street. Map © Google.
Why this score? — see what drove the B- grade
The composite is a weighted blend of 9 inputs, each scored 0–100. Each bar is that input's sub-score; the figure is the points it added to the 100-point composite (weight × sub-score).
- Cash flow +30.0/30.0
- 1% rule +10.0/10.0
- DSCR +10.0/10.0
- ARV discount +7.5/15.0
- Schools +3.0/10.0
- Rent growth +2.5/5.0
- Livability +2.5/5.0
- Condition / age +2.2/5.0
- Appreciation +0.0/10.0
$100,000
🖨 Deal sheet 📄 Offer letter ✓ Due diligence
Listing remarks MLS
For Auction, 13.114 ac parcel with a 1942 sq ft home featuring 3 bedrooms, 2 full baths, and 2 half baths. Home has a welcoming living room with a fireplace and a large kitchen. Attached is a large 3+ car attached garage. Outside you will find an in ground pool with large patio, a gazebo and a pool house, great for entertaining on hot summer days. There is a large, approximately 3,000 sq ft barn with 4 overhead doors and loft. There is also a 640 sq ft building, previously used as a residence with an attached 640 sq ft garage/workshop. Lots more to see at this property
Key facts
- Overhead doors
- Gazebo
- Large patio
Tags
Neighborhood map
What this means for you Summary
Snapshot
- This is a 3-bed/3.0-bath single-family listed at $100k. Condition is rated fair.
Deal economics
- At list price, monthly cash flow is $507 ($6k/yr) — positive.
- The deal already cash-flows at list — no discount required.
- Meets the 1% rule at list price ($2k rent vs $100k).
- Recommended offer: $97k (3.0% below list) — sets the bar for market timing.
Location & tenants
- Location reads: area grade B — affects rentability + tenant quality, not the cash-flow math above.
- Jennings County School Corporation (rural): math 32% / reading 38% proficiency, ranked #194 of 301 in IN (top 64%) — families likely to look elsewhere, expect single-tenant / working-renter base with shorter leases.
- Market conditions: 160 active listings in the ZIP; 84 units permitted in Jennings County in 2024 (0 in 5+ unit buildings).
Forward outlook
- Local home prices are declining (-3.0%/yr); year-one equity from $691 of loan paydown is wiped out by about $3k of value loss. Plan a longer hold.
- Jennings County population projected at -21% by 2050 — secular population decline; favor cash flow + early exit over multi-decade hold.
- At projected returns (-3.0% appreciation + 3.0% rent growth), your $28k cash investment doubles in ~6 years — after that, you're playing with house money.
Negotiation context
- It's been on market 32 days — a 3% lower offer ($97k) is reasonable based on typical stale-listing flexibility.
Risks & watch-outs
- Watch-outs: built in 1925 — expect roof / HVAC / electrical / plumbing capex.
Questions for the listing agent
- It's been on market 32 days. Have you received any prior offers? Is the seller open to a 3% concession, seller financing, or rate buy-down credit?
- Have any recent inspections been done? Can we get a copy of the seller's disclosures and any deferred-maintenance estimates?
- Built in 1925 — when were the roof, HVAC, electrical panel, plumbing, and water heater last replaced?
- Is there a deadline driving the sale (1031 exchange, divorce, estate, relocation)? That informs how much negotiation room exists.
- What's the average days-on-market for RENTAL listings here right now (not sales)? A rising rental-DOM trend means longer vacancies and softer asking-rent achievability than the comps imply.
- What's the recent tenant-quality profile in this submarket — average credit score on applications, eviction rate, late-payment / NSF rate, and stable-employment percentage? A property-management company in the area should have these aggregated.
- How much new for-sale + rental construction is in the pipeline within 1–3 miles? Heavy new supply typically softens prices + rents 12–24 months out; constrained supply supports both.
Investment metrics
- 1% rule
- 1.52% ✓
- Cap rate
- 12.38%
- Cash-on-cash
- 21.72%
- DSCR
- 1.97
- GRM
- 5.5
CMA / ARV
- ARV (median comp)
- $269,760
- List price
- $100,000
- Delta
- -62.93%
- Verdict
- UNDERPRICED
- Comps
- 3 within 2.0 mi
Projected returns pro-forma
-3.0% appreciation · 3.0% rent growth · sell at horizon
- IRR
- 14.4%
- Equity multiple
- 1.58×
- Total profit
- $16,102
- Equity at exit
- $14,910
- IRR
- 23.1%
- Equity multiple
- 2.99×
- Total profit
- $55,685
- Equity at exit
- $8,646
Cash invested: $28,000 (down + closing). Projections, not guarantees.
Landlord ↔ Tenant lean methodology
- Overall (STATE)
- 90 Strongly Landlord-Friendly
- State Indiana
- 90 Strongly Landlord-Friendly · R+11
- County
- — inherits STATE
- City
- — inherits STATE
ZIP-level market 47265
- Home prices YoY
- -31.5%
- Active inventory
- 160
- Price-to-rent
- 5.5×
Monthly cashflow live
- Estimated rent
- $1,516 medium interval (Pro) →
- Mortgage (P&I)
- −$524
- Tax est. 1.5%
- −$125 /mo · $1,500/yr
- Insurance
- −$42
- HOA
- −$0
- Vacancy / Maint / Mgmt
- −$318
- Net cashflow
- $507
Break-even live
UW: 25.0% down · 7.5% · 30yr · 1.5% tax · 5.0% vac · 8.0% maint · 8.0% mgmt
Financing live
Cash to close
- Down payment
- $25,000
- Closing costs
- $3,000
- Reserves months
- —
- Total cash needed
- —
Loan-product check · same deal, 3 products live
Conventional
25% down · 7.5% · 30yr
- Down + closing
- —
- Monthly P&I
- —
- Monthly cashflow
- —
- DSCR
- —
- Eligible?
- —
Personal DTI + credit; lowest rate.
DSCR
20% down · 8.5% · 30yr
- Down + closing
- —
- Monthly P&I
- —
- Monthly cashflow
- —
- DSCR
- —
- Eligible?
- —
No personal income docs; deal must DSCR.
Hard money
10% down · 12.0% · 12mo
- Down + closing
- —
- Monthly P&I
- —
- Monthly cashflow
- —
- DSCR
- —
- Eligible?
- —
Short-term bridge; refi at stabilization.
Listing history 3 events
-
2026-05-04status Pending 580-char remark
Show marketing remark (580 chars)
For Auction, 13.114 ac parcel with a 1942 sq ft home featuring 3 bedrooms, 2 full baths, and 2 half baths. Home has a welcoming living room with a fireplace and a large kitchen. Attached is a large 3+ car attached garage. Outside you will find an in ground pool with large patio, a gazebo and a pool house, great for entertaining on hot summer days. There is a large, approximately 3,000 sq ft barn with 4 overhead doors and loft. There is also a 640 sq ft building, previously used as a residence with an attached 640 sq ft garage/workshop. Lots more to see at this property
-
2026-05-02price $100,000 580-char remark
Show marketing remark (580 chars)
For Auction, 13.114 ac parcel with a 1942 sq ft home featuring 3 bedrooms, 2 full baths, and 2 half baths. Home has a welcoming living room with a fireplace and a large kitchen. Attached is a large 3+ car attached garage. Outside you will find an in ground pool with large patio, a gazebo and a pool house, great for entertaining on hot summer days. There is a large, approximately 3,000 sq ft barn with 4 overhead doors and loft. There is also a 640 sq ft building, previously used as a residence with an attached 640 sq ft garage/workshop. Lots more to see at this property
-
2026-04-01$1 Active 580-char remark
Show marketing remark (580 chars)
For Auction, 13.114 ac parcel with a 1942 sq ft home featuring 3 bedrooms, 2 full baths, and 2 half baths. Home has a welcoming living room with a fireplace and a large kitchen. Attached is a large 3+ car attached garage. Outside you will find an in ground pool with large patio, a gazebo and a pool house, great for entertaining on hot summer days. There is a large, approximately 3,000 sq ft barn with 4 overhead doors and loft. There is also a 640 sq ft building, previously used as a residence with an attached 640 sq ft garage/workshop. Lots more to see at this property
ⓘ Source: listings_history table (triggers on properties + properties_extension) + one-shot
backfill from property_details.listing_events for pre-trigger history.
Climate risk First Street
- Flood 1/10 Low FEMA zone X (unshaded) · 0% chance over 30 yrs
- Wildfire 1/10 Low
- Heat 4/10 Moderate 7 d/yr ≥105°F today · 19 d/yr by 30 yrs out
- Wind 2/10 Low 100% chance of damaging wind over 30 yrs
- Air quality 2/10 Low 1 unhealthy d/yr today · 2 by 30 yrs out
Nearby sold comps map
Loading sold comps map…
Walkable amenities ~0.75 mi
Loading nearby amenities…
Taxation est. · year 1
- Rental income
- $18,197
- − Mortgage interest
- −$5,602
- − Property taxes
- −$1,500
- − Insurance
- −$500
- − Repairs & maintenance
- −$1,456
- − Management
- −$1,456
- − Depreciation
- −$2,909
- Taxable income
- $4,775
- Est. tax owed @ 24.0%
- −$1,146
- After-tax cash flow
- $4,937/yr
For passive investors: Depreciation is non-cash, so a rental often shows a tax loss while cash-flowing — sheltering income. Rental losses are passive: they offset passive income freely, and up to $25,000/yr can offset ordinary (W-2) income if you actively participate and your MAGI is under $100k (phasing out to $0 by $150k); unused losses carry forward. On sale, claimed depreciation is recaptured at up to 25%, and gains may owe capital-gains tax (a 1031 exchange can defer both). Figures are a year-1 estimate at your 24.0% rate — not tax advice; consult a CPA.
Condition & rehab AI · 13 photos
The property requires moderate repairs and maintenance, with potential for significant value increase through painting, landscaping, and flooring updates.
Repairs flagged
- Minor Brick siding — Some discoloration
- Minor Carpeted floors — Worn appearance
- Minor Paint — Worn in some areas
Value-add opportunities
- Both Painting and touch-up — Enhances curb appeal and interior aesthetics
- Both Landscaping — Improves curb appeal and enhances property value
- Both Flooring replacement — Fresh carpet or hardwood flooring improves living space quality
Renovation cost estimate screening
| Repair item | Severity | Est. cost |
|---|---|---|
| Brick siding · Some discoloration | Minor | $500–3,000 |
| Carpeted floors · Worn appearance | Minor | $500–3,000 |
| Paint · Worn in some areas | Minor | $500–3,000 |
| Total estimated repair cost · 3 items | $1,500–9,000 |
Value-add ROI direction
- Both Painting and touch-up — Enhances curb appeal and interior aesthetics ↑
- Both Landscaping — Improves curb appeal and enhances property value ↑
- Both Flooring replacement — Fresh carpet or hardwood flooring improves living space quality ↑
ⓘ Cost ranges are severity-bucket heuristics (US national rule-of-thumb). Get contractor quotes + a written scope before underwriting a rehab budget.
Schools (NCES district)
- District
- Jennings County School Corporation
- NCES district ID
- 1805190
- Math proficiency
- 32% ▼ -11.00%
- Reading proficiency
- 38% ▼ -6.00%
- Median HH income
- $45,418
- Composite
- 29.89/100
- National rank
- #6394
- State rank
- #194 of 301 in IN
Livability — Grayford
No livability data for this city. (Only ~50 U.S. cities are tracked.)
Census & demographics
- Population (ZIP)
- 20,981
Population outlook (Jennings County) Hauer SSP2
- Today (2025)
- 26,584 people
- By 2030
- 25,591 · -3.7%
- By 2040
- 23,423 · -11.9%
- By 2050
- 20,973 · -21.1%
- By 2075
- 15,445 · -41.9%
- By 2100
- 10,714 · -59.7%
Race, ethnicity, and origin ACS 2023
- Neighborhood character
- Predominantly White (92%)
- Race & ethnicity
- White 92% Hispanic / Latino 4% Two or more races 3%
- Common ancestry
- Slovak 2% Romanian 1% Italian 1%
- Foreign-born
- 1% · Canada
- Languages at home
- 96% English-only · Spanish 2% German/W. Germanic 1%
Political lean MEDSL · Jennings
- 2024 margin
- Solid R (+58.8) · D 19.7% · R 78.5% · Other 1.8%
- 2008→2024 swing
- -50.8pp toward R · 2008: -8.0pp · 2024: -58.8pp
- All cycles
- 2024: R+58.8 2020: R+56.9 2016: R+52.7 2012: R+22.4 2008: R+8.0
Not yet ingested
- Civics
- —
Market trends
- HPI YoY
- ▼ -107.36%
- Current HPI
- 233.0275
- Rent YoY
- —
- Metro
- —
- State GDP YoY
- ▲ 2.90%
- F500 in state
- 18
Industry mix (Fortune 500 HQ in IN)
| Industry | F500 HQs | Revenue |
|---|---|---|
| Industrial Machinery | 2 | $37B |
|
||
| Healthcare | 1 | $177B |
|
||
| Pharmaceuticals | 1 | $45B |
|
||
| Metals / Steel | 1 | $18B |
|
||
| Agriculture | 1 | $17B |
|
||
| Packaging | 1 | $12B |
|
||
Price history
3 events — show timeline
- 2026-05-04 Pending — MIBOR as Distributed by MLS Grid
- 2026-05-02 Price Changed $100,000 MIBOR as Distributed by MLS Grid
- 2026-04-01 Listed $1 MIBOR as Distributed by MLS Grid
Cash-flow waterfall
monthlySold comps — $/sqft
last 12 mo · ≤1 miLoading sold comps…