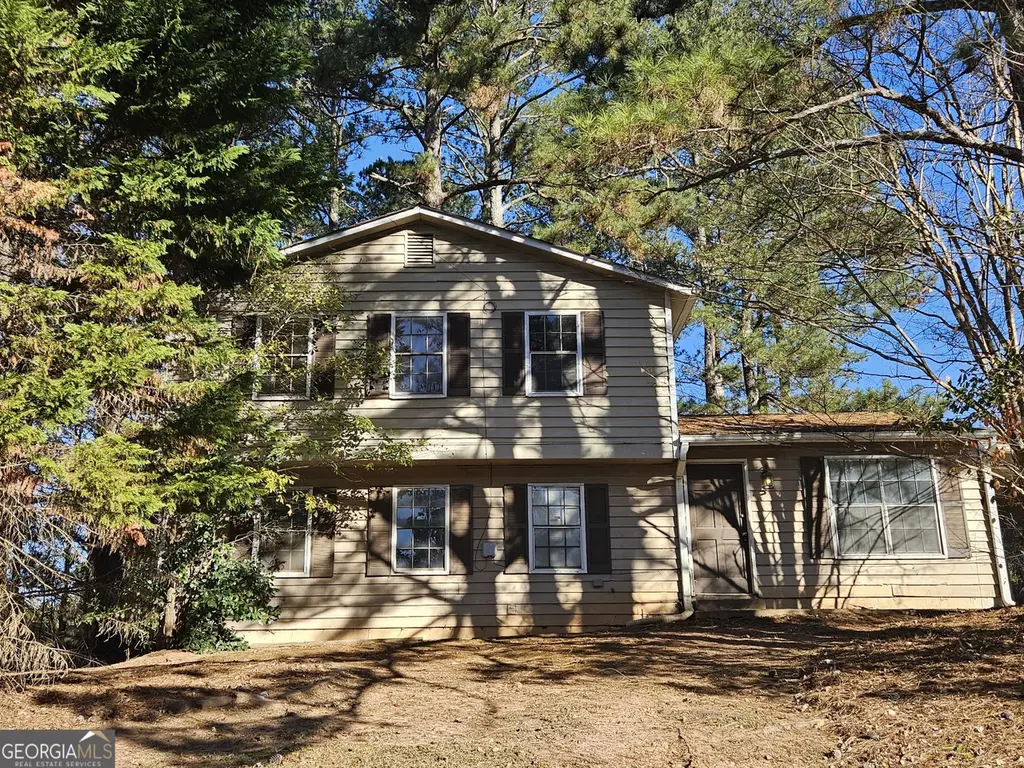
743 Summer Chase Dr · Riverdale, GA
Flood risk 1/10 · Minimal
- FEMA flood zone
- X (unshaded)
- Chance of flooding over 30 yrs
- 0.0%
- Est. flood insurance / yr
- $507 – $1,088
Fire risk 3/10 · Minor
- Est. fire insurance / yr
- $963 – $1,789
Heat risk 6/10 · Moderate
- Hot days now (above 105°F)
- 7 days/yr
- Hot days in 30 yrs
- 18 days/yr
Wind risk 6/10 · Moderate
- Chance of severe wind over 30 yrs
- 27.0%
Air-quality risk 4/10 · Minor
- Unhealthy air days now
- 4 days/yr
- Unhealthy air days in 30 yrs
- 6 days/yr
Risk factors via First Street. Map © Google.
Why this score? — see what drove the B- grade
The composite is a weighted blend of 9 inputs, each scored 0–100. Each bar is that input's sub-score; the figure is the points it added to the 100-point composite (weight × sub-score).
- Cash flow +24.9/30.0
- ARV discount +15.0/15.0
- DSCR +8.1/10.0
- 1% rule +6.8/10.0
- Livability +3.5/5.0
- Rent growth +3.0/5.0
- Condition / age +2.5/5.0
- Schools +1.3/10.0
- Appreciation +0.0/10.0
$160,000
🖨 Deal sheet (PDF) 📄 Offer letter ✓ Due diligence
Listing remarks MLS
Investor special! Fixer Upper!
Key facts
- Built 1979
- Listed 128 days
Neighborhood map
What this means for you Summary
Snapshot
- This is a 4-bed/2.0-bath single-family listed at $160k.
Deal economics
- At list price, monthly cash flow is $341 ($4k/yr) — positive.
- The deal already cash-flows at list — no discount required.
- Meets the 1% rule at list price ($2k rent vs $160k).
- Recommended offer: $141k (12.0% below list) — sets the bar for market timing.
- Cap rate 8.9% vs local median 5.5% in Riverdale — top-decile yield for the area; either an underpriced asset or a hidden risk that comps aren't pricing in. Stress-test before assuming the spread holds.
Location & tenants
- Location reads 70/100 on livability (#100 in GA) — a middle-class / working-renter tenant base. Strengths: cost of living A+, housing A+; Watch: crime D, schools D-, amenities F.
- Clayton County (suburban): math 11% / reading 20% proficiency, ranked #155 of 174 in GA (top 89%) — low school quality limits family demand, transient renter base, plan for 1-2y turnover; 78% free/reduced lunch — lower-income household profile, screen leases tightly.
- Market conditions: Rents rising (+2.1%/yr); 259 active listings in the ZIP; 40 comparable units currently listed for rent nearby; rentals at typical pace (median 25d on market — plan ~3-4 weeks tenant-placement turnaround); 865 units permitted in Clayton County in 2024 (448 in 5+ unit buildings).
- This rent runs 36% of the median local income ($62k/yr) — at the standard rent-burdened threshold; future hikes will face affordability resistance.
Forward outlook
- Local home prices are declining (-3.0%/yr); year-one equity from $1k of loan paydown is wiped out by about $5k of value loss. Plan a longer hold.
- Clayton County population projected at +29% by 2050 — long-run rental-demand tailwind backs the buy-and-hold thesis.
Negotiation context
- It's been on market 128 days — a 12% lower offer ($141k) is reasonable based on typical stale-listing flexibility.
- 7 sale attempts since 14y ago with the ask held roughly flat each time — persistent listings suggest the price (not the market) is what's stuck; bring a comps-based counter.
- Current owner paid $73k; list at $160k implies a 119% gain — meaningful room to come down on a strong offer.
Risks & watch-outs
- Climate carrying-cost: major wind risk, 27% chance of damaging wind over 30y; extreme-heat days projected 7→18/yr by 2055 (HVAC capex compounding) — expect insurance premiums to compound above CPI over the hold.
Questions for the listing agent
- It's been on market 128 days. Have you received any prior offers? Is the seller open to a 12% concession, seller financing, or rate buy-down credit?
- Built in 1979 — when were the roof, HVAC, electrical panel, plumbing, and water heater last replaced?
- Why hasn't it sold? Are there any deal-killer items the seller is aware of (foundation, flood, title, zoning, code violations)?
- Is there a deadline driving the sale (1031 exchange, divorce, estate, relocation)? That informs how much negotiation room exists.
- Schools are D-rated, which usually means shorter tenancies and higher turnover. Who's the typical renter profile here, and what's been the actual vacancy rate?
- Crime grade is D in this area — have there been break-ins, vandalism, or insurance claims at this property in the last 3 years? What carrier currently insures it and at what premium?
- What's the average days-on-market for RENTAL listings here right now (not sales)? A rising rental-DOM trend means longer vacancies and softer asking-rent achievability than the comps imply.
- What's the recent tenant-quality profile in this submarket — average credit score on applications, eviction rate, late-payment / NSF rate, and stable-employment percentage? A property-management company in the area should have these aggregated.
- How much new for-sale + rental construction is in the pipeline within 1–3 miles? Heavy new supply typically softens prices + rents 12–24 months out; constrained supply supports both.
Investment metrics
- 1% rule
- 1.18% ✓
- Cap rate
- 8.85%
- Cash-on-cash
- 9.13%
- DSCR
- 1.41
- GRM
- 7.1
CMA / ARV
- ARV (median comp)
- $246,860
- List price
- $160,000
- Delta
- -35.19%
- Verdict
- UNDERPRICED
- Comps
- 20 within 1.0 mi
Show comp detail 12 sales within ~0.75 mi
| Address | Dist | Beds/Ba | Sqft | Sold | Price | $/sf | Match |
|---|---|---|---|---|---|---|---|
| 616 Country Lane Dr | 0.29mi | 4/2.0 | 1,488 (+1%) | 2mo | $215,000 | $144 | 82 |
| 8970 Saddlewood Dr | 0.14mi | 3/2.5 (-1) | 1,528 (+4%) | 4mo | $185,000 | $121 | 76 |
| 815 Darlington Dr | 0.26mi | 3/2.0 (-1) | 1,517 (+3%) | 7mo | $247,000 | $163 | 72 |
| 8949 Raven Dr | 0.23mi | 4/2.0 | 1,250 (-15%) | 2mo | $240,000 | $192 | 63 |
| 8737 Edenton Way | 0.46mi | 3/2.0 (-1) | 1,392 (-5%) | 4mo | $241,500 | $173 | 61 |
| 9240 Sunset Dr | 0.55mi | 3/2.0 (-1) | 1,534 (+4%) | 1mo | $220,000 | $143 | 61 |
| 8865 Raven Dr | 0.18mi | 3/2.0 (-1) | 1,252 (-15%) | 1mo | $144,000 | $115 | 61 |
| 8896 Wellston Ct | 0.53mi | 4/2.0 | 1,616 (+10%) | 2mo | $261,000 | $162 | 57 |
| 8680 Redland Ct | 0.55mi | 3/2.0 (-1) | 1,362 (-7%) | 1mo | $181,000 | $133 | 56 |
| 9319 Forest Knoll Dr | 0.68mi | 3/2.0 (-1) | 1,500 (+2%) | 7mo | $184,000 | $123 | 54 |
| 714 Chatham Trl | 0.31mi | 3/2.0 (-1) | 1,668 (+14%) | 6mo | $188,500 | $113 | 53 |
| 1089 Brandon Hill Way | 0.75mi | 3/2.0 (-1) | 1,250 (-15%) | 4mo | $179,000 | $143 | 32 |
Match score weights: distance 35% · size 25% · config 20% · recency 20%. Top-matched comps best support the ARV.
Projected returns pro-forma
-3.0% appreciation · 2.06% rent growth · sell at horizon
- IRR
- -3.6%
- Equity multiple
- 0.87×
- Total profit
- $-5,922
- Equity at exit
- $23,857
- IRR
- 5.0%
- Equity multiple
- 1.36×
- Total profit
- $15,910
- Equity at exit
- $13,834
Cash invested: $44,800 (down + closing). Projections, not guarantees.
Landlord ↔ Tenant lean methodology
- Overall (STATE)
- 90 Strongly Landlord-Friendly
- State Georgia
- 90 Strongly Landlord-Friendly · R+3
- County
- — inherits STATE
- City
- — inherits STATE
ZIP-level market 30238
- Home prices YoY
- -33.3%
- Rents YoY
- 2.1%
- Active inventory
- 259
- Price-to-rent
- 7.1×
Monthly cashflow live
- Estimated rent
- $1,891 high interval (Pro) →
- Mortgage (P&I)
- −$839
- Tax from tax record
- −$247 /mo · $2,964/yr
- Insurance
- −$67
- HOA
- −$0
- Vacancy / Maint / Mgmt
- −$397
- Net cashflow
- $341
Break-even live
Sensitivity live
| Price | -10% $432 | -5% $386 | +0% $341 | +5% $296 | +10% $250 |
|---|---|---|---|---|---|
| Rent | -10% $192 | -5% $266 | +0% $341 | +5% $416 | +10% $490 |
| Rate | -1.0pp $422 | -0.5pp $382 | base $341 | +0.5pp $300 | +1.0pp $257 |
UW: 25.0% down · 7.5% · 30yr · 1.5% tax · 5.0% vac · 8.0% maint · 8.0% mgmt
Financing live
Cash to close
- Down payment
- $40,000
- Closing costs
- $4,800
- Reserves months
- —
- Total cash needed
- —
Loan-product check · same deal, 3 products live
Conventional
25% down · 7.5% · 30yr
- Down + closing
- —
- Monthly P&I
- —
- Monthly cashflow
- —
- DSCR
- —
- Eligible?
- —
Personal DTI + credit; lowest rate.
DSCR
20% down · 8.5% · 30yr
- Down + closing
- —
- Monthly P&I
- —
- Monthly cashflow
- —
- DSCR
- —
- Eligible?
- —
No personal income docs; deal must DSCR.
Hard money
10% down · 12.0% · 12mo
- Down + closing
- —
- Monthly P&I
- —
- Monthly cashflow
- —
- DSCR
- —
- Eligible?
- —
Short-term bridge; refi at stabilization.
Rent comps 40 comps
| Address | Beds | Baths | Sqft | Rent | $/sqft | DOM | Units | Dist |
|---|---|---|---|---|---|---|---|---|
| 9039 Raven Dr Jonesboro, GA | 4.0 | 2.0 | 1560 | $1,795 | $1.15 | 44d | 1 | 0.14mi |
| 655 Post Oak Rd Jonesboro, GA | 3.0 | 1.0 | 1302 | $1,400 | $1.08 | 0d | 1 | 0.21mi |
| 8983 Habersham Dr Jonesboro, GA | 4.0 | 2.0 | 1770 | $1,910 | $1.08 | 45d | 1 | 0.25mi |
| 640 Post Oak Rd Jonesboro, GA | 3.0 | 2.0 | 1508 | $1,780 | $1.18 | 6d | 1 | 0.25mi |
| 672 Raven Ct Jonesboro, GA | 3.0 | 2.0 | 1362 | $1,645 | $1.21 | 44d | 1 | 0.26mi |
| 372 Cheri Pl Jonesboro, GA | 3.0 | 2.0 | 1468 | $1,749 | $1.19 | 25d | 1 | 0.26mi |
| 575 Oak Trace Ct Jonesboro, GA | 3.0 | 2.0 | 1302 | $1,761 | $1.35 | 44d | 1 | 0.31mi |
| 772 Pointe South Pkwy Jonesboro, GA | 3.0 | 2.5 | 1202 | $1,384 | $1.15 | 44d | 1 | 0.34mi |
| 603 Chatham Trl Jonesboro, GA | 5.0 | 4.0 | 1822 | $2,381 | $1.31 | 0d | 1 | 0.48mi |
| 801 Redland Dr Jonesboro, GA | 3.0 | 2.0 | 1370 | $1,750 | $1.28 | 44d | 1 | 0.59mi |
| 801 Redland Dr Jonesboro, GA | 3.0 | 2.0 | 1370 | $1,725 | $1.26 | 13d | 1 | 0.59mi |
| 785 Redland Dr Jonesboro, GA | 4.0 | 2.0 | 1496 | $1,935 | $1.29 | 13d | 1 | 0.61mi |
| 8931 Wesley Pl Jonesboro, GA | 3.0 | 2.0 | 1216 | $1,498 | $1.23 | 25d | 1 | 0.61mi |
| 432 Wesley Park Dr Jonesboro, GA | 3.0 | 2.0 | 1350 | $1,685 | $1.25 | 25d | 1 | 0.63mi |
| 8669 Thomas Rd Riverdale, GA | 3.0 | 2.5 | 1532 | $1,623 | $1.06 | 44d | 1 | 0.67mi |
| 8643 Thomas Ln Riverdale, GA | 3.0 | 2.5 | 1530 | $1,738 | $1.14 | 0d | 1 | 0.70mi |
| 8641 Thomas Ln Riverdale, GA | 4.0 | 3.0 | 1540 | $1,828 | $1.19 | 0d | 1 | 0.70mi |
| 8644 Thomas Ln Riverdale, GA | 3.0 | 2.5 | 1530 | $1,623 | $1.06 | 44d | 1 | 0.71mi |
| 407 Churchill Ct Jonesboro, GA | 3.0 | 2.5 | 1662 | $1,800 | $1.08 | 0d | 1 | 0.72mi |
| 8640 Thomas Ln Riverdale, GA | 3.0 | 2.5 | 1530 | $1,643 | $1.07 | 0d | 1 | 0.72mi |
| 8631 Thomas Ln Riverdale, GA | 3.0 | 2.5 | 1530 | $1,673 | $1.09 | 23d | 1 | 0.73mi |
| 9265 Forest Knoll Dr Jonesboro, GA | 3.0 | 2.0 | 1272 | $2,400 | $1.89 | 44d | 1 | 0.75mi |
| 8588 Creekwood Way Jonesboro, GA | 3.0 | 1.5 | 1344 | $1,300 | $0.97 | 6d | 1 | 0.75mi |
| 1022 Brandon Hill Way Jonesboro, GA | 3.0 | 2.0 | 1022 | $1,600 | $1.57 | 0d | 1 | 0.76mi |
| 8630 Thomas Rd Riverdale, GA | 3.0 | 2.5 | 1530 | $1,500 | $0.98 | 25d | 1 | 0.76mi |
| 8609 Thomas Ln Riverdale, GA | 3.0 | 2.5 | 1530 | $1,628 | $1.06 | 0d | 1 | 0.77mi |
| 8612 Thomas Rd Riverdale, GA | 3.0 | 2.5 | 1532 | $1,623 | $1.06 | 44d | 1 | 0.79mi |
| 8584 Guthrie Dr Riverdale, GA | 3.0 | 2.0 | 1445 | $1,650 | $1.14 | 16d | 1 | 0.80mi |
| 9375 Woodknoll Way Jonesboro, GA | 3.0 | 2.0 | 1558 | $1,841 | $1.18 | 44d | 1 | 0.80mi |
| 8614 Cedar Creek Rdg Riverdale, GA | 3.0 | 2.5 | 1728 | $1,500 | $0.87 | 44d | 1 | 0.89mi |
| 9370 Woodloop Ct Jonesboro, GA | 3.0 | 2.0 | 1353 | $1,731 | $1.28 | 0d | 1 | 0.90mi |
| 8600 Cedar Creek Rdg Riverdale, GA | 3.0 | 2.0 | 1555 | $1,745 | $1.12 | 6d | 1 | 0.91mi |
| 9360 Thomas Rd Jonesboro, GA | 3.0 | 2.0 | 1400 | $1,700 | $1.21 | 25d | 1 | 0.94mi |
| 566 Brookfield Way Jonesboro, GA | 3.0 | 2.0 | 1432 | $1,500 | $1.05 | 44d | 1 | 0.97mi |
| 505 Brookfield Way Jonesboro, GA | 3.0 | 2.0 | 1400 | $1,655 | $1.18 | 25d | 1 | 0.98mi |
| 8443 Cedar Creek Rdg Riverdale, GA | 3.0 | 2.0 | 1476 | $1,735 | $1.18 | 20d | 1 | 1.01mi |
| 271 River Chase Dr Jonesboro, GA | 3.0 | 2.0 | 1148 | $1,620 | $1.41 | 25d | 1 | 1.04mi |
| 423 Brookfield Way Jonesboro, GA | 3.0 | 2.0 | 1400 | $1,720 | $1.23 | 0d | 1 | 1.05mi |
| 161 Sterling Ridge Dr Riverdale, GA | 4.0 | 2.0 | 1686 | $1,495 | $0.89 | 25d | 1 | 1.10mi |
| 693 Oak Dr Riverdale, GA | 4.0 | 2.5 | 1325 | $1,825 | $1.38 | 6d | 1 | 1.10mi |
Listing history 30 events
-
2026-06-03statusdays on market $160,000 Under Contract 128 DOM
-
2026-06-02days on market $160,000 Active 127 DOM
-
2026-06-01days on market $160,000 Active 126 DOM
-
2026-05-31days on market $160,000 Active 125 DOM
-
2026-03-25status Back On Market 30-char remark
Show marketing remark (30 chars)
Investor special! Fixer Upper!
-
2026-03-19status Under Contract 30-char remark
Show marketing remark (30 chars)
Investor special! Fixer Upper!
-
2026-02-10status Back On Market 30-char remark
Show marketing remark (30 chars)
Investor special! Fixer Upper!
-
2026-01-07status Under Contract 30-char remark
Show marketing remark (30 chars)
Investor special! Fixer Upper!
-
2025-12-12$160,000 New 30-char remark
Show marketing remark (30 chars)
Investor special! Fixer Upper!
-
2018-05-11soldstatus $73,000
-
2018-05-08soldstatus $73,000 Sold 123-char remark
Show marketing remark (123 chars)
Tenant occupied investment opportunity. Do no disturb tenant. Showing during due diligence only. Sold "as is".
-
2018-04-09status Under Contract 123-char remark
Show marketing remark (123 chars)
Tenant occupied investment opportunity. Do no disturb tenant. Showing during due diligence only. Sold "as is".
-
2018-03-29status Back on Market 123-char remark
Show marketing remark (123 chars)
Tenant occupied investment opportunity. Do no disturb tenant. Showing during due diligence only. Sold "as is".
-
2018-03-12status Under Contract 123-char remark
Show marketing remark (123 chars)
Tenant occupied investment opportunity. Do no disturb tenant. Showing during due diligence only. Sold "as is".
-
2018-03-06$79,000 New 123-char remark
Show marketing remark (123 chars)
Tenant occupied investment opportunity. Do no disturb tenant. Showing during due diligence only. Sold "as is".
-
2014-10-31price $22,100
-
2013-01-24price $22,100
-
2012-07-23soldstatus $55,000
-
2012-06-11soldstatus $22,100 Sold
-
2012-06-07historical
-
2012-06-05price $55,000
-
2012-05-15$55,000 New
-
2012-04-13soldstatus $22,100 Sold
-
2012-04-09historical
-
2012-03-28price $23,500
-
2012-02-15$23,500 New
-
2003-10-08soldstatus $88,800
-
1999-10-07soldstatus $88,800
-
1994-09-19soldstatus $64,900
-
1981-05-15soldstatus $45,515
ⓘ Source: listings_history table (triggers on properties + properties_extension) + one-shot
backfill from property_details.listing_events for pre-trigger history.
Tax reassessment forecast GA · Resets to sale price
- Current annual tax
- $2,964 · $247/mo
- Projected year-2 tax
- $2,964 · $247/mo
- Expected delta
- $0/yr ($0/mo · 0.0%)
ⓘ Screening estimate from a state-policy table — verify with the county assessor before closing.
Climate risk First Street
- Flood 1/10 Low FEMA zone X (unshaded) · 0% chance over 30 yrs
- Wildfire 3/10 Moderate
- Heat 6/10 Major 7 d/yr ≥105°F today · 18 d/yr by 30 yrs out
- Wind 6/10 Major 27% chance of damaging wind over 30 yrs
- Air quality 4/10 Moderate 4 unhealthy d/yr today · 6 by 30 yrs out
Nearby sold comps map
Loading sold comps map…
Walkable amenities ~0.75 mi
Loading nearby amenities…
Taxation est. · year 1
- Rental income
- $22,690
- − Mortgage interest
- −$8,962
- − Property taxes
- −$2,964
- − Insurance
- −$800
- − Repairs & maintenance
- −$1,815
- − Management
- −$1,815
- − Depreciation
- −$4,655
- Taxable income
- $1,678
- Est. tax owed @ 24.0%
- −$403
- After-tax cash flow
- $3,689/yr
For passive investors: Depreciation is non-cash, so a rental often shows a tax loss while cash-flowing — sheltering income. Rental losses are passive: they offset passive income freely, and up to $25,000/yr can offset ordinary (W-2) income if you actively participate and your MAGI is under $100k (phasing out to $0 by $150k); unused losses carry forward. On sale, claimed depreciation is recaptured at up to 25%, and gains may owe capital-gains tax (a 1031 exchange can defer both). Figures are a year-1 estimate at your 24.0% rate — not tax advice; consult a CPA.
Schools (NCES district)
- District
- Clayton County
- NCES district ID
- 1301230
- Math proficiency
- 11% ▼ -13.00%
- Reading proficiency
- 20% ▼ -9.00%
- Median HH income
- $42,266
- Composite
- 13.41/100
- National rank
- #9527
- State rank
- #155 of 174 in GA
Livability — Riverdale
- Score
- 70/100
- State rank
- #100
- US rank
- #7907
Category grades
Schools grade is shown separately in the Schools card above.
Census & demographics
- County
- Clayton County · 230,153 people
- City population
- 61,126
- Metro
- Atlanta-Sandy Springs-Alpharetta, GA
- Population (ZIP)
- 43,191
- Household income
- $62,185
- Rent vs Own
- Severe rent burden
- 1992.0
Population outlook (Clayton County) Hauer SSP2
- Today (2025)
- 310,777 people
- By 2030
- 329,762 · +6.1%
- By 2040
- 368,052 · +18.4%
- By 2050
- 401,196 · +29.1%
- By 2075
- 472,488 · +52.0%
- By 2100
- 500,446 · +61.0%
Race, ethnicity, and origin ACS 2023
- Neighborhood character
- Predominantly Black (71%)
- Race & ethnicity
- Black 71% Hispanic / Latino 17% White 7% Two or more races 7%
- Hispanic origin (detail)
- Mexican 13% Puerto Rican 2%
- Foreign-born
- 11% · Canada, United Kingdom
- Languages at home
- 83% English-only · Spanish 14% French/Haitian/Cajun 1%
Political lean MEDSL · Clayton
- 2024 margin
- Solid D (+69.2) · D 84.3% · R 15.1%
- 2008→2024 swing
- +2.8pp toward D · 2008: 66.4pp · 2024: 69.2pp
- All cycles
- 2024: D+69.2 2020: D+70.9 2016: D+71.9 2012: D+70.1 2008: D+66.4
Not yet ingested
- Civics
- —
Market trends
- HPI YoY
- ▼ -105.48%
- Current HPI
- 211.6309
- Rent YoY
- ▲ 2.06%
- Metro
- Atlanta-Sandy Springs-Alpharetta, GA
- State GDP YoY
- ▲ 2.66%
- F500 in state
- 28
Industry mix (Fortune 500 HQ in GA)
| Industry | F500 HQs | Revenue |
|---|---|---|
| Paper / Packaging | 2 | $29B |
|
||
| Retail | 1 | $160B |
|
||
| Transportation / Logistics | 1 | $91B |
|
||
| Airlines | 1 | $62B |
|
||
| Consumer Goods | 1 | $47B |
|
||
| Utilities | 1 | $25B |
|
||
Price history
+251.5% since first listed26 events — show timeline
- 2026-03-25 Relisted — GAMLS
- 2026-03-19 Pending — GAMLS
- 2026-02-10 Relisted — GAMLS
- 2026-01-07 Pending — GAMLS
- 2025-12-12 Listed $160,000 GAMLS
- 2018-05-11 Sold (Public Records) $73,000 Public Records
- 2018-05-08 Sold (MLS) $73,000 GAMLS
- 2018-04-09 Pending — GAMLS
- 2018-03-29 Relisted — GAMLS
- 2018-03-12 Pending — GAMLS
- 2018-03-06 Listed $79,000 GAMLS
- 2014-10-31 Price Changed $22,100 GAMLS
- 2013-01-24 Price Changed $22,100 GAMLS
- 2012-07-23 Sold (Public Records) $55,000 Public Records
- 2012-06-11 Sold (MLS) $22,100 GAMLS
- 2012-06-07 Listing Removed — GAMLS
- 2012-06-05 Price Changed $55,000 GAMLS
- 2012-05-15 Listed $55,000 GAMLS
- 2012-04-13 Sold (MLS) $22,100 GAMLS
- 2012-04-09 Listing Removed — GAMLS
- 2012-03-28 Price Changed $23,500 GAMLS
- 2012-02-15 Listed $23,500 GAMLS
- 2003-10-08 Sold (Public Records) $88,800 Public Records
- 1999-10-07 Sold (Public Records) $88,800 Public Records
- 1994-09-19 Sold (Public Records) $64,900 Public Records
- 1981-05-15 Sold (Public Records) $45,515 Public Records
Property tax history
+4.3%/yrLatest (2025): $2,964 · -3.6% YoY. Source: county tax records.
Cash-flow waterfall
monthlySold comps — $/sqft
last 12 mo · ≤1 miLoading sold comps…