11635 E D Ave · South Gull Lake, MI
Flood risk 1/10 · Minimal
- FEMA flood zone
- X (unshaded)
- Chance of flooding over 30 yrs
- 0.0%
- Est. flood insurance / yr
- $507 – $1,088
Fire risk 1/10 · Minimal
- Est. fire insurance / yr
- $784 – $1,456
Heat risk 2/10 · Minimal
- Hot days now (above 100°F)
- 7 days/yr
- Hot days in 30 yrs
- 16 days/yr
Wind risk 2/10 · Minimal
- Chance of severe wind over 30 yrs
- —
Air-quality risk 3/10 · Minor
- Unhealthy air days now
- 2 days/yr
- Unhealthy air days in 30 yrs
- 3 days/yr
Risk factors via First Street. Map © Google.
Why this score? — see what drove the F grade
The composite is a weighted blend of 9 inputs, each scored 0–100. Each bar is that input's sub-score; the figure is the points it added to the 100-point composite (weight × sub-score).
- Cash flow +9.0/30.0
- ARV discount +7.5/15.0
- Schools +4.4/10.0
- 1% rule +2.8/10.0
- DSCR +2.5/10.0
- Rent growth +2.5/5.0
- Condition / age +2.5/5.0
- Livability +2.2/5.0
- Appreciation +0.0/10.0
$229,900
🖨 Deal sheet 📄 Offer letter ✓ Due diligence
Listing remarks MLS
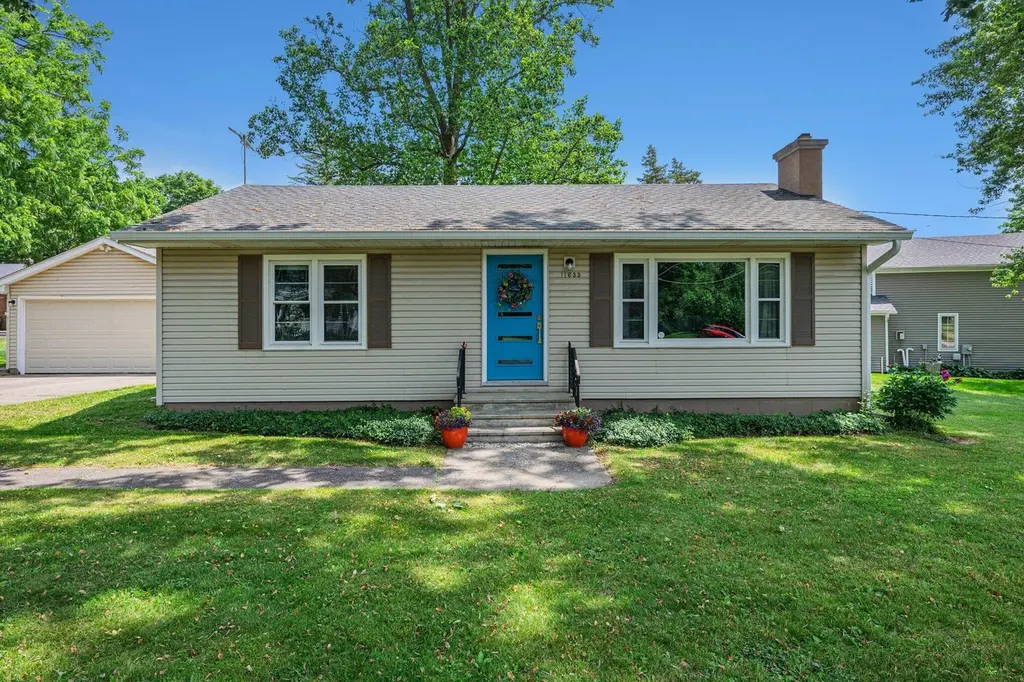
Absolutely adorable and move-in ready! This solidly built home is full of charm, character, and thoughtful updates throughout. The bright and inviting interior features hardwood floors, replacement windows, a cozy fireplace with gas logs, and numerous custom touches that make this home truly special. The finished lower level offers a spacious family room, additional bedroom, and half bath, providing flexible living space for family, guests, or hobbies. Outside, enjoy the fully fenced backyard, mature shade trees, and detached 2-car garage. Major improvements include a newer roof, furnace, central air, updated electrical, plumbing, and much more. Meticulously maintained and packed with value. Gull Lake public access is about 10 minutes away at Ross Township Park. A truly special home not to be missed.
Key facts
- Cozy fireplace
- Hardwood floors
- Replacement windows
Tags
Property features AI
Exterior
- Parking: Detached 2-car garage
- Utilities: Well water; Natural gas available and connected; Electricity available; Cable connected; High-speed internet
- Home design: Ranch-style single family residence; Built in 1960
- Construction: Vinyl siding; Composition roof; Full foundation
- Exterior features: Corner lot; Paved road access; Shed(s) on property
Interior
- Kitchen: Range; Microwave; Refrigerator; Eat-in kitchen
- Bedrooms: Primary bedroom (10 x 13); Bedroom 2 (9 x 9); Bedroom 3 (10 x 8)
- Bathrooms: 1 full bathroom; 1 half bathroom
- Heating & cooling: Forced air heating; Has heating; Has cooling
- Interior features: Garage door opener; Eat-in kitchen; Gas log fireplace; Skylights; Window screens; Replacement windows; Full basement; Total of 4 rooms
- Laundry & utility: Washer; Dryer; Natural gas water heater
Neighborhood map
What this means for you Summary
Snapshot
- This is a 3-bed/1.0-bath single-family listed at $230k.
Deal economics
- At list price, monthly cash flow is $-179 ($-2k/yr) — negative.
- To cash-flow at today's rent, offer at most $198k (13.8% below list).
- To meet the 1% rule (rent ≥ 1% of price), the offer needs to be $180k (21.7% below list).
- Recommended offer: $180k (21.7% below list) — sets the bar for 1% rule.
Location & tenants
- Location reads 44/100 on livability (#687 in MI) — a working-class tenant base; expect higher turnover. Strengths: cost of living A+, crime A; Watch: amenities F, commute F, employment F.
- Gull Lake Community Schools (suburban): math 40% / reading 59% proficiency, ranked #93 of 540 in MI (top 17%) — families likely to look elsewhere, expect single-tenant / working-renter base with shorter leases; only 18% free/reduced lunch — higher-income household profile.
- Market conditions: 129 active listings in the ZIP; 1 comparable units currently listed for rent nearby; 339 units permitted in Kalamazoo County in 2024 (22 in 5+ unit buildings).
Forward outlook
- Local home prices are declining (-3.0%/yr); year-one equity from $2k of loan paydown is wiped out by about $7k of value loss. Plan a longer hold.
- Kalamazoo County population projected at +18% by 2050 — long-run rental-demand tailwind backs the buy-and-hold thesis.
Negotiation context
- Only 4 days on market — expect competitive offers; lowballing is unlikely to land.
- 13 sale attempts since 40y ago with the ask held roughly flat each time — persistent listings suggest the price (not the market) is what's stuck; bring a comps-based counter.
- Current owner paid $120k; list at $230k implies a 92% gain — meaningful room to come down on a strong offer.
Questions for the listing agent
- What do current leases actually rent for vs. the listed asking? Can we see a recent rent roll and the last 12 months of T-12 income?
- Built in 1960 — when were the roof, HVAC, electrical panel, plumbing, and water heater last replaced?
- Is there a deadline driving the sale (1031 exchange, divorce, estate, relocation)? That informs how much negotiation room exists.
- The area grade is low — what's the realistic commute time and amenity access for the typical tenant pool here? Any planned neighborhood developments (good or bad) we should know about?
- What's the average days-on-market for RENTAL listings here right now (not sales)? A rising rental-DOM trend means longer vacancies and softer asking-rent achievability than the comps imply.
- What's the recent tenant-quality profile in this submarket — average credit score on applications, eviction rate, late-payment / NSF rate, and stable-employment percentage? A property-management company in the area should have these aggregated.
- How much new for-sale + rental construction is in the pipeline within 1–3 miles? Heavy new supply typically softens prices + rents 12–24 months out; constrained supply supports both.
Investment metrics
- 1% rule
- 0.78% ✗
- Cap rate
- 5.36%
- Cash-on-cash
- -3.34%
- DSCR
- 0.85
- GRM
- 10.6
CMA / ARV
- ARV (on-the-fly)
- $488,160
- Comps found
- 1
Show comp detail 1 sale within ~0.75 mi
| Address | Dist | Beds/Ba | Sqft | Sold | Price | $/sf | Match |
|---|---|---|---|---|---|---|---|
| 19 Labelle Ter | 0.18mi | 2/1.0 (-1) | 885 (+2%) | 13mo | $500,000 | $565 | 72 |
Match score weights: distance 35% · size 25% · config 20% · recency 20%. Top-matched comps best support the ARV.
Projected returns pro-forma
-3.0% appreciation · 3.0% rent growth · sell at horizon
- IRR
- -21.9%
- Equity multiple
- 0.24×
- Total profit
- $-48,627
- Equity at exit
- $34,279
- IRR
- -15.7%
- Equity multiple
- 0.12×
- Total profit
- $-56,891
- Equity at exit
- $19,878
Cash invested: $64,372 (down + closing). Projections, not guarantees.
Landlord ↔ Tenant lean methodology
- Overall (STATE)
- 62 Landlord-Friendly
- State Michigan
- 62 Landlord-Friendly · EVEN
- County
- — inherits STATE
- City
- — inherits STATE
ZIP-level market 49083
- Active inventory
- 129
- Price-to-rent
- 10.6×
Monthly cashflow live
- Estimated rent
- $1,800 medium interval (Pro) →
- Mortgage (P&I)
- −$1,206
- Tax from tax record
- −$300 /mo · $3,596/yr
- Insurance
- −$96
- HOA
- −$0
- Vacancy / Maint / Mgmt
- −$378
- Net cashflow
- $-179
Break-even live
UW: 25.0% down · 7.5% · 30yr · 1.5% tax · 5.0% vac · 8.0% maint · 8.0% mgmt
Financing live
Cash to close
- Down payment
- $57,475
- Closing costs
- $6,897
- Reserves months
- —
- Total cash needed
- —
Loan-product check · same deal, 3 products live
Conventional
25% down · 7.5% · 30yr
- Down + closing
- —
- Monthly P&I
- —
- Monthly cashflow
- —
- DSCR
- —
- Eligible?
- —
Personal DTI + credit; lowest rate.
DSCR
20% down · 8.5% · 30yr
- Down + closing
- —
- Monthly P&I
- —
- Monthly cashflow
- —
- DSCR
- —
- Eligible?
- —
No personal income docs; deal must DSCR.
Hard money
10% down · 12.0% · 12mo
- Down + closing
- —
- Monthly P&I
- —
- Monthly cashflow
- —
- DSCR
- —
- Eligible?
- —
Short-term bridge; refi at stabilization.
Rent comps 1 comps
| Address | Beds | Baths | Sqft | Rent | $/sqft | DOM | Units | Dist |
|---|---|---|---|---|---|---|---|---|
| 12135 Michigan 89 Unit 2 Richland, MI | 2.0 | 2.0 | 1027 | $1,800 | $1.75 | 43d | 1 | 0.53mi |
Listing history 4 events
-
2026-06-14statusdays on market $229,900 Pending 4 DOM
-
2026-06-13days on market $229,900 Active 3 DOM
-
2026-06-10remarks 699-char remark
-
2026-06-10$229,900 Active 1 DOM
ⓘ Source: listings_history table (triggers on properties + properties_extension) + one-shot
backfill from property_details.listing_events for pre-trigger history.
Tax reassessment forecast MI · Partial reset (capped growth)
- Current annual tax
- $3,596 · $300/mo
- Projected year-2 tax
- $3,596 · $300/mo
- Expected delta
- $0/yr ($0/mo · 0.0%)
ⓘ Screening estimate from a state-policy table — verify with the county assessor before closing.
Climate risk First Street
- Flood 1/10 Low FEMA zone X (unshaded) · 0% chance over 30 yrs
- Wildfire 1/10 Low
- Heat 2/10 Low 7 d/yr ≥100°F today · 16 d/yr by 30 yrs out
- Wind 2/10 Low
- Air quality 3/10 Moderate 2 unhealthy d/yr today · 3 by 30 yrs out
Nearby sold comps map
Loading sold comps map…
Walkable amenities ~0.75 mi
Loading nearby amenities…
Taxation est. · year 1
- Rental income
- $21,600
- − Mortgage interest
- −$12,878
- − Property taxes
- −$3,596
- − Insurance
- −$1,150
- − Repairs & maintenance
- −$1,728
- − Management
- −$1,728
- − Depreciation
- −$6,688
- Taxable loss
- −$6,168
- Est. tax savings @ 24.0%
- +$1,480
- After-tax cash flow
- $-669/yr
For passive investors: Depreciation is non-cash, so a rental often shows a tax loss while cash-flowing — sheltering income. Rental losses are passive: they offset passive income freely, and up to $25,000/yr can offset ordinary (W-2) income if you actively participate and your MAGI is under $100k (phasing out to $0 by $150k); unused losses carry forward. On sale, claimed depreciation is recaptured at up to 25%, and gains may owe capital-gains tax (a 1031 exchange can defer both). Figures are a year-1 estimate at your 24.0% rate — not tax advice; consult a CPA.
Schools (NCES district)
- District
- Gull Lake Community Schools
- NCES district ID
- 2617250
- Math proficiency
- 40% ▼ -6.00%
- Reading proficiency
- 59% ▼ -3.00%
- Median HH income
- $64,763
- Composite
- 43.71/100
- National rank
- #2952
- State rank
- #93 of 540 in MI
Livability — South Gull Lake
- Score
- 44/100
- State rank
- #687
- US rank
- #26750
Category grades
Schools grade is shown separately in the Schools card above.
Census & demographics
- Census place
- South Gull Lake, MI
- Population (ZIP)
- 8,110
Population outlook (Kalamazoo County) Hauer SSP2
- Today (2025)
- 280,982 people
- By 2030
- 292,068 · +3.9%
- By 2040
- 312,191 · +11.1%
- By 2050
- 331,196 · +17.9%
- By 2075
- 379,021 · +34.9%
- By 2100
- 396,579 · +41.1%
Race, ethnicity, and origin ACS 2023
- Neighborhood character
- Predominantly White (92%)
- Race & ethnicity
- White 92% Two or more races 4% Hispanic / Latino 4% Black 2%
- Common ancestry
- Iranian 14% Romanian 7% Italian 3%
- Foreign-born
- 2% · Canada
- Languages at home
- 95% English-only · Spanish 3% German/W. Germanic 1%
Political lean MEDSL · Kalamazoo
- 2024 margin
- D (+17.7) · D 58.0% · R 40.3% · Other 1.7%
- 2008→2024 swing
- -1.8pp toward R · 2008: 19.5pp · 2024: 17.7pp
- All cycles
- 2024: D+17.7 2020: D+18.7 2016: D+12.8 2012: D+13.3 2008: D+19.5
Not yet ingested
- Civics
- —
Market trends
- HPI YoY
- ▼ -152.73%
- Current HPI
- 235.3459
- Rent YoY
- —
- Metro
- —
- State GDP YoY
- ▲ 1.37%
- F500 in state
- 28
Industry mix (Fortune 500 HQ in MI)
| Industry | F500 HQs | Revenue |
|---|---|---|
| Automotive Parts | 3 | $48B |
|
||
| Automotive | 2 | $372B |
|
||
| Chemicals | 1 | $45B |
|
||
| Automotive Retail | 1 | $29B |
|
||
| Healthcare / Medical Devices | 1 | $23B |
|
||
| Automotive Technology | 1 | $20B |
|
||
Price history
+318.0% since first listed24 events — show timeline
- 2026-06-09 Listed $229,900 SW Michigan MLS
- 2026-06-09 Listed $229,900 REALCOMP
- 2026-06-09 Listed $229,900 MiRealSource-MiMLS
- 2022-05-25 Listing Removed — REALCOMP
- 2018-01-18 Sold (Public Records) $119,900 Public Records
- 2018-01-12 Sold (MLS) $119,900 SW Michigan MLS
- 2018-01-12 Sold (MLS) $119,900 REALCOMP
- 2017-11-16 Pending — SW Michigan MLS
- 2017-11-10 Listed $119,900 SW Michigan MLS
- 2017-11-09 Listed $119,900 REALCOMP
- 2013-11-08 Sold (Public Records) $102,000 Public Records
- 2013-11-05 Sold (MLS) $102,000 REALCOMP
- 2013-11-05 Sold (MLS) $102,000 SW Michigan MLS
- 2013-04-29 Listed $110,000 REALCOMP
- 2013-04-29 Listed $110,000 SW Michigan MLS
- 1996-03-27 Sold (MLS) $82,000 REALCOMP
- 1996-03-27 Sold (MLS) $82,000 SW Michigan MLS
- 1996-02-24 Listed $84,900 REALCOMP
- 1996-02-24 Listed $84,900 SW Michigan MLS
- 1993-12-23 Listing Removed — SW Michigan MLS
- 1993-10-20 Listed $79,900 SW Michigan MLS
- 1993-10-20 Listed $79,900 REALCOMP
- 1986-07-03 Listed $55,000 REALCOMP
- 1986-07-03 Listed $55,000 SW Michigan MLS
Property tax history
+11.7%/yrLatest (2025): $3,596 · +2.4% YoY. Source: county tax records.
Cash-flow waterfall
monthlySold comps — $/sqft
last 12 mo · ≤1 miLoading sold comps…