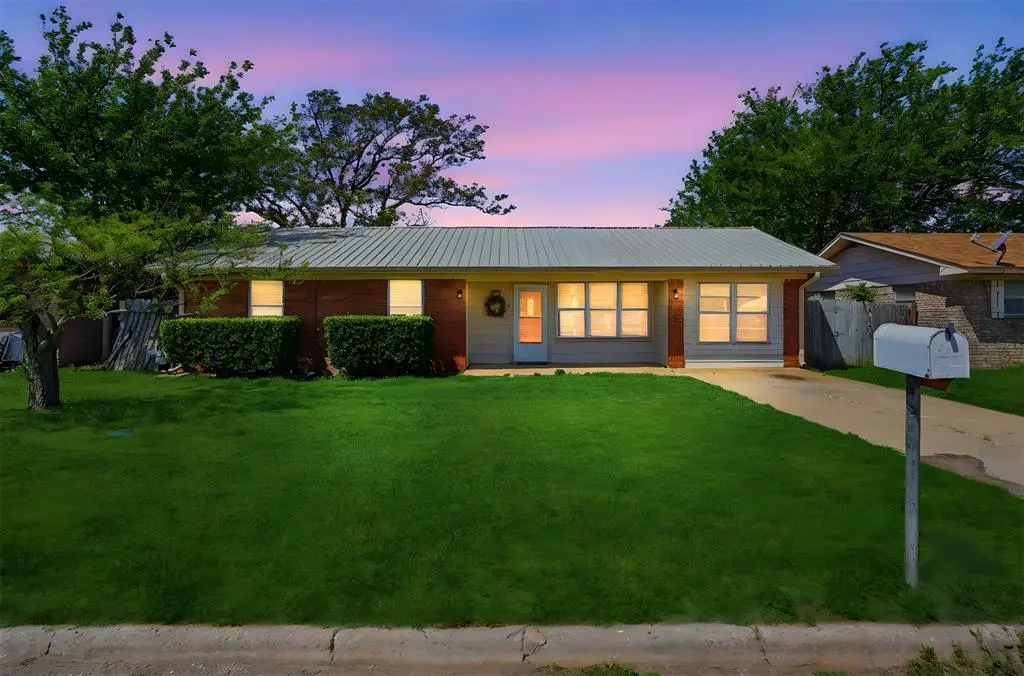
1511 D St · Snyder, OK
Flood risk 1/10 · Minimal
- FEMA flood zone
- X (unshaded)
- Chance of flooding over 30 yrs
- 0.0%
- Est. flood insurance / yr
- $507 – $1,088
Fire risk 5/10 · Moderate
- Est. fire insurance / yr
- $2,463 – $4,575
Heat risk 6/10 · Moderate
- Hot days now (above 108°F)
- 7 days/yr
- Hot days in 30 yrs
- 19 days/yr
Wind risk 3/10 · Minor
- Chance of severe wind over 30 yrs
- 6.0%
Air-quality risk 1/10 · Minimal
- Unhealthy air days now
- 0 days/yr
- Unhealthy air days in 30 yrs
- 0 days/yr
Risk factors via First Street. Map © Google.
Why this score? — see what drove the B+ grade
The composite is a weighted blend of 9 inputs, each scored 0–100. Each bar is that input's sub-score; the figure is the points it added to the 100-point composite (weight × sub-score).
- Cash flow +30.0/30.0
- ARV discount +15.0/15.0
- 1% rule +10.0/10.0
- DSCR +10.0/10.0
- Appreciation +5.0/10.0
- Livability +3.0/5.0
- Rent growth +2.5/5.0
- Condition / age +2.5/5.0
- Schools +1.8/10.0
$87,000
🖨 Deal sheet 📄 Offer letter ✓ Due diligence
Listing remarks
Great layout and plenty of potential! This 3 bedroom, 1 1/2 bathroom brick home offers an open concept design with a spacious living room, dining area, and kitchen—perfect for everyday living and entertaining. The living room features a free-standing fireplace (flue will need to be attached for proper use), adding character and a focal point to the space. The kitchen comes equipped with a refrigerator, dishwasher, gas stove, and microwave. All bedrooms have new carpet and have been freshly painted, giving the home a clean, updated feel. Step outside to a large backyard with a privacy fence. The oversized screened-in back patio provides additional living space and includes a convenient
Key facts
- Durable metal roof
- Large backyard
- Open concept design
Tags
Property features AI
Finance
- Other: Interior lot
- Financial info: Loan qualifying available; Not assumable
- HOA & community: No mandatory association dues
Exterior
- Utilities: Property on standard utilities
- Home design: Single family residence; One-level home; Residential property; Located in Hillcrest addition
- Construction: Brick construction; Composition roof; Slab foundation; Existing property
- Exterior features: Covered porch; Rain gutters; Storage
Interior
- Kitchen: Gas range; Dishwasher; Microwave; Refrigerator
- Bedrooms: 3 bedrooms
- Flooring: Carpet; Laminate
- Bathrooms: 1 full bath; 1 half bath
- Interior features: Ceiling fan(s); Free standing fireplace; Inside utility
- Laundry & utility: Washer and dryer included; Inside utility
Neighborhood map
What this means for you Summary
Snapshot
- This is a 4-bed/2.0-bath single-family listed at $87k.
Deal economics
- At list price, monthly cash flow is $511 ($6k/yr) — positive.
- The deal already cash-flows at list — no discount required.
- Meets the 1% rule at list price ($1k rent vs $87k).
Location & tenants
- Location reads 59/100 on livability (#397 in OK) — a working-class tenant base; expect higher turnover. Strengths: cost of living A+, housing A+; Watch: amenities F, commute F, employment F.
- Snyder (rural): math 15% / reading 21% proficiency, ranked #446 of 513 in OK (top 87%) — low school quality limits family demand, transient renter base, plan for 1-2y turnover; 62% free/reduced lunch — lower-income household profile, screen leases tightly.
- Zoned schools: John D Moeller Es (140 students, 0% FRL); Snyder Hs (math 5% / reading 10%, grade F, #420 of 447 statewide, top 95%, 133 students, 0% FRL) — zoned schools average 0% FRL vs 62% district-wide (62 pts lower); this property's tenant base skews higher-income than the district average.
- Market conditions: 9 active listings in the ZIP.
Forward outlook
- In year one you build about $3k of equity ($601 loan paydown + $3k appreciation (3.0% local appreciation)).
- At projected returns (3.0% appreciation + 3.0% rent growth), your $24k cash investment doubles in ~3 years — after that, you're playing with house money.
- By year 10, paydown + projected appreciation supports a ~$31k cash-out refi (75% LTV) — recoverable capital for the next deal without selling this one.
Negotiation context
- Only 14 days on market — expect competitive offers; lowballing is unlikely to land.
Risks & watch-outs
- Climate carrying-cost: moderate wildfire risk; extreme-heat days projected 7→19/yr by 2055 (HVAC capex compounding) — expect insurance premiums to compound above CPI over the hold.
Questions for the listing agent
- Built in 1972 — when were the roof, HVAC, electrical panel, plumbing, and water heater last replaced?
- Is there a deadline driving the sale (1031 exchange, divorce, estate, relocation)? That informs how much negotiation room exists.
- Schools are F-rated, which usually means shorter tenancies and higher turnover. Who's the typical renter profile here, and what's been the actual vacancy rate?
- What's the average days-on-market for RENTAL listings here right now (not sales)? A rising rental-DOM trend means longer vacancies and softer asking-rent achievability than the comps imply.
- What's the recent tenant-quality profile in this submarket — average credit score on applications, eviction rate, late-payment / NSF rate, and stable-employment percentage? A property-management company in the area should have these aggregated.
- How much new for-sale + rental construction is in the pipeline within 1–3 miles? Heavy new supply typically softens prices + rents 12–24 months out; constrained supply supports both.
Investment metrics
- 1% rule
- 1.50% ✓
- Cap rate
- 13.34%
- Cash-on-cash
- 25.16%
- DSCR
- 2.12
- GRM
- 5.6
CMA / ARV
- ARV (on-the-fly)
- $154,504
- Comps found
- 6
Show comp detail 6 sales within ~0.75 mi
| Address | Dist | Beds/Ba | Sqft | Sold | Price | $/sf | Match |
|---|---|---|---|---|---|---|---|
| 1503 B St | 0.13mi | 3/2.5 (-1) | 1,700 (-2%) | 4mo | $54,000 | $32 | 80 |
| 1421 B St | 0.14mi | 3/2.0 (-1) | 1,525 (-12%) | 8mo | $135,000 | $89 | 62 |
| 104 W 12th St | 0.35mi | 3/1.5 (-1) | 1,671 (-4%) | 12mo | $149,000 | $89 | 60 |
| 103 Western Sunset Trl | 0.48mi | 3/2.0 (-1) | 1,537 (-12%) | 4mo | $162,500 | $106 | 50 |
| 604 8th St | 0.60mi | 4/1.5 | 1,914 (+10%) | 4mo | $89,000 | $46 | 50 |
| 1001 H St | 0.50mi | 3/2.0 (-1) | 1,632 (-6%) | 16mo | $112,000 | $69 | 48 |
Match score weights: distance 35% · size 25% · config 20% · recency 20%. Top-matched comps best support the ARV.
Projected returns pro-forma
3.0% appreciation · 3.0% rent growth · sell at horizon
- IRR
- 31.2%
- Equity multiple
- 2.76×
- Total profit
- $42,981
- Equity at exit
- $39,119
- IRR
- 31.5%
- Equity multiple
- 5.41×
- Total profit
- $107,387
- Equity at exit
- $60,287
Cash invested: $24,360 (down + closing). Projections, not guarantees.
Landlord ↔ Tenant lean methodology
- Overall (STATE)
- 83 Strongly Landlord-Friendly
- State Oklahoma
- 83 Strongly Landlord-Friendly · R+20
- County
- — inherits STATE
- City
- — inherits STATE
ZIP-level market 73566
- Active inventory
- 9
- Price-to-rent
- 5.6×
Monthly cashflow live
- Estimated rent
- $1,302 medium interval (Pro) →
- Mortgage (P&I)
- −$456
- Tax from tax record
- −$25 /mo · $304/yr
- Insurance
- −$36
- HOA
- −$0
- Vacancy / Maint / Mgmt
- −$273
- Net cashflow
- $511
Break-even live
UW: 25.0% down · 7.5% · 30yr · 1.5% tax · 5.0% vac · 8.0% maint · 8.0% mgmt
Financing live
Cash to close
- Down payment
- $21,750
- Closing costs
- $2,610
- Reserves months
- —
- Total cash needed
- —
Loan-product check · same deal, 3 products live
Conventional
25% down · 7.5% · 30yr
- Down + closing
- —
- Monthly P&I
- —
- Monthly cashflow
- —
- DSCR
- —
- Eligible?
- —
Personal DTI + credit; lowest rate.
DSCR
20% down · 8.5% · 30yr
- Down + closing
- —
- Monthly P&I
- —
- Monthly cashflow
- —
- DSCR
- —
- Eligible?
- —
No personal income docs; deal must DSCR.
Hard money
10% down · 12.0% · 12mo
- Down + closing
- —
- Monthly P&I
- —
- Monthly cashflow
- —
- DSCR
- —
- Eligible?
- —
Short-term bridge; refi at stabilization.
Listing history 2 events
-
2026-04-29status Pending
-
2026-04-14$87,000 Active
ⓘ Source: listings_history table (triggers on properties + properties_extension) + one-shot
backfill from property_details.listing_events for pre-trigger history.
Tax reassessment forecast OK · Resets to sale price
- Current annual tax
- $304 · $25/mo
- Projected year-2 tax
- $783 · $65/mo
- Expected delta
- +$479/yr (+$40/mo · 157.6%)
ⓘ Screening estimate from a state-policy table — verify with the county assessor before closing.
Climate risk First Street
- Flood 1/10 Low FEMA zone X (unshaded) · 0% chance over 30 yrs
- Wildfire 5/10 Major
- Heat 6/10 Major 7 d/yr ≥108°F today · 19 d/yr by 30 yrs out
- Wind 3/10 Moderate 6% chance of damaging wind over 30 yrs
- Air quality 1/10 Low 0 unhealthy d/yr today · 0 by 30 yrs out
Nearby sold comps map
Loading sold comps map…
Walkable amenities ~0.75 mi
Loading nearby amenities…
Taxation est. · year 1
- Rental income
- $15,624
- − Mortgage interest
- −$4,873
- − Property taxes
- −$304
- − Insurance
- −$435
- − Repairs & maintenance
- −$1,250
- − Management
- −$1,250
- − Depreciation
- −$2,531
- Taxable income
- $4,981
- Est. tax owed @ 24.0%
- −$1,196
- After-tax cash flow
- $4,934/yr
For passive investors: Depreciation is non-cash, so a rental often shows a tax loss while cash-flowing — sheltering income. Rental losses are passive: they offset passive income freely, and up to $25,000/yr can offset ordinary (W-2) income if you actively participate and your MAGI is under $100k (phasing out to $0 by $150k); unused losses carry forward. On sale, claimed depreciation is recaptured at up to 25%, and gains may owe capital-gains tax (a 1031 exchange can defer both). Figures are a year-1 estimate at your 24.0% rate — not tax advice; consult a CPA.
Schools (NCES district)
- District
- Snyder
- NCES district ID
- 4027930
- Math proficiency
- 15% ▲ 1.00%
- Reading proficiency
- 21% ▲ 3.00%
- Median HH income
- $32,783
- Composite
- 17.93/100
- National rank
- #14099
- State rank
- #446 of 513 in OK
Livability — Snyder
- Score
- 59/100
- State rank
- #397
- US rank
- #20273
Category grades
Schools grade is shown separately in the Schools card above.
Census & demographics
- Census place
- Snyder, OK
- Population (ZIP)
- 1,502
Population outlook (Kiowa County) Hauer SSP2
- Today (2025)
- 8,842 people
- By 2030
- 8,733 · -1.2%
- By 2040
- 8,641 · -2.3%
- By 2050
- 8,758 · -1.0%
- By 2075
- 9,894 · +11.9%
- By 2100
- 11,194 · +26.6%
Race, ethnicity, and origin ACS 2023
- Neighborhood character
- Predominantly White (74%)
- Race & ethnicity
- White 74% Hispanic / Latino 16% Two or more races 10% Native American 2% Black 2%
- Hispanic origin (detail)
- Mexican 11%
- Common ancestry
- Slovak 4% Serbian 2% Iranian 2%
- Foreign-born
- 2% · Canada
- Languages at home
- 92% English-only · Spanish 5% German/W. Germanic 1% Other Asian/Pacific 1%
Political lean MEDSL · Kiowa
- 2024 margin
- Solid R (+58.3) · D 20.1% · R 78.4% · Other 1.6%
- 2008→2024 swing
- -23.5pp toward R · 2008: -34.8pp · 2024: -58.3pp
- All cycles
- 2024: R+58.3 2020: R+57.6 2016: R+52.4 2012: R+35.4 2008: R+34.8
Not yet ingested
- Civics
- —
Market trends
- HPI YoY
- —
- Current HPI
- —
- Rent YoY
- —
- Metro
- —
- State GDP YoY
- ▲ 1.55%
- F500 in state
- 6
Industry mix (Fortune 500 HQ in OK)
| Industry | F500 HQs | Revenue |
|---|---|---|
| Energy | 3 | $48B |
|
||
Price history
2 events — show timeline
- 2026-04-29 Pending — MLSOK
- 2026-04-14 Listed $87,000 MLSOK
Property tax history
-1.3%/yrLatest (2025): $304 · -2.6% YoY. Source: county tax records.
Cash-flow waterfall
monthlySold comps — $/sqft
last 12 mo · ≤1 miLoading sold comps…