355 Gentlemen Pl · Cloverdale, IN
Flood risk 1/10 · Minimal
- FEMA flood zone
- X (unshaded)
- Chance of flooding over 30 yrs
- 0.0%
- Est. flood insurance / yr
- $507 – $1,088
Fire risk 2/10 · Minimal
- Est. fire insurance / yr
- $717 – $1,331
Heat risk 4/10 · Minor
- Hot days now (above 103°F)
- 7 days/yr
- Hot days in 30 yrs
- 18 days/yr
Wind risk 2/10 · Minimal
- Chance of severe wind over 30 yrs
- 1.0%
Air-quality risk 3/10 · Minor
- Unhealthy air days now
- 2 days/yr
- Unhealthy air days in 30 yrs
- 3 days/yr
Risk factors via First Street. Map © Google.
Why this score? — see what drove the C+ grade
The composite is a weighted blend of 9 inputs, each scored 0–100. Each bar is that input's sub-score; the figure is the points it added to the 100-point composite (weight × sub-score).
- Cash flow +20.6/30.0
- ARV discount +15.0/15.0
- DSCR +6.6/10.0
- 1% rule +5.8/10.0
- Appreciation +4.4/10.0
- Livability +3.5/5.0
- Schools +3.2/10.0
- Rent growth +2.5/5.0
- Condition / age +2.5/5.0
$104,995
🖨 Deal sheet 📄 Offer letter ✓ Due diligence
Listing remarks
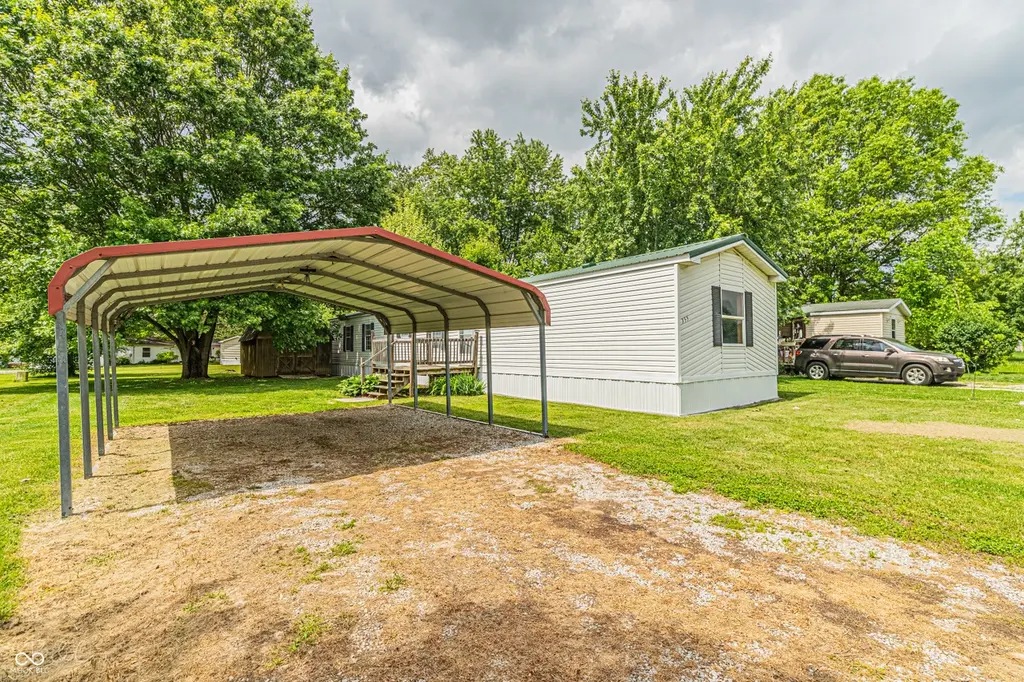
Tucked away at the end of a quiet cul-de-sac, this beautifully updated 3 bedroom, 2 full bath manufactured home offers incredible value at an affordable price! Pride of ownership shines throughout with a clean, well-maintained interior and numerous updates that make this home truly move-in ready. Enjoy a functional layout with spacious living areas, comfortable bedrooms, and a welcoming atmosphere perfect for everyday living. Outside, you'll love the oversized storage barn offering plenty of room for tools, hobbies, lawn equipment, or extra storage. Located in a peaceful neighborhood with minimal traffic, this home combines affordability, comfort, and convenience all in one package. Don't m
Key facts
- Access to lakes
- In-ground pool
- Clubhouse
Tags
Property features AI
Finance
- Other: Ownership interest: Mandatory fee
- HOA & community: Homeowners association with annual fee of $280; Community amenities include clubhouse, pool, playground, basketball court, and snow removal
Exterior
- Parking: Carport
- Utilities: Public water; Municipal sewer connected; No solid waste service listed
- Home design: Manufactured home; Updated/remodeled condition; One level
- Construction: Vinyl siding; Block foundation
- Exterior features: Lot in a cul-de-sac; Rural subdivision setting; Mature trees; Lot approximately 0.17 acre
Interior
- Kitchen: Electric cooktop; Electric oven; Refrigerator; Breakfast bar adjacent to kitchen
- Bedrooms: 3 bedrooms (all on the main level)
- Bathrooms: 2 full bathrooms (both on the main level)
- Heating & cooling: Electric forced-air heating; Central air conditioning
- Interior features: Breakfast bar; Total of 6 rooms
- Laundry & utility: Electric water heater
Neighborhood map
What this means for you Summary
Snapshot
- This is a 3-bed/2.0-bath manufactured listed at $105k.
Deal economics
- At list price, monthly cash flow is $141 ($2k/yr) — positive.
- The deal already cash-flows at list — no discount required.
- Meets the 1% rule at list price ($1k rent vs $105k).
- Recommended offer: $102k (3.0% below list) — sets the bar for market timing.
- Cap rate 7.9% vs local median 3.5% in Cloverdale — top-decile yield for the area; either an underpriced asset or a hidden risk that comps aren't pricing in. Stress-test before assuming the spread holds.
Location & tenants
- Location reads 70/100 on livability (#156 in IN) — a middle-class / working-renter tenant base. Strengths: crime A+, cost of living A+, housing A+; Watch: schools C-, amenities F, commute F.
- Cloverdale Community Schools (rural): math 36% / reading 40% proficiency, ranked #167 of 301 in IN (top 56%) — families likely to look elsewhere, expect single-tenant / working-renter base with shorter leases.
- Market conditions: 65 active listings in the ZIP; 166 units permitted in Putnam County in 2024 (0 in 5+ unit buildings).
Forward outlook
- Local home prices are declining (-1.2%/yr); year-one equity from $726 of loan paydown is wiped out by about $1k of value loss. Plan a longer hold.
- Putnam County population projected to shrink 8% by 2050 — rents likely to lag national; underwrite the cash flow, not the appreciation.
Negotiation context
- It's been on market 41 days — a 3% lower offer ($102k) is reasonable based on typical stale-listing flexibility.
- 2 sale attempts since 13y ago; this cycle's ask has dropped $35k (25%) from the opening price — seller is motivated, your offer sets the floor, not the list.
Questions for the listing agent
- It's been on market 41 days. Have you received any prior offers? Is the seller open to a 3% concession, seller financing, or rate buy-down credit?
- What does the HOA fee cover, when was the last increase, and are there any pending special assessments or reserve-fund shortfalls?
- Is there a deadline driving the sale (1031 exchange, divorce, estate, relocation)? That informs how much negotiation room exists.
- What's the average days-on-market for RENTAL listings here right now (not sales)? A rising rental-DOM trend means longer vacancies and softer asking-rent achievability than the comps imply.
- What's the recent tenant-quality profile in this submarket — average credit score on applications, eviction rate, late-payment / NSF rate, and stable-employment percentage? A property-management company in the area should have these aggregated.
- How much new for-sale + rental construction is in the pipeline within 1–3 miles? Heavy new supply typically softens prices + rents 12–24 months out; constrained supply supports both.
Investment metrics
- 1% rule
- 1.08% ✓
- Cap rate
- 7.90%
- Cash-on-cash
- 5.74%
- DSCR
- 1.26
- GRM
- 7.7
CMA / ARV
- ARV (median comp)
- $127,500
- List price
- $104,995
- Delta
- -17.65%
- Verdict
- UNDERPRICED
- Comps
- 16 within 1.0 mi
Show comp detail 12 sales within ~0.75 mi
| Address | Dist | Beds/Ba | Sqft | Sold | Price | $/sf | Match |
|---|---|---|---|---|---|---|---|
| 125 Oriole Ct | 0.12mi | 3/1.0 | 1,216 (0%) | 2mo | $142,900 | $118 | 89 |
| 157 Lazy River Rd | 0.13mi | 2/2.0 (-1) | 1,216 (0%) | 0mo | $130,000 | $107 | 89 |
| 384 Cool Evening Ct | 0.11mi | 3/2.0 | 1,232 (+1%) | 6mo | $92,000 | $75 | 87 |
| 334 Small Fry Ave | 0.15mi | 3/2.0 | 1,188 (-2%) | 6mo | $172,900 | $146 | 84 |
| 94 Small Fry Ave | 0.19mi | 2/2.0 (-1) | 1,216 (0%) | 4mo | $125,000 | $103 | 83 |
| 597 Lazy River Rd | 0.14mi | 3/2.0 | 1,188 (-2%) | 9mo | $165,000 | $139 | 82 |
| 289 Bubble Loo Rd | 0.23mi | 3/2.0 | 1,216 (0%) | 14mo | $157,000 | $129 | 78 |
| 362 Gentlemen Pl | 0.03mi | 3/2.0 | 1,140 (-6%) | 18mo | $102,600 | $90 | 73 |
| 261 Down Boy Way | 0.22mi | 2/2.0 (-1) | 1,104 (-9%) | 5mo | $142,000 | $129 | 65 |
| 179 Lazy River Ct | 0.25mi | 2/1.5 (-1) | 1,152 (-5%) | 11mo | $139,900 | $121 | 63 |
| 288 Bubble Loo Rd | 0.23mi | 3/2.0 | 1,064 (-12%) | 11mo | $79,900 | $75 | 59 |
| 443 Stardust Way | 0.32mi | 3/2.0 | 1,323 (+9%) | 15mo | $150,000 | $113 | 58 |
Match score weights: distance 35% · size 25% · config 20% · recency 20%. Top-matched comps best support the ARV.
Projected returns pro-forma
-1.22% appreciation · 3.0% rent growth · sell at horizon
- IRR
- 0.0%
- Equity multiple
- 1.00×
- Total profit
- $57
- Equity at exit
- $24,249
- IRR
- 7.0%
- Equity multiple
- 1.65×
- Total profit
- $19,233
- Equity at exit
- $24,542
Cash invested: $29,399 (down + closing). Projections, not guarantees.
Landlord ↔ Tenant lean methodology
- Overall (STATE)
- 90 Strongly Landlord-Friendly
- State Indiana
- 90 Strongly Landlord-Friendly · R+11
- County
- — inherits STATE
- City
- — inherits STATE
ZIP-level market 46120
- Home prices YoY
- -0.5%
- Active inventory
- 65
- Price-to-rent
- 7.7×
Monthly cashflow live
- Estimated rent
- $1,137 medium interval (Pro) →
- Mortgage (P&I)
- −$551
- Tax from tax record
- −$140 /mo · $1,684/yr
- Insurance
- −$44
- HOA
- −$23
- Vacancy / Maint / Mgmt
- −$239
- Net cashflow
- $141
Break-even live
UW: 25.0% down · 7.5% · 30yr · 1.5% tax · 5.0% vac · 8.0% maint · 8.0% mgmt
Financing live
Cash to close
- Down payment
- $26,249
- Closing costs
- $3,150
- Reserves months
- —
- Total cash needed
- —
Loan-product check · same deal, 3 products live
Conventional
25% down · 7.5% · 30yr
- Down + closing
- —
- Monthly P&I
- —
- Monthly cashflow
- —
- DSCR
- —
- Eligible?
- —
Personal DTI + credit; lowest rate.
DSCR
20% down · 8.5% · 30yr
- Down + closing
- —
- Monthly P&I
- —
- Monthly cashflow
- —
- DSCR
- —
- Eligible?
- —
No personal income docs; deal must DSCR.
Hard money
10% down · 12.0% · 12mo
- Down + closing
- —
- Monthly P&I
- —
- Monthly cashflow
- —
- DSCR
- —
- Eligible?
- —
Short-term bridge; refi at stabilization.
HOA detail
- Monthly dues
- $23 · $276/yr
Listing history 16 events
-
2026-06-18days on market $104,995 Active 41 DOM
-
2026-06-17price $104,995 Active 40 DOM
-
2026-06-17days on market $124,995 Active 40 DOM
-
2026-06-16days on market $124,995 Active 39 DOM
-
2026-06-15days on market $124,995 Active 38 DOM
-
2026-06-13days on market $124,995 Active 36 DOM
-
2026-06-09days on market $124,995 Active 32 DOM
-
2026-06-08days on market $124,995 Active 31 DOM
-
2026-06-07pricedays on market $124,995 Active 30 DOM
-
2026-06-03days on market $134,995 Active 26 DOM
-
2026-06-02days on market $134,995 Active 25 DOM
-
2026-06-01days on market $134,995 Active 24 DOM
-
2026-05-31days on market $134,995 Active 23 DOM
-
2026-05-08$140,000 Active 1270-char remark
-
2014-01-06historical
-
2013-07-22$49,900
ⓘ Source: listings_history table (triggers on properties + properties_extension) + one-shot
backfill from property_details.listing_events for pre-trigger history.
Tax reassessment forecast IN · Partial reset (capped growth)
- Current annual tax
- $1,684 · $140/mo
- Projected year-2 tax
- $1,684 · $140/mo
- Expected delta
- $0/yr ($0/mo · -0.0%)
ⓘ Screening estimate from a state-policy table — verify with the county assessor before closing.
Climate risk First Street
- Flood 1/10 Low FEMA zone X (unshaded) · 0% chance over 30 yrs
- Wildfire 2/10 Low
- Heat 4/10 Moderate 7 d/yr ≥103°F today · 18 d/yr by 30 yrs out
- Wind 2/10 Low 100% chance of damaging wind over 30 yrs
- Air quality 3/10 Moderate 2 unhealthy d/yr today · 3 by 30 yrs out
Nearby sold comps map
Loading sold comps map…
Walkable amenities ~0.75 mi
Loading nearby amenities…
Taxation est. · year 1
- Rental income
- $13,645
- − Mortgage interest
- −$5,881
- − Property taxes
- −$1,684
- − Insurance
- −$525
- − Repairs & maintenance
- −$1,092
- − Management
- −$1,092
- − HOA
- −$276
- − Depreciation
- −$3,054
- Taxable income
- $41
- Est. tax owed @ 24.0%
- −$10
- After-tax cash flow
- $1,677/yr
For passive investors: Depreciation is non-cash, so a rental often shows a tax loss while cash-flowing — sheltering income. Rental losses are passive: they offset passive income freely, and up to $25,000/yr can offset ordinary (W-2) income if you actively participate and your MAGI is under $100k (phasing out to $0 by $150k); unused losses carry forward. On sale, claimed depreciation is recaptured at up to 25%, and gains may owe capital-gains tax (a 1031 exchange can defer both). Figures are a year-1 estimate at your 24.0% rate — not tax advice; consult a CPA.
Schools (NCES district)
- District
- Cloverdale Community Schools
- NCES district ID
- 1802220
- Math proficiency
- 36% ▼ -16.00%
- Reading proficiency
- 40% ▼ -14.00%
- Median HH income
- $44,267
- Composite
- 32.28/100
- National rank
- #5753
- State rank
- #167 of 301 in IN
Livability — Cloverdale
- Score
- 70/100
- State rank
- #156
- US rank
- #7715
Category grades
Schools grade is shown separately in the Schools card above.
Census & demographics
- Census place
- Cloverdale, IN
- City population
- 6,138
- Population (ZIP)
- 6,138
Population outlook (Putnam County) Hauer SSP2
- Today (2025)
- 37,226 people
- By 2030
- 36,723 · -1.4%
- By 2040
- 35,407 · -4.9%
- By 2050
- 34,177 · -8.2%
- By 2075
- 32,038 · -13.9%
- By 2100
- 28,380 · -23.8%
Race, ethnicity, and origin ACS 2023
- Neighborhood character
- Predominantly White (97%)
- Race & ethnicity
- White 97% Two or more races 1% Black 1%
- Common ancestry
- Slovak 3% Lithuanian 2% Iranian 2%
- Foreign-born
- 1%
- Languages at home
- 99% English-only · Spanish 1%
Political lean MEDSL · Putnam
- 2024 margin
- Solid R (+52.0) · D 23.1% · R 75.1% · Other 1.8%
- 2008→2024 swing
- -40.0pp toward R · 2008: -12.0pp · 2024: -52.0pp
- All cycles
- 2024: R+52.0 2020: R+50.2 2016: R+49.6 2012: R+32.6 2008: R+12.0
Not yet ingested
- Civics
- —
Market trends
- HPI YoY
- ▼ -1.22%
- Current HPI
- 235.6828
- Rent YoY
- —
- Metro
- —
- State GDP YoY
- ▲ 2.90%
- F500 in state
- 18
Industry mix (Fortune 500 HQ in IN)
| Industry | F500 HQs | Revenue |
|---|---|---|
| Industrial Machinery | 2 | $37B |
|
||
| Healthcare | 1 | $177B |
|
||
| Pharmaceuticals | 1 | $45B |
|
||
| Metals / Steel | 1 | $18B |
|
||
| Agriculture | 1 | $17B |
|
||
| Packaging | 1 | $12B |
|
||
Price history
+110.4% since first listed6 events — show timeline
- 2026-06-17 Price Changed $104,995 MIBOR as Distributed by MLS Grid
- 2026-06-03 Price Changed $124,995 MIBOR as Distributed by MLS Grid
- 2026-05-20 Price Changed $134,995 MIBOR as Distributed by MLS Grid
- 2026-05-08 Listed $140,000 MIBOR as Distributed by MLS Grid
- 2014-01-06 Listing Removed — MIBOR as Distributed by MLS Grid
- 2013-07-22 Listed $49,900 MIBOR as Distributed by MLS Grid
Property tax history
+6.2%/yrLatest (2024): $1,684 · +118.9% YoY. Source: county tax records.
Cash-flow waterfall
monthlySold comps — $/sqft
last 12 mo · ≤1 miLoading sold comps…