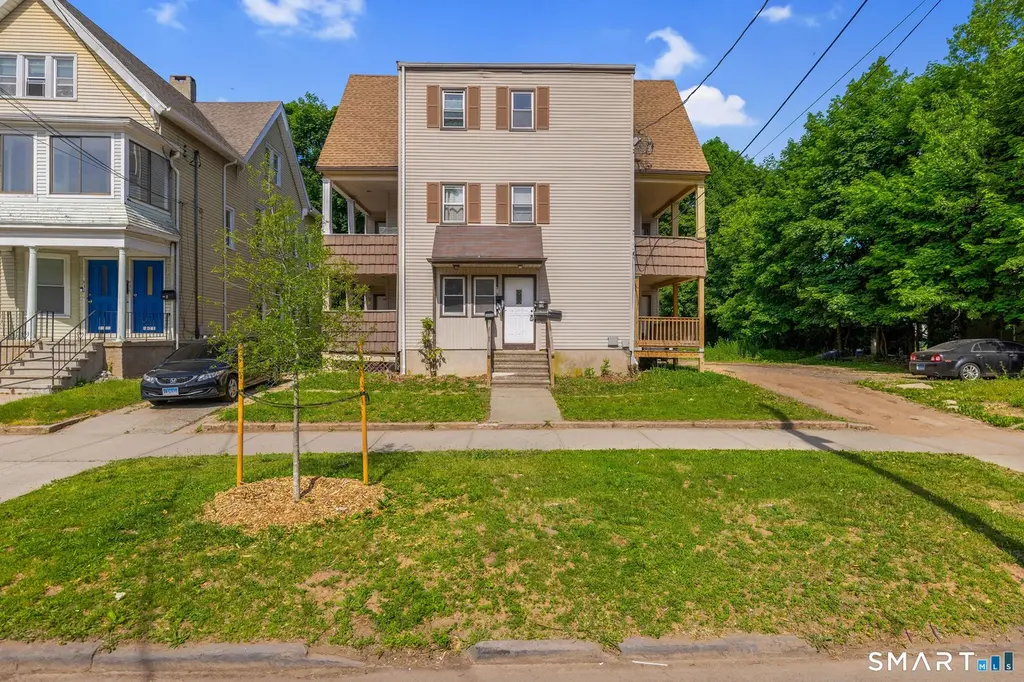
 Fourplex
440 Dixwell Ave · New Haven, CT
Flood risk 1/10 · Minimal
- FEMA flood zone
- X (unshaded)
- Chance of flooding over 30 yrs
- 0.0%
- Est. flood insurance / yr
- $473 – $860
Fire risk 1/10 · Minimal
- Est. fire insurance / yr
- $829 – $1,539
Heat risk 7/10 · Major
- Hot days now (above 99°F)
- 7 days/yr
- Hot days in 30 yrs
- 16 days/yr
Wind risk 6/10 · Moderate
- Chance of severe wind over 30 yrs
- 53.0%
Air-quality risk 5/10 · Moderate
- Unhealthy air days now
- 6 days/yr
- Unhealthy air days in 30 yrs
- 8 days/yr
Risk factors via First Street. Map © Google.
Why this score? — see what drove the C+ grade
The composite is a weighted blend of 9 inputs, each scored 0–100. Each bar is that input's sub-score; the figure is the points it added to the 100-point composite (weight × sub-score).
- Cash flow +27.4/30.0
- DSCR +9.6/10.0
- 1% rule +7.6/10.0
- ARV discount +7.5/15.0
- Livability +4.0/5.0
- Rent growth +3.2/5.0
- Condition / age +2.5/5.0
- Schools +1.5/10.0
- Appreciation +0.0/10.0
$799,999
🖨 Deal sheet (PDF) 📄 Offer letter ✓ Due diligence
Multi-family units
County records classify this as Multi-Family (5+ Unit). Listing-text estimate: 4 units. estimate disagrees with records
5+ unit building — per-unit beds/baths from public records are typically unavailable; the breakdown below (if shown) is an estimate from the listing text.
Listing remarks MLS
Investors take notice or homeowners looking to have their mortgage paid by income coming in! Rare, 4 family offers approx. 6,300 sq ft FULLY RENTED OUT. Sold as is, inspection for informational purposes. Close to Yale University, Yale Hospital, and downtown New Haven. ** see additional remarks ** Access to all units !!! Will be Monday the 28th between 5 and 7 - please reach out for a showing during those times !
Key facts
- Multifamily property
- Access to yale
- 0.23 acre lot
Tags
Property features AI
Exterior
- Utilities: Public water connected; Public sewer connected; Natural gas
- Home design: Multi-family property (4-family)
- Construction: Frame construction; Brick and stone foundation
- Exterior features: Vinyl siding; Asphalt shingle and flat roofing
Interior
- Bedrooms: 14 total bedrooms
- Bathrooms: 4 full bathrooms
- Heating & cooling: Hot water heating; Natural gas hot water (40 gallon tank)
- Interior features: Full, partially finished shared basement with storage
- Laundry & utility: Basement common area laundry with basement hook-ups
Neighborhood map
What this means for you Summary
Snapshot
- This is a 4 × 4-bed/1.0-bath units multifamily listed at $800k.
Deal economics
- At list price, monthly cash flow is $2k ($28k/yr) — positive. Per door: $583/mo.
- The deal already cash-flows at list — no discount required.
- Meets the 1% rule at list price ($10k rent vs $800k).
- Cap rate 9.8% vs local median 4.8% in New Haven — top-decile yield for the area; either an underpriced asset or a hidden risk that comps aren't pricing in. Stress-test before assuming the spread holds.
Location & tenants
- Location reads 79/100 on livability (#31 in CT, #2,190 nationally) — a middle-class / working-renter tenant base. Strengths: amenities A+, commute A+, health & safety A+; Watch: employment D, crime F.
- New Haven School District (urban): math 12% / reading 25% proficiency, ranked #147 of 153 in CT (top 96%) — low school quality limits family demand, transient renter base, plan for 1-2y turnover; 66% free/reduced lunch — lower-income household profile, screen leases tightly.
- Zoned schools: Beecher School (math 12% / reading 30%, grade F, #441 of 553 statewide, top 80%, 480 students, 72% FRL); James Hillhouse High School (math 2% / reading 12%, grade F, #188 of 194 statewide, top 98%, 1,139 students, 79% FRL).
- Market conditions: Rents rising (+2.6%/yr); 137 active listings in the ZIP; 1,059 units permitted in South Central Connecticut Planning Region in 2024 (779 in 5+ unit buildings).
- At $10,117/mo this rent would consume 202% of the median local household income ($60k/yr) (locally 4999% of renters already pay >50% of income on rent) — very limited rent-growth headroom before tenants either downsize or default.
Forward outlook
- Local home prices are declining (-3.0%/yr); year-one equity from $6k of loan paydown is wiped out by about $24k of value loss. Plan a longer hold.
- At projected returns (-3.0% appreciation + 2.6% rent growth), your $224k cash investment doubles in ~10 years — after that, you're playing with house money.
Negotiation context
- Only 10 days on market — expect competitive offers; lowballing is unlikely to land.
- 7 sale attempts since 21y ago with the ask held roughly flat each time — persistent listings suggest the price (not the market) is what's stuck; bring a comps-based counter.
- Current owner paid $535k; 50% above their basis — modest negotiation headroom, anchor on the comps not their cost.
Risks & watch-outs
- Watch-outs: built in 1906 — expect roof / HVAC / electrical / plumbing capex.
- Climate carrying-cost: major wind risk, 53% chance of damaging wind over 30y; extreme-heat days projected 7→16/yr by 2055 (HVAC capex compounding) — expect insurance premiums to compound above CPI over the hold.
Questions for the listing agent
- Can we see the unit-by-unit rent roll, current vacancy, and any below-market leases? What's the average tenancy length?
- What capital expenditures (roof, boiler, parking lot, exteriors) have been made in the last 5 years, and what's planned in the next 2?
- Built in 1906 — when were the roof, HVAC, electrical panel, plumbing, and water heater last replaced?
- Is there a deadline driving the sale (1031 exchange, divorce, estate, relocation)? That informs how much negotiation room exists.
- Schools are D-rated, which usually means shorter tenancies and higher turnover. Who's the typical renter profile here, and what's been the actual vacancy rate?
- Crime grade is F in this area — have there been break-ins, vandalism, or insurance claims at this property in the last 3 years? What carrier currently insures it and at what premium?
- What's the average days-on-market for RENTAL listings here right now (not sales)? A rising rental-DOM trend means longer vacancies and softer asking-rent achievability than the comps imply.
- What's the recent tenant-quality profile in this submarket — average credit score on applications, eviction rate, late-payment / NSF rate, and stable-employment percentage? A property-management company in the area should have these aggregated.
- How much new apartment / multifamily construction is in the pipeline within 1–3 miles? Heavy new supply (>2% of stock underway) typically softens rents 12–24 months out; light construction supports rent growth.
Investment metrics
- 1% rule
- 1.26% ✓
- Cap rate
- 9.79%
- Cash-on-cash
- 12.50%
- DSCR
- 1.56
- GRM
- 6.6
CMA / ARV
- ARV (on-the-fly)
- $447,300
- Comps found
- 1
Show comp detail 1 sale within ~0.75 mi
| Address | Dist | Beds/Ba | Sqft | Sold | Price | $/sf | Match |
|---|---|---|---|---|---|---|---|
| 383 Shelton Ave | 0.64mi | 10/5.0 (+1) | 6,464 (+3%) | 17mo | $460,000 | $71 | 47 |
Match score weights: distance 35% · size 25% · config 20% · recency 20%. Top-matched comps best support the ARV.
Projected returns pro-forma
-3.0% appreciation · 2.6% rent growth · sell at horizon
- IRR
- 1.8%
- Equity multiple
- 1.07×
- Total profit
- $15,174
- Equity at exit
- $119,282
- IRR
- 11.0%
- Equity multiple
- 1.84×
- Total profit
- $189,036
- Equity at exit
- $69,169
Cash invested: $224,000 (down + closing). Projections, not guarantees.
Landlord ↔ Tenant lean methodology
- Overall (STATE)
- 27 Tenant-Leaning
- State Connecticut
- 27 Tenant-Leaning · D+7
- County
- — inherits STATE
- City
- — inherits STATE
ZIP-level market 06511
- Home prices YoY
- -20.8%
- Rents YoY
- 2.6%
- Active inventory
- 137
- Price-to-rent
- 26.4×
Monthly cashflow live
- Estimated rent
- $10,117 high interval (Pro) →
- Mortgage (P&I)
- −$4,195
- Tax from tax record
- −$1,130 /mo · $13,562/yr
- Insurance
- −$333
- HOA
- −$0
- Vacancy / Maint / Mgmt
- −$2,125
- Net cashflow
- $2,334
Break-even live
Sensitivity live
| Price | -10% $2,787 | -5% $2,560 | +0% $2,334 | +5% $2,107 | +10% $1,881 |
|---|---|---|---|---|---|
| Rent | -10% $1,534 | -5% $1,934 | +0% $2,334 | +5% $2,733 | +10% $3,133 |
| Rate | -1.0pp $2,737 | -0.5pp $2,537 | base $2,334 | +0.5pp $2,126 | +1.0pp $1,915 |
4-unit breakdown (identical units grouped — click to expand)
| Units | Beds | Baths | Est. rent |
|---|---|---|---|
| 4× units | 4 | 1 | $10,116 |
| #1 | 4 | 1 | $2,529 |
| #2 | 4 | 1 | $2,529 |
| #3 | 4 | 1 | $2,529 |
| #4 | 4 | 1 | $2,529 |
| Total (4 units) | $10,117 | ||
UW: 25.0% down · 7.5% · 30yr · 1.5% tax · 5.0% vac · 8.0% maint · 8.0% mgmt
Financing live
Cash to close
- Down payment
- $200,000
- Closing costs
- $24,000
- Reserves months
- —
- Total cash needed
- —
Loan-product check · same deal, 3 products live
Conventional
25% down · 7.5% · 30yr
- Down + closing
- —
- Monthly P&I
- —
- Monthly cashflow
- —
- DSCR
- —
- Eligible?
- —
Personal DTI + credit; lowest rate.
DSCR
20% down · 8.5% · 30yr
- Down + closing
- —
- Monthly P&I
- —
- Monthly cashflow
- —
- DSCR
- —
- Eligible?
- —
No personal income docs; deal must DSCR.
Hard money
10% down · 12.0% · 12mo
- Down + closing
- —
- Monthly P&I
- —
- Monthly cashflow
- —
- DSCR
- —
- Eligible?
- —
Short-term bridge; refi at stabilization.
Listing history 9 events
-
2026-06-18days on market $799,999 Active 10 DOM
-
2026-06-17days on market $799,999 Active 9 DOM
-
2026-06-16days on market $799,999 Active 8 DOM
-
2026-06-15days on market $799,999 Active 7 DOM
-
2026-06-14days on market $799,999 Active 5 DOM
-
2026-06-13days on market $799,999 Active 4 DOM
-
2026-06-10days on market $799,999 Active 2 DOM
-
2026-06-09remarks 699-char remark
-
2026-06-09$799,999 Active 1 DOM
ⓘ Source: listings_history table (triggers on properties + properties_extension) + one-shot
backfill from property_details.listing_events for pre-trigger history.
Tax reassessment forecast CT · Partial reset (capped growth)
- Current annual tax
- $13,562 · $1,130/mo
- Projected year-2 tax
- $15,341 · $1,278/mo
- Expected delta
- +$1,779/yr (+$148/mo · 13.1%)
ⓘ Screening estimate from a state-policy table — verify with the county assessor before closing.
Climate risk First Street
- Flood 1/10 Low FEMA zone X (unshaded) · 0% chance over 30 yrs
- Wildfire 1/10 Low
- Heat 7/10 Severe 7 d/yr ≥99°F today · 16 d/yr by 30 yrs out
- Wind 6/10 Major 53% chance of damaging wind over 30 yrs
- Air quality 5/10 Major 6 unhealthy d/yr today · 8 by 30 yrs out
Nearby sold comps map
Loading sold comps map…
Walkable amenities ~0.75 mi
Loading nearby amenities…
Taxation est. · year 1
- Rental income
- $121,404
- − Mortgage interest
- −$44,812
- − Property taxes
- −$13,562
- − Insurance
- −$4,000
- − Repairs & maintenance
- −$9,712
- − Management
- −$9,712
- − Depreciation
- −$23,273
- Taxable income
- $16,332
- Est. tax owed @ 24.0%
- −$3,920
- After-tax cash flow
- $24,084/yr
For passive investors: Depreciation is non-cash, so a rental often shows a tax loss while cash-flowing — sheltering income. Rental losses are passive: they offset passive income freely, and up to $25,000/yr can offset ordinary (W-2) income if you actively participate and your MAGI is under $100k (phasing out to $0 by $150k); unused losses carry forward. On sale, claimed depreciation is recaptured at up to 25%, and gains may owe capital-gains tax (a 1031 exchange can defer both). Figures are a year-1 estimate at your 24.0% rate — not tax advice; consult a CPA.
Schools (NCES district)
- District
- New Haven School District
- NCES district ID
- 0902790
- Math proficiency
- 12% ▼ -10.00%
- Reading proficiency
- 25% ▼ -10.00%
- Median HH income
- $38,058
- Composite
- 15.48/100
- National rank
- #9308
- State rank
- #147 of 153 in CT
Livability — New Haven
- Score
- 79/100
- State rank
- #31
- US rank
- #2190
Category grades
Schools grade is shown separately in the Schools card above.
Census & demographics
- Census place
- New Haven, CT
- County
- New Haven County · 688,236 people
- City population
- 132,813
- Metro
- New Haven-Milford, CT
- Population (ZIP)
- 54,730
- Household income
- $59,969
- Rent vs Own
- Severe rent burden
- 4999.0
Population outlook (South Central Connecticut County) Hauer SSP2
- By 2040
- 608,362
Race, ethnicity, and origin ACS 2023
- Neighborhood character
- Highly diverse neighborhood (Simpson 0.73)
- Race & ethnicity
- Black 34% White 32% Hispanic / Latino 21% Two or more races 8% Asian 7%
- Hispanic origin (detail)
- Mexican 4% Puerto Rican 10% Dominican 2%
- Common ancestry
- Romanian 2% Lithuanian 1% Russian 1%
- Foreign-born
- 17% · Canada, China, South Korea
- Languages at home
- 74% English-only · Spanish 15% Chinese 3% Other Indo-European 2%
Political lean MEDSL · South Central Connecticut
- 2024 margin
- Strong D (+20.1) · D 59.0% · R 38.9% · Other 2.1%
- All cycles
- 2024: D+20.1
Not yet ingested
- Civics
- —
Market trends
- HPI YoY
- ▼ -86.05%
- Current HPI
- 328.1353
- Rent YoY
- ▲ 2.60%
- Metro
- New Haven-Milford, CT
- State GDP YoY
- ▲ 1.06%
- F500 in state
- 38
Industry mix (Fortune 500 HQ in CT)
| Industry | F500 HQs | Revenue |
|---|---|---|
| Industrial Machinery | 4 | $38B |
|
||
| Insurance | 3 | $71B |
|
||
| Financial Services | 2 | $25B |
|
||
| Transportation / Logistics | 2 | $18B |
|
||
| Healthcare | 1 | $247B |
|
||
| Telecommunications | 1 | $55B |
|
||
Price history
+73.9% since first listed19 events — show timeline
- 2026-06-08 Listed $799,999 Smart MLS
- 2025-10-28 Rental Removed $1,900 SMARTMLS
- 2025-08-25 Price Changed $1,900 SMARTMLS
- 2025-07-24 Listed for Rent $2,200 SMARTMLS
- 2024-01-16 Sold (MLS) $535,000 Smart MLS
- 2023-09-14 Pending — Smart MLS
- 2023-09-08 Contingent — Smart MLS
- 2023-08-30 Price Changed $535,000 Smart MLS
- 2023-08-14 Listed $560,000 Smart MLS
- 2014-03-18 Sold (Public Records) $130,000 Public Records
- 2014-03-14 Sold (MLS) $114,450 Smart MLS
- 2011-10-08 Listed $150,000 Smart MLS
- 2006-05-30 Sold (Public Records) $430,000 Public Records
- 2006-05-26 Sold (MLS) $430,000 Smart MLS
- 2006-04-12 Listing Removed — Smart MLS
- 2006-04-12 Listed $439,900 Smart MLS
- 2006-03-26 Listing Removed — Smart MLS
- 2006-03-26 Listed $440,000 Smart MLS
- 2005-09-13 Listed $460,000 Smart MLS
Property tax history
+7.5%/yrLatest (2023): $13,562 · -6.4% YoY. Source: county tax records.
Cash-flow waterfall
monthlySold comps — $/sqft
last 12 mo · ≤1 miLoading sold comps…