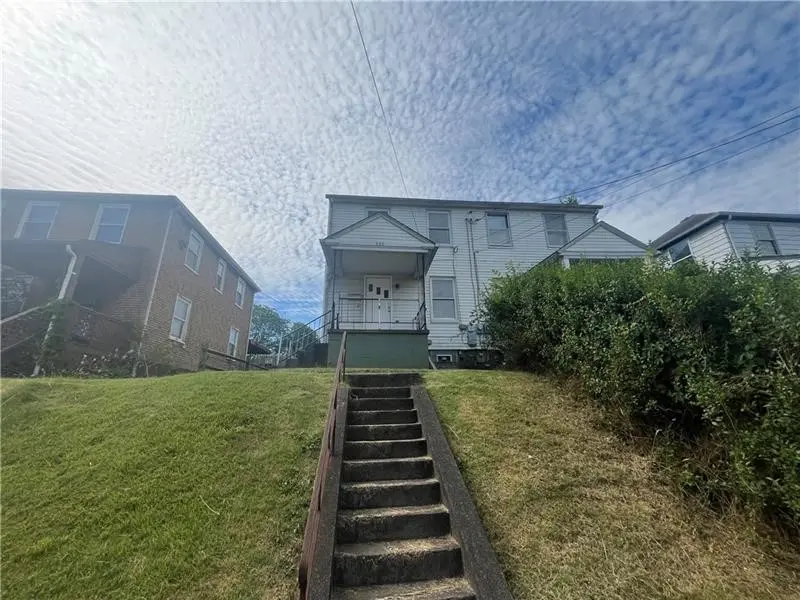
520 Farnsworth · Clairton, PA
Flood risk 1/10 · Minimal
- FEMA flood zone
- X (unshaded)
- Chance of flooding over 30 yrs
- 0.0%
- Est. flood insurance / yr
- $473 – $860
Fire risk 1/10 · Minimal
- Est. fire insurance / yr
- $511 – $949
Heat risk 3/10 · Minor
- Hot days now (above 96°F)
- 7 days/yr
- Hot days in 30 yrs
- 18 days/yr
Wind risk 2/10 · Minimal
- Chance of severe wind over 30 yrs
- —
Air-quality risk 5/10 · Moderate
- Unhealthy air days now
- 8 days/yr
- Unhealthy air days in 30 yrs
- 8 days/yr
Risk factors via First Street. Map © Google.
Why this score? — see what drove the C- grade
The composite is a weighted blend of 9 inputs, each scored 0–100. Each bar is that input's sub-score; the figure is the points it added to the 100-point composite (weight × sub-score).
- Cash flow +22.6/30.0
- ARV discount +7.5/15.0
- DSCR +7.3/10.0
- 1% rule +5.2/10.0
- Rent growth +5.0/5.0
- Livability +3.2/5.0
- Condition / age +2.5/5.0
- Schools +1.1/10.0
- Appreciation +0.0/10.0
$109,900
🖨 Deal sheet (PDF) 📄 Offer letter ✓ Due diligence
Listing remarks MLS
Discover an excellent investment opportunity with this newly updated property at 520 Farnsworth. Currently occupied by reliable Section 8 tenant, this well-maintained home offers a steady rental income. Recent updates enhance its appeal, ensuring low maintenance for years to come. Ideal for investors looking to expand their portfolio with a turnkey rental property. Don’t miss out!
Key facts
- Well maintained
- Steady rental income
- 2,178 sq ft lot
Tags
Neighborhood map
What this means for you Summary
Snapshot
- This is a 2-bed/1.0-bath condo listed at $110k.
Deal economics
- At list price, monthly cash flow is $187 ($2k/yr) — positive.
- The deal already cash-flows at list — no discount required.
- Meets the 1% rule at list price ($1k rent vs $110k).
- Recommended offer: $97k (12.0% below list) — sets the bar for market timing.
- Cap rate 8.3% vs local median 12.3% in Clairton — below-typical yield; the buyer is paying a premium for something (appreciation thesis, condition, location) that the cap rate doesn't capture.
Location & tenants
- Location reads 63/100 on livability (#1,308 in PA) — a middle-class / working-renter tenant base. Strengths: cost of living A+, housing A; Watch: crime C-, health & safety D+, amenities F.
- Clairton City SD (suburban): math 7% / reading 21% proficiency, ranked #520 of 539 in PA (top 96%) — low school quality limits family demand, transient renter base, plan for 1-2y turnover; 82% free/reduced lunch — lower-income household profile, screen leases tightly.
- Zoned schools: Clairton El Sch (math 8% / reading 17%, grade F, #1,362 of 1,518 statewide, top 92%, 389 students, 100% FRL); Clairton Ms/Hs (math 6% / reading 22%, grade F, #411 of 437 statewide, top 94%, 418 students, 92% FRL).
- Market conditions: Rents rising fast (+10.5%/yr); 95 active listings in the ZIP; 16 comparable units currently listed for rent nearby; rentals lingering (median 45d on market — plan ~5-8 weeks vacancy on turnover, expect pricing pressure); 50% of comp listings sitting > 30 days — soft ceiling on asking rent; solid renter incomes; 2,996 units permitted in Allegheny County in 2024 (1,588 in 5+ unit buildings).
- This rent is only 18% of the median local income ($77k/yr) — well below the 30% rent-burden line; pricing power to push rent on renewal without tenant pushback.
Forward outlook
- Local home prices are declining (-3.0%/yr); year-one equity from $760 of loan paydown is wiped out by about $3k of value loss. Plan a longer hold.
- At projected returns (-3.0% appreciation + 8.0% rent growth), your $31k cash investment doubles in ~9 years — after that, you're playing with house money.
Negotiation context
- It's been on market 215 days — a 12% lower offer ($97k) is reasonable based on typical stale-listing flexibility.
- 4 sale attempts since 18y ago with the ask held roughly flat each time — persistent listings suggest the price (not the market) is what's stuck; bring a comps-based counter.
- Current owner paid $30k; list at $110k implies a 266% gain — meaningful room to come down on a strong offer.
Risks & watch-outs
- Watch-outs: built in 1927 — expect roof / HVAC / electrical / plumbing capex.
Questions for the listing agent
- It's been on market 215 days. Have you received any prior offers? Is the seller open to a 12% concession, seller financing, or rate buy-down credit?
- Built in 1927 — when were the roof, HVAC, electrical panel, plumbing, and water heater last replaced?
- Any open or pending special assessments — roof, HVAC, plumbing, elevator, façade? What's the per-unit balance and payoff schedule, and is the seller paying it off at close or rolling it to the buyer?
- Why hasn't it sold? Are there any deal-killer items the seller is aware of (foundation, flood, title, zoning, code violations)?
- Is there a deadline driving the sale (1031 exchange, divorce, estate, relocation)? That informs how much negotiation room exists.
- Schools are F-rated, which usually means shorter tenancies and higher turnover. Who's the typical renter profile here, and what's been the actual vacancy rate?
- What's the average days-on-market for RENTAL listings here right now (not sales)? A rising rental-DOM trend means longer vacancies and softer asking-rent achievability than the comps imply.
- What's the recent tenant-quality profile in this submarket — average credit score on applications, eviction rate, late-payment / NSF rate, and stable-employment percentage? A property-management company in the area should have these aggregated.
- How much new apartment / multifamily construction is in the pipeline within 1–3 miles? Heavy new supply (>2% of stock underway) typically softens rents 12–24 months out; light construction supports rent growth.
Investment metrics
- 1% rule
- 1.02% ✓
- Cap rate
- 8.34%
- Cash-on-cash
- 7.31%
- DSCR
- 1.33
- GRM
- 8.1
CMA / ARV
- ARV (median comp)
- $58,552
- List price
- $109,900
- Delta
- 87.70%
- Verdict
- OVERPRICED
- Comps
- 20 within 1.0 mi
Projected returns pro-forma
-3.0% appreciation · 8.0% rent growth · sell at horizon
- IRR
- 0.0%
- Equity multiple
- 1.00×
- Total profit
- $52
- Equity at exit
- $16,386
- IRR
- 14.1%
- Equity multiple
- 2.38×
- Total profit
- $42,381
- Equity at exit
- $9,502
Cash invested: $30,772 (down + closing). Projections, not guarantees.
Landlord ↔ Tenant lean methodology
- Overall (STATE)
- 62 Landlord-Friendly
- State Pennsylvania
- 62 Landlord-Friendly · EVEN
- County
- — inherits STATE
- City
- — inherits STATE
ZIP-level market 15025
- Home prices YoY
- -34.4%
- Rents YoY
- 10.5%
- Active inventory
- 95
- Price-to-rent
- 8.1×
Monthly cashflow live
- Estimated rent
- $1,124 high interval (Pro) →
- Mortgage (P&I)
- −$576
- Tax from tax record
- −$79 /mo · $942/yr
- Insurance
- −$46
- HOA
- −$0
- Vacancy / Maint / Mgmt
- −$236
- Net cashflow
- $187
Break-even live
Sensitivity live
| Price | -10% $250 | -5% $219 | +0% $187 | +5% $156 | +10% $125 |
|---|---|---|---|---|---|
| Rent | -10% $99 | -5% $143 | +0% $187 | +5% $232 | +10% $276 |
| Rate | -1.0pp $243 | -0.5pp $215 | base $187 | +0.5pp $159 | +1.0pp $130 |
UW: 25.0% down · 7.5% · 30yr · 1.5% tax · 5.0% vac · 8.0% maint · 8.0% mgmt
Financing live
Cash to close
- Down payment
- $27,475
- Closing costs
- $3,297
- Reserves months
- —
- Total cash needed
- —
Loan-product check · same deal, 3 products live
Conventional
25% down · 7.5% · 30yr
- Down + closing
- —
- Monthly P&I
- —
- Monthly cashflow
- —
- DSCR
- —
- Eligible?
- —
Personal DTI + credit; lowest rate.
DSCR
20% down · 8.5% · 30yr
- Down + closing
- —
- Monthly P&I
- —
- Monthly cashflow
- —
- DSCR
- —
- Eligible?
- —
No personal income docs; deal must DSCR.
Hard money
10% down · 12.0% · 12mo
- Down + closing
- —
- Monthly P&I
- —
- Monthly cashflow
- —
- DSCR
- —
- Eligible?
- —
Short-term bridge; refi at stabilization.
Rent comps 16 comps
| Address | Beds | Baths | Sqft | Rent | $/sqft | DOM | Units | Dist |
|---|---|---|---|---|---|---|---|---|
| 601 Farnsworth Ave Clairton, PA | 2.0 | 1.0 | 1004 | $995 | $0.99 | 6d | 1 | 0.12mi |
| 927 Vankirk St Clairton, PA | 2.0 | 1.0 | 840 | $1,150 | $1.37 | 14d | 1 | 0.16mi |
| 618 Farnsworth Ave Clairton, PA | 2.0 | 1.0 | 896 | $1,050 | $1.17 | 45d | 1 | 0.16mi |
| 929 Vankirk St Unit 1 Clairton, PA | 2.0 | 1.5 | 810 | $1,050 | $1.30 | 45d | 1 | 0.17mi |
| 753 East Dr Clairton, PA | 3.0 | 1.0 | 1000 | $1,100 | $1.10 | 45d | 1 | 0.26mi |
| 127 Constitution Cir Clairton, PA | 2.0 | 1.0 | 1063 | $1,275 | $1.20 | 12d | 1 | 0.28mi |
| 127 Constitution Cir Clairton, PA | 2.0 | 1.0 | 972 | $1,275 | $1.31 | 3d | 1 | 0.28mi |
| 505 Wylie Ave Clairton, PA | 2.0 | 1.0 | 791 | $1,500 | $1.90 | 3d | 1 | 0.39mi |
| 422 Mitchell Ave Rear Rear Clairton, PA | 1.0 | 1.0 | 900 | $975 | $1.08 | 19d | 1 | 0.41mi |
| 446 Waddell Ave Unit 446 1/2 Clairton, PA | 1.0 | 1.0 | 900 | $595 | $0.66 | 45d | 1 | 0.59mi |
| 540 Reed St Unit 1 Clairton, PA | 1.0 | 1.0 | 528 | $799 | $1.51 | 45d | 1 | 0.66mi |
| 701-703 Waddell Ave Clairton, PA | 1.0 | 1.0 | 700 | $900 | $1.29 | 25d | 1 | 0.69mi |
| 2140 Lincoln Blvd Elizabeth, PA | 2.0 | 1.0 | 968 | $790 | $0.82 | 45d | 1 | 0.83mi |
| 1347 High Rd Clairton, PA | 2.0 | 1.0 | 870 | $1,250 | $1.44 | 45d | 1 | 0.88mi |
| 168 Center Ave Unit 1 left) Elizabeth, PA | 2.0 | 1.0 | 950 | $895 | $0.94 | 25d | 1 | 1.20mi |
| 507 N 6th St Clairton, PA | 2.0 | 1.5 | 1120 | $1,250 | $1.12 | 45d | 1 | 1.45mi |
HOA detail condo
- Monthly dues
- $0 · $0/yr
- Assessments
- None detected in remarks — confirm with the listing agent.
Listing history 29 events
-
2026-06-21days on market $109,900 Active 215 DOM
-
2026-06-18days on market $109,900 Active 212 DOM
-
2026-06-17days on market $109,900 Active 211 DOM
-
2026-06-16days on market $109,900 Active 210 DOM
-
2026-06-15days on market $109,900 Active 209 DOM
-
2026-06-13days on market $109,900 Active 207 DOM
-
2026-06-09days on market $109,900 Active 203 DOM
-
2026-06-08days on market $109,900 Active 202 DOM
-
2026-06-07days on market $109,900 Active 201 DOM
-
2026-06-05days on market $109,900 Active 198 DOM
-
2026-06-03days on market $109,900 Active 197 DOM
-
2026-06-02days on market $109,900 Active 196 DOM
-
2026-06-01days on market $109,900 Active 195 DOM
-
2026-05-31days on market $109,900 Active 194 DOM
-
2025-11-18$109,900 Active 389-char remark
Show marketing remark (389 chars)
Discover an excellent investment opportunity with this newly updated property at 520 Farnsworth. Currently occupied by reliable Section 8 tenant, this well-maintained home offers a steady rental income. Recent updates enhance its appeal, ensuring low maintenance for years to come. Ideal for investors looking to expand their portfolio with a turnkey rental property. Don’t miss out!
-
2025-11-18historical Expired 389-char remark
Show marketing remark (389 chars)
Discover an excellent investment opportunity with this newly updated property at 520 Farnsworth. Currently occupied by reliable Section 8 tenant, this well-maintained home offers a steady rental income. Recent updates enhance its appeal, ensuring low maintenance for years to come. Ideal for investors looking to expand their portfolio with a turnkey rental property. Don’t miss out!
-
2025-04-04price $109,900 389-char remark
Show marketing remark (389 chars)
Discover an excellent investment opportunity with this newly updated property at 520 Farnsworth. Currently occupied by reliable Section 8 tenant, this well-maintained home offers a steady rental income. Recent updates enhance its appeal, ensuring low maintenance for years to come. Ideal for investors looking to expand their portfolio with a turnkey rental property. Don’t miss out!
-
2025-01-02price $119,900 389-char remark
Show marketing remark (389 chars)
Discover an excellent investment opportunity with this newly updated property at 520 Farnsworth. Currently occupied by reliable Section 8 tenant, this well-maintained home offers a steady rental income. Recent updates enhance its appeal, ensuring low maintenance for years to come. Ideal for investors looking to expand their portfolio with a turnkey rental property. Don’t miss out!
-
2024-11-26$125,000 Active 389-char remark
Show marketing remark (389 chars)
Discover an excellent investment opportunity with this newly updated property at 520 Farnsworth. Currently occupied by reliable Section 8 tenant, this well-maintained home offers a steady rental income. Recent updates enhance its appeal, ensuring low maintenance for years to come. Ideal for investors looking to expand their portfolio with a turnkey rental property. Don’t miss out!
-
2023-04-13status Pending
-
2023-03-17soldstatus $30,000 Closed
-
2023-02-02historical Contingent
-
2023-01-24price $35,000
-
2023-01-02$38,000 Active
-
2019-05-28soldstatus $15,000
-
2009-01-14soldstatus $6,500
-
2008-11-04soldstatus $5,000
-
2008-06-02$10,500
-
1981-02-01soldstatus $12,000
ⓘ Source: listings_history table (triggers on properties + properties_extension) + one-shot
backfill from property_details.listing_events for pre-trigger history.
Tax reassessment forecast PA · Partial reset (capped growth)
- Current annual tax
- $942 · $79/mo
- Projected year-2 tax
- $1,339 · $112/mo
- Expected delta
- +$397/yr (+$33/mo · 42.1%)
ⓘ Screening estimate from a state-policy table — verify with the county assessor before closing.
Climate risk First Street
- Flood 1/10 Low FEMA zone X (unshaded) · 0% chance over 30 yrs
- Wildfire 1/10 Low
- Heat 3/10 Moderate 7 d/yr ≥96°F today · 18 d/yr by 30 yrs out
- Wind 2/10 Low
- Air quality 5/10 Major 8 unhealthy d/yr today · 8 by 30 yrs out
Nearby sold comps map
Loading sold comps map…
Walkable amenities ~0.75 mi
Loading nearby amenities…
Taxation est. · year 1
- Rental income
- $13,490
- − Mortgage interest
- −$6,156
- − Property taxes
- −$942
- − Insurance
- −$550
- − Repairs & maintenance
- −$1,079
- − Management
- −$1,079
- − Depreciation
- −$3,197
- Taxable income
- $487
- Est. tax owed @ 24.0%
- −$117
- After-tax cash flow
- $2,133/yr
For passive investors: Depreciation is non-cash, so a rental often shows a tax loss while cash-flowing — sheltering income. Rental losses are passive: they offset passive income freely, and up to $25,000/yr can offset ordinary (W-2) income if you actively participate and your MAGI is under $100k (phasing out to $0 by $150k); unused losses carry forward. On sale, claimed depreciation is recaptured at up to 25%, and gains may owe capital-gains tax (a 1031 exchange can defer both). Figures are a year-1 estimate at your 24.0% rate — not tax advice; consult a CPA.
Schools (NCES district)
- District
- Clairton City SD
- NCES district ID
- 4206030
- Math proficiency
- 7% ▼ -11.00%
- Reading proficiency
- 21% ▼ -12.00%
- Median HH income
- $30,250
- Composite
- 11.0/100
- National rank
- #9742
- State rank
- #520 of 539 in PA
Livability — Clairton
- Score
- 63/100
- State rank
- #1308
- US rank
- #16085
Category grades
Schools grade is shown separately in the Schools card above.
Census & demographics
- Census place
- Clairton, PA
- County
- Allegheny County · 1,022,028 people
- City population
- 16,939
- Metro
- Pittsburgh, PA
- Population (ZIP)
- 16,939
- Household income
- $76,531
- Rent vs Own
- Severe rent burden
- 572.0
Population outlook (Allegheny County) Hauer SSP2
- Today (2025)
- 1,250,282 people
- By 2030
- 1,256,482 · +0.5%
- By 2040
- 1,256,318 · +0.5%
- By 2050
- 1,244,169 · -0.5%
- By 2075
- 1,197,693 · -4.2%
- By 2100
- 1,093,187 · -12.6%
Race, ethnicity, and origin ACS 2023
- Neighborhood character
- Predominantly White (74%)
- Race & ethnicity
- White 74% Black 18% Two or more races 4% Asian 2% Hispanic / Latino 2%
- Common ancestry
- Romanian 6% Lithuanian 2% Slovak 1%
- Foreign-born
- 4% · China, Canada, India
- Languages at home
- 96% English-only · Other Indo-European 1% Chinese 1% Spanish 1%
Political lean MEDSL · Allegheny
- 2024 margin
- Strong D (+20.3) · D 59.7% · R 39.4%
- 2008→2024 swing
- +4.8pp toward D · 2008: 15.5pp · 2024: 20.3pp
- All cycles
- 2024: D+20.3 2020: D+20.4 2016: D+16.4 2012: D+14.4 2008: D+15.5
Not yet ingested
- Civics
- —
Market trends
- HPI YoY
- ▼ -96.35%
- Current HPI
- 183.858
- Rent YoY
- ▲ 10.47%
- Metro
- Pittsburgh, PA
- State GDP YoY
- ▲ 1.68%
- F500 in state
- 34
Industry mix (Fortune 500 HQ in PA)
| Industry | F500 HQs | Revenue |
|---|---|---|
| Healthcare | 2 | $309B |
|
||
| Insurance | 2 | $27B |
|
||
| Telecommunications / Media | 1 | $124B |
|
||
| Industrial Distribution | 1 | $22B |
|
||
| Financial Services | 1 | $20B |
|
||
| Chemicals / Materials | 1 | $18B |
|
||
Price history
+815.8% since first listed15 events — show timeline
- 2025-11-18 Delisted — West Penn MLS
- 2025-11-18 Listed $109,900 West Penn MLS
- 2025-04-04 Price Changed $109,900 West Penn MLS
- 2025-01-02 Price Changed $119,900 West Penn MLS
- 2024-11-26 Listed $125,000 West Penn MLS
- 2023-04-13 Pending — West Penn MLS
- 2023-03-17 Sold (MLS) $30,000 West Penn MLS
- 2023-02-02 Contingent — West Penn MLS
- 2023-01-24 Price Changed $35,000 West Penn MLS
- 2023-01-02 Listed $38,000 West Penn MLS
- 2019-05-28 Sold (Public Records) $15,000 Public Records
- 2009-01-14 Sold (Public Records) $6,500 Public Records
- 2008-11-04 Sold (MLS) $5,000 West Penn MLS
- 2008-06-02 Listed $10,500 West Penn MLS
- 1981-02-01 Sold (Public Records) $12,000 Public Records
Property tax history
+12.7%/yrLatest (2026): $942 · +11.0% YoY. Source: county tax records.
Cash-flow waterfall
monthlySold comps — $/sqft
last 12 mo · ≤1 miLoading sold comps…