 Triplex
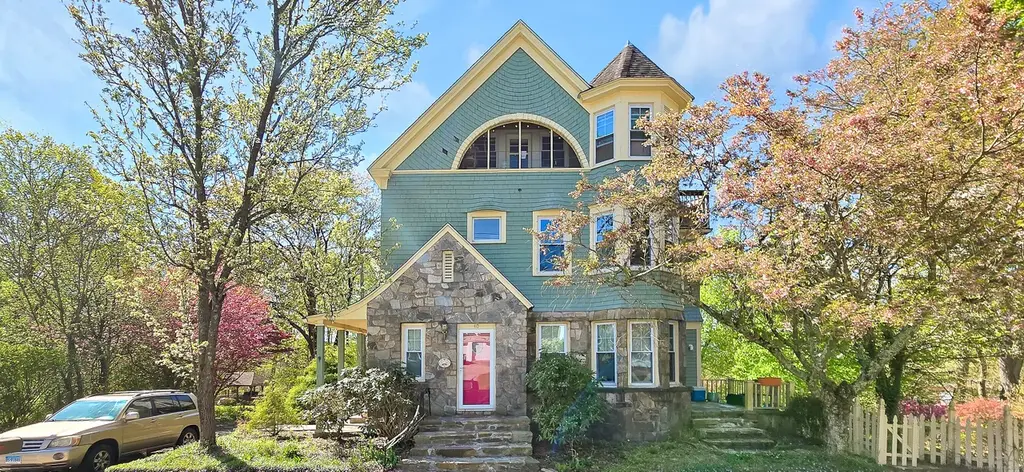
40 Maple Grove Ave · Norwich, CT
Flood risk 1/10 · Minimal
- FEMA flood zone
- X (unshaded)
- Chance of flooding over 30 yrs
- 0.0%
- Est. flood insurance / yr
- $473 – $860
Fire risk 3/10 · Minor
- Est. fire insurance / yr
- $829 – $1,539
Heat risk 5/10 · Moderate
- Hot days now (above 97°F)
- 7 days/yr
- Hot days in 30 yrs
- 17 days/yr
Wind risk 6/10 · Moderate
- Chance of severe wind over 30 yrs
- 65.0%
Air-quality risk 3/10 · Minor
- Unhealthy air days now
- 2 days/yr
- Unhealthy air days in 30 yrs
- 3 days/yr
Risk factors via First Street. Map © Google.
Why this score? — see what drove the C+ grade
The composite is a weighted blend of 9 inputs, each scored 0–100. Each bar is that input's sub-score; the figure is the points it added to the 100-point composite (weight × sub-score).
- Cash flow +30.0/30.0
- DSCR +10.0/10.0
- 1% rule +8.8/10.0
- Rent growth +4.2/5.0
- Livability +4.0/5.0
- Condition / age +2.5/5.0
- Schools +2.1/10.0
- ARV discount +0.0/15.0
- Appreciation +0.0/10.0
$435,000
🖨 Deal sheet 📄 Offer letter ✓ Due diligence
Multi-family units
County records classify this as Multi-Family (2-4 Unit). Listing-text estimate: 3 units. confirmed
Listing remarks
OPEN HOUSE -- Saturday, 6/20, from 12-1pm -- Charming three-family property situated along the scenic Heritage Trail with peaceful views of the Yantic River in Norwich. This unique multifamily asset blends classic New England character with strong owner-occupant or investment potential. Featuring beautiful stone and shingle architecture, the property is surrounded by mature landscaping, a large park-like yard, and a tranquil setting just moments from downtown amenities, parks, and walking trails. The property includes spacious units with abundant natural light, updated mechanicals, a newer roof, on-site laundry, a detached two-car garage, and ample off-street parking. Current market rents a
Key facts
- Yantic river views
- Large park-like yard
- Newer roof
Tags
Property features AI
Exterior
- Utilities: Public water connected; Public sewer connected
- Home design: Multi-family property (3-family)
- Construction: Frame construction; Masonry foundation
- Exterior features: Shingle exterior siding; Asphalt shingle roof
Interior
- Bedrooms: 4 bedrooms
- Bathrooms: 4 full bathrooms
- Heating & cooling: Steam heat (oil-fired); Above-ground fuel tank
- Interior features: 15 total rooms; Full basement; One fireplace
Neighborhood map
What this means for you Summary
Snapshot
- This is a 3 × 4-bed/4.0-bath units multifamily listed at $435k.
Deal economics
- At list price, monthly cash flow is $2k ($22k/yr) — positive. Per door: $604/mo.
- The deal already cash-flows at list — no discount required.
- Meets the 1% rule at list price ($6k rent vs $435k).
- Recommended offer: $428k (1.5% below list) — sets the bar for market timing.
- Cap rate 11.3% vs local median 4.0% in Norwich — top-decile yield for the area; either an underpriced asset or a hidden risk that comps aren't pricing in. Stress-test before assuming the spread holds.
Location & tenants
- Location reads 81/100 on livability (#18 in CT, #1,391 nationally) — a professional / high-income tenant draw. Strengths: housing A+, health & safety A+, commute A-; Watch: schools D+.
- Norwich School District (urban): math 19% / reading 29% proficiency, ranked #139 of 153 in CT (top 91%) — low school quality limits family demand, transient renter base, plan for 1-2y turnover; 62% free/reduced lunch — lower-income household profile, screen leases tightly.
- Market conditions: Rents rising fast (+6.6%/yr); 241 active listings in the ZIP; 1 comparable units currently listed for rent nearby; 487 units permitted in Southeastern Connecticut Planning Region in 2024 (244 in 5+ unit buildings).
- At $5,985/mo this rent would consume 110% of the median local household income ($66k/yr) (locally 1643% of renters already pay >50% of income on rent) — very limited rent-growth headroom before tenants either downsize or default.
Forward outlook
- Local home prices are declining (-3.0%/yr); year-one equity from $3k of loan paydown is wiped out by about $13k of value loss. Plan a longer hold.
- At projected returns (-3.0% appreciation + 6.6% rent growth), your $122k cash investment doubles in ~6 years — after that, you're playing with house money.
Negotiation context
- It's been on market 17 days — a 2% lower offer ($428k) is reasonable based on typical stale-listing flexibility.
- 14 sale attempts since 16y ago with the ask held roughly flat each time — persistent listings suggest the price (not the market) is what's stuck; bring a comps-based counter.
- Current owner paid $240k; list at $435k implies a 81% gain — meaningful room to come down on a strong offer.
Risks & watch-outs
- Watch-outs: built in 1881 — expect roof / HVAC / electrical / plumbing capex.
- Climate carrying-cost: major wind risk, 65% chance of damaging wind over 30y; extreme-heat days projected 7→17/yr by 2055 (HVAC capex compounding) — expect insurance premiums to compound above CPI over the hold.
Questions for the listing agent
- Can we see the unit-by-unit rent roll, current vacancy, and any below-market leases? What's the average tenancy length?
- What capital expenditures (roof, boiler, parking lot, exteriors) have been made in the last 5 years, and what's planned in the next 2?
- Built in 1881 — when were the roof, HVAC, electrical panel, plumbing, and water heater last replaced?
- Is there a deadline driving the sale (1031 exchange, divorce, estate, relocation)? That informs how much negotiation room exists.
- Schools are D-rated, which usually means shorter tenancies and higher turnover. Who's the typical renter profile here, and what's been the actual vacancy rate?
- What's the average days-on-market for RENTAL listings here right now (not sales)? A rising rental-DOM trend means longer vacancies and softer asking-rent achievability than the comps imply.
- What's the recent tenant-quality profile in this submarket — average credit score on applications, eviction rate, late-payment / NSF rate, and stable-employment percentage? A property-management company in the area should have these aggregated.
- How much new apartment / multifamily construction is in the pipeline within 1–3 miles? Heavy new supply (>2% of stock underway) typically softens rents 12–24 months out; light construction supports rent growth.
Investment metrics
- 1% rule
- 1.38% ✓
- Cap rate
- 11.29%
- Cash-on-cash
- 17.86%
- DSCR
- 1.79
- GRM
- 6.1
CMA / ARV
- ARV (median comp)
- $325,570
- List price
- $435,000
- Delta
- 48.97%
- Verdict
- OVERPRICED
- Comps
- 20 within 1.0 mi
Show comp detail 12 sales within ~0.75 mi
| Address | Dist | Beds/Ba | Sqft | Sold | Price | $/sf | Match |
|---|---|---|---|---|---|---|---|
| 39 Greene Ave | 0.23mi | 3/2.0 (-1) | 2,458 (-3%) | 4mo | $340,000 | $138 | 63 |
| 48 Otis St | 0.53mi | 5/2.0 (+1) | 2,544 (0%) | 5mo | $265,000 | $104 | 54 |
| 76 Laurel Hill Ave | 0.66mi | 4/2.0 | 2,580 (+2%) | 2mo | $150,000 | $58 | 53 |
| 31 Happy St | 0.23mi | 5/2.0 (+1) | 2,340 (-8%) | 10mo | $275,000 | $118 | 50 |
| 71 Franklin St | 0.55mi | 4/2.0 | 2,569 (+1%) | 19mo | $120,000 | $47 | 45 |
| 43 Union St | 0.42mi | 5/4.0 (+1) | 2,238 (-12%) | 9mo | $365,000 | $163 | 44 |
| 44 Pearl St | 0.32mi | 4/3.0 | 2,920 (+15%) | 14mo | $385,000 | $132 | 41 |
| 36 Pearl St | 0.30mi | 5/2.0 (+1) | 2,786 (+10%) | 15mo | $203,000 | $73 | 40 |
| 41 Peck St | 0.56mi | 5/2.0 (+1) | 2,199 (-14%) | 1mo | $170,000 | $77 | 33 |
| 116 Laurel Hill Ave | 0.75mi | 4/4.0 | 2,317 (-9%) | 17mo | $300,000 | $129 | 32 |
| 125 McKinley Ave | 0.59mi | 5/3.0 (+1) | 2,224 (-12%) | 11mo | $299,000 | $134 | 30 |
| 36 Boswell Ave | 0.62mi | 4/2.0 | 2,180 (-14%) | 7mo | $155,000 | $71 | 29 |
Match score weights: distance 35% · size 25% · config 20% · recency 20%. Top-matched comps best support the ARV.
Projected returns pro-forma
-3.0% appreciation · 6.62% rent growth · sell at horizon
- IRR
- 13.3%
- Equity multiple
- 1.55×
- Total profit
- $67,579
- Equity at exit
- $64,860
- IRR
- 24.8%
- Equity multiple
- 3.52×
- Total profit
- $307,515
- Equity at exit
- $37,611
Cash invested: $121,800 (down + closing). Projections, not guarantees.
Landlord ↔ Tenant lean methodology
- Overall (STATE)
- 27 Tenant-Leaning
- State Connecticut
- 27 Tenant-Leaning · D+7
- County
- — inherits STATE
- City
- — inherits STATE
ZIP-level market 06360
- Home prices YoY
- -19.9%
- Rents YoY
- 6.6%
- Active inventory
- 241
- Price-to-rent
- 18.2×
Monthly cashflow live
- Estimated rent
- $5,985 medium interval (Pro) →
- Mortgage (P&I)
- −$2,281
- Tax from tax record
- −$453 /mo · $5,438/yr
- Insurance
- −$181
- HOA
- −$0
- Vacancy / Maint / Mgmt
- −$1,257
- Net cashflow
- $1,813
Break-even live
3-unit breakdown (identical units grouped — click to expand)
| Units | Beds | Baths | Est. rent |
|---|---|---|---|
| 3× units | 4 | 4 | $5,985 |
| #1 | 4 | 4 | $1,995 |
| #2 | 4 | 4 | $1,995 |
| #3 | 4 | 4 | $1,995 |
| Total (3 units) | $5,985 | ||
UW: 25.0% down · 7.5% · 30yr · 1.5% tax · 5.0% vac · 8.0% maint · 8.0% mgmt
Financing live
Cash to close
- Down payment
- $108,750
- Closing costs
- $13,050
- Reserves months
- —
- Total cash needed
- —
Loan-product check · same deal, 3 products live
Conventional
25% down · 7.5% · 30yr
- Down + closing
- —
- Monthly P&I
- —
- Monthly cashflow
- —
- DSCR
- —
- Eligible?
- —
Personal DTI + credit; lowest rate.
DSCR
20% down · 8.5% · 30yr
- Down + closing
- —
- Monthly P&I
- —
- Monthly cashflow
- —
- DSCR
- —
- Eligible?
- —
No personal income docs; deal must DSCR.
Hard money
10% down · 12.0% · 12mo
- Down + closing
- —
- Monthly P&I
- —
- Monthly cashflow
- —
- DSCR
- —
- Eligible?
- —
Short-term bridge; refi at stabilization.
Rent comps 1 comps
| Address | Beds | Baths | Sqft | Rent | $/sqft | DOM | Units | Dist |
|---|---|---|---|---|---|---|---|---|
| 130 Platt Ave Norwich, CT | 3.0 | 1.0 | 2010 | $1,800 | $0.90 | 43d | 1 | 0.79mi |
Listing history 43 events
-
2026-06-19days on market $435,000 Active 17 DOM
-
2026-06-18days on market $435,000 Active 16 DOM
-
2026-06-17days on market $435,000 Active 15 DOM
-
2026-06-16days on market $435,000 Active 14 DOM
-
2026-06-15days on market $435,000 Active 13 DOM
-
2026-06-14days on market $435,000 Active 11 DOM
-
2026-06-13days on market $435,000 Active 10 DOM
-
2026-06-10days on market $435,000 Active 8 DOM
-
2026-06-09days on market $435,000 Active 7 DOM
-
2026-06-08days on market $435,000 Active 6 DOM
-
2026-06-07days on market $435,000 Active 5 DOM
-
2026-06-03pricedays on market $435,000 Active 1 DOM
-
2026-06-01days on market $485,000 Active 12 DOM
-
2026-05-31days on market $485,000 Active 11 DOM
-
2026-05-30days on market $485,000 Active 10 DOM
-
2026-04-10$485,000 Active 1331-char remark
-
2026-04-01historical
-
2026-02-25status Active
-
2026-02-19status Under Contract
-
2026-02-09$485,000 Active
-
2026-01-31historical
-
2026-01-07historical
-
2026-01-07$485,000 Active
-
2025-10-29$485,000 Active
-
2023-06-08soldstatus $240,160 Closed
-
2023-05-31status Under Contract
-
2023-05-03historical Under Contract - Continue to Show
-
2023-04-16$1,550,000 Active
-
2021-06-25soldstatus $300,000 Closed
-
2021-05-04$270,000 Active
-
2021-04-30historical $270,000
-
2015-06-01soldstatus $110,000
-
2015-05-20historical
-
2015-03-15$122,500
-
2013-07-04historical
-
2013-01-05$169,000
-
2012-09-23historical
-
2011-09-24$219,900
-
2011-01-31historical
-
2010-07-13$249,900
-
2010-03-09historical
-
2010-02-15$274,500
-
1993-11-24soldstatus $97,000
ⓘ Source: listings_history table (triggers on properties + properties_extension) + one-shot
backfill from property_details.listing_events for pre-trigger history.
Tax reassessment forecast CT · Partial reset (capped growth)
- Current annual tax
- $5,438 · $453/mo
- Projected year-2 tax
- $7,374 · $614/mo
- Expected delta
- +$1,936/yr (+$161/mo · 35.6%)
ⓘ Screening estimate from a state-policy table — verify with the county assessor before closing.
Climate risk First Street
- Flood 1/10 Low FEMA zone X (unshaded) · 0% chance over 30 yrs
- Wildfire 3/10 Moderate
- Heat 5/10 Major 7 d/yr ≥97°F today · 17 d/yr by 30 yrs out
- Wind 6/10 Major 65% chance of damaging wind over 30 yrs
- Air quality 3/10 Moderate 2 unhealthy d/yr today · 3 by 30 yrs out
Nearby sold comps map
Loading sold comps map…
Walkable amenities ~0.75 mi
Loading nearby amenities…
Taxation est. · year 1
- Rental income
- $71,820
- − Mortgage interest
- −$24,367
- − Property taxes
- −$5,438
- − Insurance
- −$2,175
- − Repairs & maintenance
- −$5,746
- − Management
- −$5,746
- − Depreciation
- −$12,655
- Taxable income
- $15,694
- Est. tax owed @ 24.0%
- −$3,767
- After-tax cash flow
- $17,984/yr
For passive investors: Depreciation is non-cash, so a rental often shows a tax loss while cash-flowing — sheltering income. Rental losses are passive: they offset passive income freely, and up to $25,000/yr can offset ordinary (W-2) income if you actively participate and your MAGI is under $100k (phasing out to $0 by $150k); unused losses carry forward. On sale, claimed depreciation is recaptured at up to 25%, and gains may owe capital-gains tax (a 1031 exchange can defer both). Figures are a year-1 estimate at your 24.0% rate — not tax advice; consult a CPA.
Schools (NCES district)
- District
- Norwich School District
- NCES district ID
- 0903120
- Math proficiency
- 19% ▼ -8.00%
- Reading proficiency
- 29% ▼ -7.00%
- Median HH income
- $50,813
- Composite
- 21.27/100
- National rank
- #8395
- State rank
- #139 of 153 in CT
Livability — Norwich
- Score
- 81/100
- State rank
- #18
- US rank
- #1391
Category grades
Schools grade is shown separately in the Schools card above.
Census & demographics
- Census place
- Norwich, CT
- County
- New London County · 147,197 people
- City population
- 37,216
- Metro
- Norwich-New London, CT
- Population (ZIP)
- 37,216
- Household income
- $65,539
- Rent vs Own
- Severe rent burden
- 1643.0
Population outlook (Southeastern Connecticut County) Hauer SSP2
- By 2040
- 293,442
Race, ethnicity, and origin ACS 2023
- Neighborhood character
- Diverse neighborhood (Simpson 0.63)
- Race & ethnicity
- White 56% Hispanic / Latino 21% Two or more races 12% Black 10% Asian 7%
- Hispanic origin (detail)
- Mexican 3% Puerto Rican 9% Cuban 1% Dominican 3%
- Common ancestry
- Lithuanian 8% Romanian 5% Hispanic 4%
- Foreign-born
- 15% · Canada, China
- Languages at home
- 77% English-only · Spanish 11% French/Haitian/Cajun 4% Chinese 3%
Political lean MEDSL · Southeastern Connecticut
- 2024 margin
- D (+13.0) · D 55.6% · R 42.6% · Other 1.8%
- All cycles
- 2024: D+13.0
Not yet ingested
- Civics
- —
Market trends
- HPI YoY
- ▼ -65.27%
- Current HPI
- 261.8575
- Rent YoY
- ▲ 6.62%
- Metro
- Norwich-New London, CT
- State GDP YoY
- ▲ 1.06%
- F500 in state
- 38
Industry mix (Fortune 500 HQ in CT)
| Industry | F500 HQs | Revenue |
|---|---|---|
| Industrial Machinery | 4 | $38B |
|
||
| Insurance | 3 | $71B |
|
||
| Financial Services | 2 | $25B |
|
||
| Transportation / Logistics | 2 | $18B |
|
||
| Healthcare | 1 | $247B |
|
||
| Telecommunications | 1 | $55B |
|
||
Price history
+348.5% since first listed32 events — show timeline
- 2026-06-02 Listed $435,000 Smart MLS
- 2026-06-02 Listing Removed — Smart MLS
- 2026-05-20 Listing Removed — Smart MLS
- 2026-05-20 Listed $485,000 Smart MLS
- 2026-04-10 Listed $485,000 Smart MLS
- 2026-04-01 Listing Removed — Smart MLS
- 2026-02-25 Relisted — Smart MLS
- 2026-02-19 Pending — Smart MLS
- 2026-02-09 Listed $485,000 Smart MLS
- 2026-01-31 Listing Removed — Smart MLS
- 2026-01-07 Listing Removed — Smart MLS
- 2026-01-07 Listed $485,000 Smart MLS
- 2025-10-29 Listed $485,000 Smart MLS
- 2023-06-08 Sold (MLS) $240,160 Smart MLS
- 2023-05-31 Pending — Smart MLS
- 2023-05-03 Contingent — Smart MLS
- 2023-04-16 Listed $1,550,000 Smart MLS
- 2021-06-25 Sold (MLS) $300,000 Smart MLS
- 2021-05-04 Listed $270,000 Smart MLS
- 2021-04-30 Coming Soon $270,000 Smart MLS
- 2015-06-01 Sold (MLS) $110,000 Smart MLS
- 2015-05-20 Listing Removed — Smart MLS
- 2015-03-15 Listed $122,500 Smart MLS
- 2013-07-04 Listing Removed — Smart MLS
- 2013-01-05 Listed $169,000 Smart MLS
- 2012-09-23 Listing Removed — Smart MLS
- 2011-09-24 Listed $219,900 Smart MLS
- 2011-01-31 Listing Removed — Smart MLS
- 2010-07-13 Listed $249,900 Smart MLS
- 2010-03-09 Listing Removed — Smart MLS
- 2010-02-15 Listed $274,500 Smart MLS
- 1993-11-24 Sold (Public Records) $97,000 Public Records
Property tax history
-1.1%/yrLatest (2023): $5,438 · +0.3% YoY. Source: county tax records.
Cash-flow waterfall
monthlySold comps — $/sqft
last 12 mo · ≤1 miLoading sold comps…