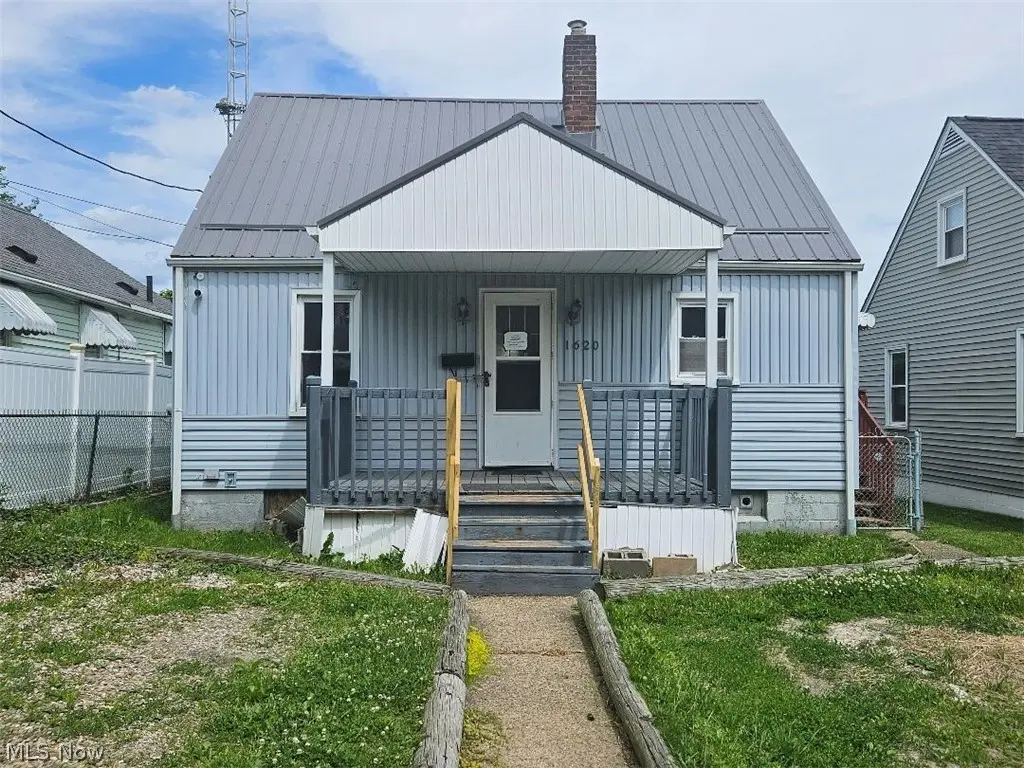
1620 Sandwith Ave SW · Canton, OH
Flood risk 1/10 · Minimal
- FEMA flood zone
- X (unshaded)
- Chance of flooding over 30 yrs
- 0.0%
- Est. flood insurance / yr
- $473 – $860
Fire risk 1/10 · Minimal
- Est. fire insurance / yr
- $713 – $1,323
Heat risk 3/10 · Minor
- Hot days now (above 96°F)
- 7 days/yr
- Hot days in 30 yrs
- 17 days/yr
Wind risk 1/10 · Minimal
- Chance of severe wind over 30 yrs
- —
Air-quality risk 2/10 · Minimal
- Unhealthy air days now
- 0 days/yr
- Unhealthy air days in 30 yrs
- 1 days/yr
Risk factors via First Street. Map © Google.
Why this score? — see what drove the B- grade
The composite is a weighted blend of 9 inputs, each scored 0–100. Each bar is that input's sub-score; the figure is the points it added to the 100-point composite (weight × sub-score).
- Cash flow +30.0/30.0
- 1% rule +10.0/10.0
- DSCR +10.0/10.0
- ARV discount +7.5/15.0
- Livability +3.6/5.0
- Rent growth +2.5/5.0
- Condition / age +2.5/5.0
- Schools +1.7/10.0
- Appreciation +0.0/10.0
$49,000
🖨 Deal sheet 📄 Offer letter ✓ Due diligence
Listing remarks
Great Starter or investor opportunity. 3 bedroom cape. Well kept surrounding properties. Full basement, nice front porch. Back yard mostly fenced. Owned by Secretary of Veterans Affairs and sells as-is. Buyer or buyer agent to verify all information herein. Some information may be estimated. Access to garage off rear alley. Garage has added shed type storage with access from back yard. Buyer to choose their own title company and buyer to pay all title company and transfer related costs. See agent information for offer process. Successful offeror will be presented with and to sign Seller's proprietary Sale Agreement, which when fully executed, will replace any local or state offer/purchase a
Key facts
- Back yard
- Front porch
- Full basement
Tags
Property features AI
Exterior
- Parking: Detached garage (2 car) on unpaved surface
- Utilities: Public water; Public sewer; Electric service (standard)
- Home design: Two-story home; Vinyl siding; Metal roof
- Construction: Vinyl siding construction; Metal roof; Built (year source: public records)
- Exterior features: Front porch; Chain-link fencing
Interior
- Kitchen: Kitchen on first level
- Bedrooms: Two main-level bedrooms; One second-level bedroom (25.0 x 8.0)
- Flooring: Carpet in some bedrooms; Wood flooring in living room and one bedroom; Other flooring in kitchen
- Bathrooms: One full bathroom (main level)
- Heating & cooling: Forced-air gas heating
- Interior features: Full, unfinished basement
- Laundry & utility: Washer and dryer in basement
Neighborhood map
What this means for you Summary
Snapshot
- This is a 3-bed/1.0-bath single-family listed at $49k.
Deal economics
- At list price, monthly cash flow is $468 ($6k/yr) — positive.
- The deal already cash-flows at list — no discount required.
- Meets the 1% rule at list price ($1k rent vs $49k).
- Recommended offer: $48k (1.5% below list) — sets the bar for market timing.
- Cap rate 17.8% vs local median 5.1% in Canton — top-decile yield for the area; either an underpriced asset or a hidden risk that comps aren't pricing in. Stress-test before assuming the spread holds.
Location & tenants
- Location reads 71/100 on livability (#441 in OH) — a middle-class / working-renter tenant base. Strengths: commute A+, cost of living A+, housing A; Watch: crime F, employment F.
- Canton City (urban): math 17% / reading 26% proficiency, ranked #627 of 656 in OH (top 96%) — low school quality limits family demand, transient renter base, plan for 1-2y turnover; 76% free/reduced lunch — lower-income household profile, screen leases tightly.
- Market conditions: 87 active listings in the ZIP; 6 comparable units currently listed for rent nearby; rentals lingering (median 44d on market — plan ~5-8 weeks vacancy on turnover, expect pricing pressure); 83% of comp listings sitting > 30 days — soft ceiling on asking rent; 528 units permitted in Stark County in 2024 (84 in 5+ unit buildings).
Forward outlook
- Local home prices are declining (-3.0%/yr); year-one equity from $339 of loan paydown is wiped out by about $1k of value loss. Plan a longer hold.
- Stark County population projected to shrink 8% by 2050 — rents likely to lag national; underwrite the cash flow, not the appreciation.
- At projected returns (-3.0% appreciation + 3.0% rent growth), your $14k cash investment doubles in ~3 years — after that, you're playing with house money.
Negotiation context
- It's been on market 15 days — a 2% lower offer ($48k) is reasonable based on typical stale-listing flexibility.
- 4 sale attempts since 20y ago with the ask held roughly flat each time — persistent listings suggest the price (not the market) is what's stuck; bring a comps-based counter.
Risks & watch-outs
- Watch-outs: built in 1947 — expect roof / HVAC / electrical / plumbing capex.
Questions for the listing agent
- Built in 1947 — when were the roof, HVAC, electrical panel, plumbing, and water heater last replaced?
- Is there a deadline driving the sale (1031 exchange, divorce, estate, relocation)? That informs how much negotiation room exists.
- Crime grade is F in this area — have there been break-ins, vandalism, or insurance claims at this property in the last 3 years? What carrier currently insures it and at what premium?
- What's the average days-on-market for RENTAL listings here right now (not sales)? A rising rental-DOM trend means longer vacancies and softer asking-rent achievability than the comps imply.
- What's the recent tenant-quality profile in this submarket — average credit score on applications, eviction rate, late-payment / NSF rate, and stable-employment percentage? A property-management company in the area should have these aggregated.
- How much new for-sale + rental construction is in the pipeline within 1–3 miles? Heavy new supply typically softens prices + rents 12–24 months out; constrained supply supports both.
Investment metrics
- 1% rule
- 2.11% ✓
- Cap rate
- 17.76%
- Cash-on-cash
- 40.95%
- DSCR
- 2.82
- GRM
- 4.0
CMA / ARV
- ARV (on-the-fly)
- $107,640
- Comps found
- 12
Show comp detail 12 sales within ~0.75 mi
| Address | Dist | Beds/Ba | Sqft | Sold | Price | $/sf | Match |
|---|---|---|---|---|---|---|---|
| 1622 Clarendon Ave SW | 0.16mi | 3/1.0 | 864 (-8%) | 4mo | $94,000 | $109 | 76 |
| 1653 Bedford Ave SW | 0.21mi | 3/1.0 | 1,012 (+8%) | 3mo | $135,000 | $133 | 74 |
| 2918 17th St SW | 0.10mi | 3/2.0 | 864 (-8%) | 8mo | $148,000 | $171 | 72 |
| 3040 13th St SW | 0.46mi | 2/1.0 (-1) | 936 (0%) | 7mo | $128,000 | $137 | 68 |
| 1251 Homewood Ave SW | 0.47mi | 2/1.0 (-1) | 909 (-3%) | 7mo | $84,900 | $93 | 62 |
| 1549 Quimby Ave SW | 0.18mi | 2/1.0 (-1) | 832 (-11%) | 9mo | $70,000 | $84 | 60 |
| 1262 Ardmore Ave SW | 0.45mi | 2/1.0 (-1) | 872 (-7%) | 11mo | $83,000 | $95 | 53 |
| 1242 Linwood Ave SW | 0.67mi | 2/1.0 (-1) | 944 (+1%) | 11mo | $109,900 | $116 | 53 |
| 1019 Dartmouth Ave SW | 0.73mi | 2/1.0 (-1) | 959 (+2%) | 4mo | $94,675 | $99 | 53 |
| 1208 Roslyn Ave SW | 0.64mi | 3/1.0 | 1,040 (+11%) | 4mo | $133,000 | $128 | 49 |
| 1412 Bellflower Ave SW | 0.44mi | 2/1.5 (-1) | 816 (-13%) | 4mo | $93,900 | $115 | 47 |
| 1373 Park Ave SW | 0.62mi | 2/1.0 (-1) | 1,034 (+10%) | 5mo | $40,000 | $39 | 44 |
Match score weights: distance 35% · size 25% · config 20% · recency 20%. Top-matched comps best support the ARV.
Projected returns pro-forma
-3.0% appreciation · 3.0% rent growth · sell at horizon
- IRR
- 37.5%
- Equity multiple
- 2.60×
- Total profit
- $21,902
- Equity at exit
- $7,306
- IRR
- 44.1%
- Equity multiple
- 5.20×
- Total profit
- $57,558
- Equity at exit
- $4,237
Cash invested: $13,720 (down + closing). Projections, not guarantees.
Landlord ↔ Tenant lean methodology
- Overall (STATE)
- 73 Landlord-Friendly
- State Ohio
- 73 Landlord-Friendly · R+6
- County
- — inherits STATE
- City
- — inherits STATE
ZIP-level market 44706
- Active inventory
- 87
- Price-to-rent
- 4.0×
Monthly cashflow live
- Estimated rent
- $1,033 high interval (Pro) →
- Mortgage (P&I)
- −$257
- Tax from tax record
- −$71 /mo · $846/yr
- Insurance
- −$20
- HOA
- −$0
- Vacancy / Maint / Mgmt
- −$217
- Net cashflow
- $468
Break-even live
UW: 25.0% down · 7.5% · 30yr · 1.5% tax · 5.0% vac · 8.0% maint · 8.0% mgmt
Financing live
Cash to close
- Down payment
- $12,250
- Closing costs
- $1,470
- Reserves months
- —
- Total cash needed
- —
Loan-product check · same deal, 3 products live
Conventional
25% down · 7.5% · 30yr
- Down + closing
- —
- Monthly P&I
- —
- Monthly cashflow
- —
- DSCR
- —
- Eligible?
- —
Personal DTI + credit; lowest rate.
DSCR
20% down · 8.5% · 30yr
- Down + closing
- —
- Monthly P&I
- —
- Monthly cashflow
- —
- DSCR
- —
- Eligible?
- —
No personal income docs; deal must DSCR.
Hard money
10% down · 12.0% · 12mo
- Down + closing
- —
- Monthly P&I
- —
- Monthly cashflow
- —
- DSCR
- —
- Eligible?
- —
Short-term bridge; refi at stabilization.
Rent comps 6 comps
| Address | Beds | Baths | Sqft | Rent | $/sqft | DOM | Units | Dist |
|---|---|---|---|---|---|---|---|---|
| 1520 Bryan Ave SW Canton, OH | 3.0 | 1.0 | 1040 | $1,100 | $1.06 | 44d | 1 | 0.39mi |
| 1229 Lawn Ave SW Canton, OH | 2.0 | 1.0 | 936 | $950 | $1.01 | 44d | 1 | 0.78mi |
| 1511 Stark Ave SW Canton, OH | 2.0 | 1.0 | 992 | $900 | $0.91 | 44d | 1 | 0.87mi |
| 2316 2nd St SW Canton, OH | 3.0 | 1.0 | 1125 | $1,095 | $0.97 | 44d | 1 | 1.19mi |
| 2237 Tuscarawas St W Canton, OH | 2.0 | 1.0 | 1035 | $700 | $0.68 | 21d | 1 | 1.30mi |
| 2237 Tuscarawas St W Unit 7 Canton, OH | 2.0 | 1.0 | 1035 | $725 | $0.70 | 44d | 1 | 1.30mi |
Listing history 13 events
-
2026-06-17status $49,000 Pending 15 DOM
-
2026-06-17days on market $49,000 Active 15 DOM
-
2026-06-16days on market $49,000 Active 14 DOM
-
2026-06-15days on market $49,000 Active 13 DOM
-
2026-06-14days on market $49,000 Active 11 DOM
-
2026-06-13days on market $49,000 Active 10 DOM
-
2026-06-10days on market $49,000 Active 8 DOM
-
2026-06-09days on market $49,000 Active 7 DOM
-
2026-06-08days on market $49,000 Active 6 DOM
-
2026-06-07days on market $49,000 Active 5 DOM
-
2026-06-05days on market $49,000 Active 2 DOM
-
2026-06-03remarks 699-char remark
-
2026-06-03$49,000 Active 1 DOM
ⓘ Source: listings_history table (triggers on properties + properties_extension) + one-shot
backfill from property_details.listing_events for pre-trigger history.
Tax reassessment forecast OH · Partial reset (capped growth)
- Current annual tax
- $846 · $71/mo
- Projected year-2 tax
- $846 · $71/mo
- Expected delta
- $0/yr ($0/mo · -0.0%)
ⓘ Screening estimate from a state-policy table — verify with the county assessor before closing.
Climate risk First Street
- Flood 1/10 Low FEMA zone X (unshaded) · 0% chance over 30 yrs
- Wildfire 1/10 Low
- Heat 3/10 Moderate 7 d/yr ≥96°F today · 17 d/yr by 30 yrs out
- Wind 1/10 Low
- Air quality 2/10 Low 0 unhealthy d/yr today · 1 by 30 yrs out
Nearby sold comps map
Loading sold comps map…
Walkable amenities ~0.75 mi
Loading nearby amenities…
Taxation est. · year 1
- Rental income
- $12,396
- − Mortgage interest
- −$2,745
- − Property taxes
- −$846
- − Insurance
- −$245
- − Repairs & maintenance
- −$992
- − Management
- −$992
- − Depreciation
- −$1,425
- Taxable income
- $5,152
- Est. tax owed @ 24.0%
- −$1,236
- After-tax cash flow
- $4,382/yr
For passive investors: Depreciation is non-cash, so a rental often shows a tax loss while cash-flowing — sheltering income. Rental losses are passive: they offset passive income freely, and up to $25,000/yr can offset ordinary (W-2) income if you actively participate and your MAGI is under $100k (phasing out to $0 by $150k); unused losses carry forward. On sale, claimed depreciation is recaptured at up to 25%, and gains may owe capital-gains tax (a 1031 exchange can defer both). Figures are a year-1 estimate at your 24.0% rate — not tax advice; consult a CPA.
Schools (NCES district)
- District
- Canton City
- NCES district ID
- 3904371
- Math proficiency
- 17% ▼ -17.00%
- Reading proficiency
- 26% ▼ -12.00%
- Median HH income
- $28,825
- Composite
- 17.1/100
- National rank
- #9116
- State rank
- #627 of 656 in OH
Livability — Canton
- Score
- 71/100
- State rank
- #441
- US rank
- #7259
Category grades
Schools grade is shown separately in the Schools card above.
Census & demographics
- Census place
- Canton, OH
- County
- Stark County · 272,865 people
- City population
- 103,614
- Metro
- Canton-Massillon, OH
- Population (ZIP)
- 16,496
- Household income
- $58,228
- Rent vs Own
- Severe rent burden
- 502.0
Population outlook (Stark County) Hauer SSP2
- Today (2025)
- 373,708 people
- By 2030
- 371,245 · -0.7%
- By 2040
- 361,331 · -3.3%
- By 2050
- 345,290 · -7.6%
- By 2075
- 302,669 · -19.0%
- By 2100
- 238,870 · -36.1%
Race, ethnicity, and origin ACS 2023
- Neighborhood character
- Predominantly White (84%)
- Race & ethnicity
- White 84% Black 8% Two or more races 6% Hispanic / Latino 3%
- Common ancestry
- Romanian 4% Italian 3% Lithuanian 2%
- Foreign-born
- 1% · Canada
- Languages at home
- 98% English-only · Spanish 2%
Political lean MEDSL · Stark
- 2024 margin
- Strong R (+21.9) · D 38.6% · R 60.5%
- 2008→2024 swing
- -27.4pp toward R · 2008: 5.5pp · 2024: -21.9pp
- All cycles
- 2024: R+21.9 2020: R+18.5 2016: R+17.4 2012: R+0.4 2008: D+5.5
Not yet ingested
- Civics
- —
Market trends
- HPI YoY
- ▼ -156.35%
- Current HPI
- 239.851
- Rent YoY
- —
- Metro
- Canton-Massillon, OH
- State GDP YoY
- ▲ 1.98%
- F500 in state
- 48
Industry mix (Fortune 500 HQ in OH)
| Industry | F500 HQs | Revenue |
|---|---|---|
| Insurance | 3 | $145B |
|
||
| Industrial Machinery | 3 | $49B |
|
||
| Financial Services | 3 | $24B |
|
||
| Consumer Goods | 2 | $93B |
|
||
| Aerospace / Defense | 2 | $47B |
|
||
| Utilities | 2 | $33B |
|
||
Price history
+50.8% since first listed10 events — show timeline
- 2026-05-31 Listed $49,000 MLSNOW
- 2019-07-31 Listing Removed — MLSNOW
- 2019-06-10 Listed $54,900 MLSNOW
- 2017-09-06 Listing Removed — MLSNOW
- 2017-08-23 Listed $49,900 MLSNOW
- 2007-01-31 Listing Removed — MLSNOW
- 2006-05-03 Listed $63,900 MLSNOW
- 1998-10-27 Sold (Public Records) $52,900 Public Records
- 1998-04-13 Sold (Public Records) $31,100 Public Records
- 1993-07-16 Sold (Public Records) $32,500 Public Records
Property tax history
+15.4%/yrLatest (2024): $846 · +2.5% YoY. Source: county tax records.
Cash-flow waterfall
monthlySold comps — $/sqft
last 12 mo · ≤1 miLoading sold comps…