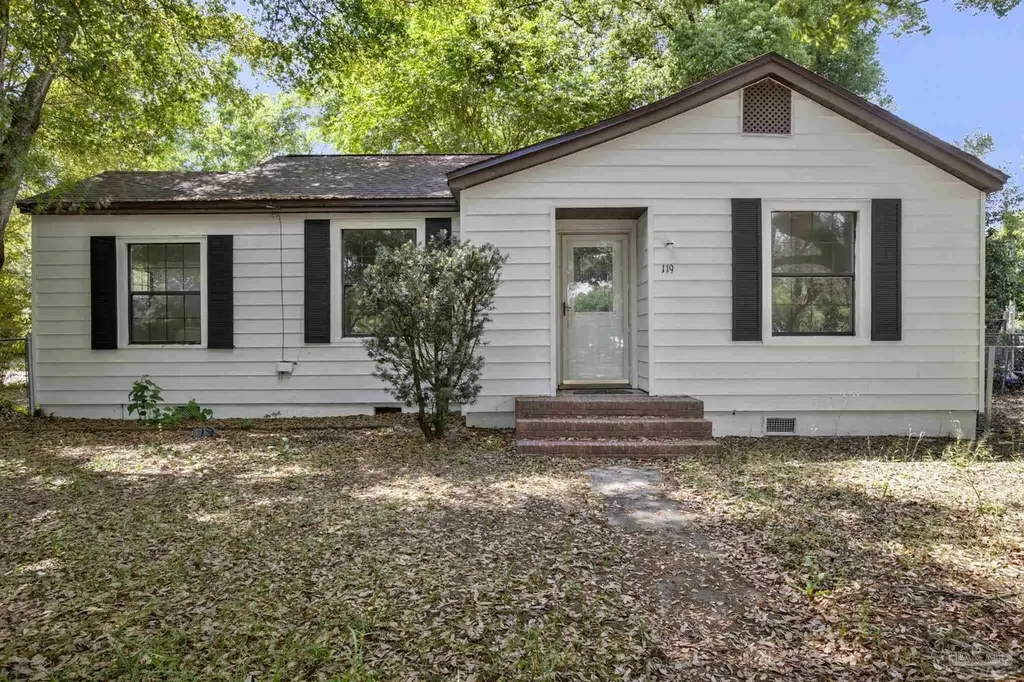
119 N Manchester St · Warrington, FL
Flood risk 1/10 · Minimal
- FEMA flood zone
- X (unshaded)
- Chance of flooding over 30 yrs
- 0.0%
- Est. flood insurance / yr
- $507 – $1,088
Fire risk 2/10 · Minimal
- Est. fire insurance / yr
- $947 – $1,759
Heat risk 10/10 · Severe
- Hot days now (above 105°F)
- 7 days/yr
- Hot days in 30 yrs
- 24 days/yr
Wind risk 9/10 · Severe
- Chance of severe wind over 30 yrs
- 99.0%
Air-quality risk 1/10 · Minimal
- Unhealthy air days now
- 0 days/yr
- Unhealthy air days in 30 yrs
- 0 days/yr
Risk factors via First Street. Map © Google.
Why this score? — see what drove the D- grade
The composite is a weighted blend of 9 inputs, each scored 0–100. Each bar is that input's sub-score; the figure is the points it added to the 100-point composite (weight × sub-score).
- Cash flow +15.5/30.0
- DSCR +4.8/10.0
- 1% rule +3.6/10.0
- Schools +3.6/10.0
- Livability +3.2/5.0
- Rent growth +2.8/5.0
- ARV discount +2.7/15.0
- Condition / age +2.5/5.0
- Appreciation +0.0/10.0
$179,999
🖨 Deal sheet 📄 Offer letter ✓ Due diligence
Listing remarks MLS
Completely renovated 3-bedroom, 1-bath cottage ideally located near NAS Pensacola, just 7 minutes from downtown Pensacola and a short drive to both Perdido Key and Pensacola Beach. Situated in the desirable Corry neighborhood, this home is directly across from a well-maintained neighborhood park—perfect for enjoying the outdoors right outside your door. Inside, you’ll find a beautifully updated interior featuring a brand-new kitchen with modern appliances, stylish tiled bathroom, and durable luxury vinyl plank (LVP) flooring throughout. A move-in-ready gem in a prime location!
Key facts
- Renovated cottage
- Move-in-ready
- Modern appliances
Tags
Neighborhood map
What this means for you Summary
Snapshot
- This is a 3-bed/1.0-bath single-family listed at $180k.
Deal economics
- At list price, monthly cash flow is $72 ($863/yr) — positive.
- The deal already cash-flows at list — no discount required.
- To meet the 1% rule (rent ≥ 1% of price), the offer needs to be $154k (14.3% below list).
- Recommended offer: $154k (14.3% below list) — sets the bar for 1% rule.
- Cap rate 6.8% vs local median 4.3% in Warrington — top-decile yield for the area; either an underpriced asset or a hidden risk that comps aren't pricing in. Stress-test before assuming the spread holds.
Location & tenants
- Location reads 65/100 on livability (#631 in FL) — a middle-class / working-renter tenant base. Strengths: cost of living A+, housing A+; Watch: schools D, amenities F, commute F.
- Escambia (suburban): math 40% / reading 45% proficiency, ranked #56 of 73 in FL (top 77%) — families likely to look elsewhere, expect single-tenant / working-renter base with shorter leases.
- Market conditions: Rents rising (+1.2%/yr); 702 active listings in the ZIP; 14 comparable units currently listed for rent nearby; rentals at typical pace (median 23d on market — plan ~3-4 weeks tenant-placement turnaround); 1,479 units permitted in Escambia County in 2024 (0 in 5+ unit buildings).
Forward outlook
- Local home prices are declining (-3.0%/yr); year-one equity from $1k of loan paydown is wiped out by about $5k of value loss. Plan a longer hold.
- Escambia County population projected at +13% by 2050 — modest demand growth; plan on rents tracking national, not racing it.
Negotiation context
- It's been on market 62 days — a 6% lower offer ($169k) is reasonable based on typical stale-listing flexibility.
- 2 sale attempts since 20y ago; this cycle's ask has dropped $10k (5%) from the opening price — seller is motivated, your offer sets the floor, not the list.
Risks & watch-outs
- Watch-outs: built in 1941 — expect roof / HVAC / electrical / plumbing capex.
- Climate carrying-cost: severe wind risk, 99% chance of damaging wind over 30y; extreme-heat days projected 7→24/yr by 2055 (HVAC capex compounding) — expect insurance premiums to compound above CPI over the hold.
Questions for the listing agent
- It's been on market 62 days. Have you received any prior offers? Is the seller open to a 14% concession, seller financing, or rate buy-down credit?
- Built in 1941 — when were the roof, HVAC, electrical panel, plumbing, and water heater last replaced?
- Why hasn't it sold? Are there any deal-killer items the seller is aware of (foundation, flood, title, zoning, code violations)?
- Is there a deadline driving the sale (1031 exchange, divorce, estate, relocation)? That informs how much negotiation room exists.
- Schools are D-rated, which usually means shorter tenancies and higher turnover. Who's the typical renter profile here, and what's been the actual vacancy rate?
- The area grade is low — what's the realistic commute time and amenity access for the typical tenant pool here? Any planned neighborhood developments (good or bad) we should know about?
- What's the average days-on-market for RENTAL listings here right now (not sales)? A rising rental-DOM trend means longer vacancies and softer asking-rent achievability than the comps imply.
- What's the recent tenant-quality profile in this submarket — average credit score on applications, eviction rate, late-payment / NSF rate, and stable-employment percentage? A property-management company in the area should have these aggregated.
- How much new for-sale + rental construction is in the pipeline within 1–3 miles? Heavy new supply typically softens prices + rents 12–24 months out; constrained supply supports both.
Investment metrics
- 1% rule
- 0.86% ✗
- Cap rate
- 6.77%
- Cash-on-cash
- 1.71%
- DSCR
- 1.08
- GRM
- 9.7
CMA / ARV
- ARV (median comp)
- $162,570
- List price
- $179,999
- Delta
- 10.72%
- Verdict
- OVERPRICED
- Comps
- 20 within 1.0 mi
Show comp detail 12 sales within ~0.75 mi
| Address | Dist | Beds/Ba | Sqft | Sold | Price | $/sf | Match |
|---|---|---|---|---|---|---|---|
| 43 Druid Dr | 0.19mi | 3/1.0 | 864 (-8%) | 2mo | $70,500 | $82 | 76 |
| 225 Delray Dr | 0.29mi | 2/1.0 (-1) | 950 (+1%) | 12mo | $149,000 | $157 | 70 |
| 10 Sulu Dr | 0.29mi | 2/1.0 (-1) | 960 (+2%) | 13mo | $149,900 | $156 | 67 |
| 12 N Runyan St | 0.37mi | 3/2.0 | 928 (-1%) | 15mo | $190,000 | $205 | 64 |
| 1417 Dexter Ave | 0.29mi | 2/1.0 (-1) | 888 (-6%) | 13mo | $176,000 | $198 | 61 |
| 10 N Runyan St | 0.37mi | 3/1.0 | 1,080 (+15%) | 3mo | $105,000 | $97 | 55 |
| 1230 Wilson Ave | 0.55mi | 3/1.0 | 995 (+6%) | 12mo | $210,000 | $211 | 54 |
| 1411 Poppy Ave | 0.28mi | 2/1.0 (-1) | 826 (-12%) | 15mo | $100,000 | $121 | 49 |
| 714 Wingate St | 0.66mi | 2/1.0 (-1) | 1,024 (+9%) | 9mo | $120,000 | $117 | 42 |
| 21 Patton Dr | 0.41mi | 4/2.0 (+1) | 1,059 (+12%) | 13mo | $66,000 | $62 | 40 |
| 118 Baynes Ave | 0.68mi | 4/1.0 (+1) | 1,048 (+11%) | 7mo | $149,999 | $143 | 39 |
| 423 S Navy Blvd | 0.62mi | 2/1.0 (-1) | 1,061 (+13%) | 12mo | $262,000 | $247 | 35 |
Match score weights: distance 35% · size 25% · config 20% · recency 20%. Top-matched comps best support the ARV.
Projected returns pro-forma
-3.0% appreciation · 1.22% rent growth · sell at horizon
- IRR
- -15.5%
- Equity multiple
- 0.46×
- Total profit
- $-27,339
- Equity at exit
- $26,838
- IRR
- -10.1%
- Equity multiple
- 0.43×
- Total profit
- $-28,802
- Equity at exit
- $15,563
Cash invested: $50,400 (down + closing). Projections, not guarantees.
Landlord ↔ Tenant lean methodology
- Overall (STATE)
- 87 Strongly Landlord-Friendly
- State Florida
- 87 Strongly Landlord-Friendly · R+3
- County
- — inherits STATE
- City
- — inherits STATE
ZIP-level market 32507
- Home prices YoY
- -4.6%
- Rents YoY
- 1.2%
- Active inventory
- 702
- Price-to-rent
- 9.7×
Monthly cashflow live
- Estimated rent
- $1,542 high interval (Pro) →
- Mortgage (P&I)
- −$944
- Tax from tax record
- −$127 /mo · $1,526/yr
- Insurance
- −$75
- HOA
- −$0
- Vacancy / Maint / Mgmt
- −$324
- Net cashflow
- $72
Break-even live
UW: 25.0% down · 7.5% · 30yr · 1.5% tax · 5.0% vac · 8.0% maint · 8.0% mgmt
Financing live
Cash to close
- Down payment
- $45,000
- Closing costs
- $5,400
- Reserves months
- —
- Total cash needed
- —
Loan-product check · same deal, 3 products live
Conventional
25% down · 7.5% · 30yr
- Down + closing
- —
- Monthly P&I
- —
- Monthly cashflow
- —
- DSCR
- —
- Eligible?
- —
Personal DTI + credit; lowest rate.
DSCR
20% down · 8.5% · 30yr
- Down + closing
- —
- Monthly P&I
- —
- Monthly cashflow
- —
- DSCR
- —
- Eligible?
- —
No personal income docs; deal must DSCR.
Hard money
10% down · 12.0% · 12mo
- Down + closing
- —
- Monthly P&I
- —
- Monthly cashflow
- —
- DSCR
- —
- Eligible?
- —
Short-term bridge; refi at stabilization.
Rent comps 14 comps
| Address | Beds | Baths | Sqft | Rent | $/sqft | DOM | Units | Dist |
|---|---|---|---|---|---|---|---|---|
| 1120 S Old Corry Field Rd Pensacola, FL | 3.0 | 1.0 | 1000 | $1,295 | $1.29 | 23d | 1 | 0.21mi |
| 99 S 3rd St Unit 3 Pensacola, FL | 2.0 | 1.5 | 900 | $1,259 | $1.40 | 23d | 1 | 0.22mi |
| 7 Mindoro Cir Pensacola, FL | 3.0 | 1.0 | 924 | $1,395 | $1.51 | 23d | 1 | 0.33mi |
| 26 N Lincoln Rd Unit B Pensacola, FL | 2.0 | 1.0 | 759 | $1,050 | $1.38 | 13d | 1 | 0.42mi |
| 405 E Palmetto Ave Pensacola, FL | 2.0 | 1.0 | 900 | $1,800 | $2.00 | 23d | 1 | 0.48mi |
| 45 W Carver Dr Pensacola, FL | 3.0 | 1.0 | 940 | $1,325 | $1.41 | 23d | 1 | 0.51mi |
| 2 E Sunset Ave Unit 3 Pensacola, FL | 2.0 | 1.0 | 806 | $1,350 | $1.67 | 23d | 1 | 0.51mi |
| 1036 Hawthorn Dr Unit B Pensacola, FL | 2.0 | 1.0 | 650 | $800 | $1.23 | 23d | 1 | 0.67mi |
| 102 SE Kalash Rd Pensacola, FL | 4.0 | 2.0 | 1029 | $1,800 | $1.75 | 23d | 1 | 0.95mi |
| 315 Flannan Rd Pensacola, FL | 3.0 | 1.0 | 836 | $1,745 | $2.09 | 13d | 1 | 0.96mi |
| 113 Rue Max St Pensacola, FL | 3.0 | 1.0 | 862 | $1,395 | $1.62 | 23d | 1 | 1.10mi |
| 718 Mills Ave Unit A Pensacola, FL | 2.0 | 1.0 | 728 | $1,200 | $1.65 | 23d | 1 | 1.11mi |
| 190 N Old Corry Field Rd Pensacola, FL | 1.0–2.0 | 1.0–2.0 | 915 | $1,174 | $1.28 | 13d | 3 | 1.39mi |
| 4600 Twin Oaks Dr Pensacola, FL | 1.0–2.0 | 1.0 | 838 | $1,499 | $1.79 | 13d | 29 | 1.46mi |
Listing history 20 events
-
2026-06-18days on market $179,999 Active 62 DOM
-
2026-06-17days on market $179,999 Active 61 DOM
-
2026-06-16days on market $179,999 Active 60 DOM
-
2026-06-15days on market $179,999 Active 59 DOM
-
2026-06-14pricedays on market $179,999 Active 57 DOM
-
2026-06-10days on market $185,000 Active 54 DOM
-
2026-06-09days on market $185,000 Active 53 DOM
-
2026-06-08days on market $185,000 Active 52 DOM
-
2026-06-07days on market $185,000 Active 51 DOM
-
2026-06-03days on market $185,000 Active 47 DOM
-
2026-06-02days on market $185,000 Active 46 DOM
-
2026-06-01days on market $185,000 Active 45 DOM
-
2026-05-31days on market $185,000 Active 44 DOM
-
2026-05-31days on market $185,000 Active 43 DOM
-
2026-05-12price $185,000 595-char remark
Show marketing remark (595 chars)
Completely renovated 3-bedroom, 1-bath cottage ideally located near NAS Pensacola, just 7 minutes from downtown Pensacola and a short drive to both Perdido Key and Pensacola Beach. Situated in the desirable Corry neighborhood, this home is directly across from a well-maintained neighborhood park—perfect for enjoying the outdoors right outside your door. Inside, you’ll find a beautifully updated interior featuring a brand-new kitchen with modern appliances, stylish tiled bathroom, and durable luxury vinyl plank (LVP) flooring throughout. A move-in-ready gem in a prime location!
-
2026-05-12price $180,000 595-char remark
Show marketing remark (595 chars)
Completely renovated 3-bedroom, 1-bath cottage ideally located near NAS Pensacola, just 7 minutes from downtown Pensacola and a short drive to both Perdido Key and Pensacola Beach. Situated in the desirable Corry neighborhood, this home is directly across from a well-maintained neighborhood park—perfect for enjoying the outdoors right outside your door. Inside, you’ll find a beautifully updated interior featuring a brand-new kitchen with modern appliances, stylish tiled bathroom, and durable luxury vinyl plank (LVP) flooring throughout. A move-in-ready gem in a prime location!
-
2026-04-17$190,000 Active 595-char remark
Show marketing remark (595 chars)
Completely renovated 3-bedroom, 1-bath cottage ideally located near NAS Pensacola, just 7 minutes from downtown Pensacola and a short drive to both Perdido Key and Pensacola Beach. Situated in the desirable Corry neighborhood, this home is directly across from a well-maintained neighborhood park—perfect for enjoying the outdoors right outside your door. Inside, you’ll find a beautifully updated interior featuring a brand-new kitchen with modern appliances, stylish tiled bathroom, and durable luxury vinyl plank (LVP) flooring throughout. A move-in-ready gem in a prime location!
-
2017-01-30soldstatus $927,000
-
2006-10-24soldstatus $67,500
-
2006-10-19$67,500
ⓘ Source: listings_history table (triggers on properties + properties_extension) + one-shot
backfill from property_details.listing_events for pre-trigger history.
Tax reassessment forecast FL · Resets to sale price
- Current annual tax
- $1,526 · $127/mo
- Projected year-2 tax
- $1,526 · $127/mo
- Expected delta
- $0/yr ($0/mo · 0.0%)
ⓘ Screening estimate from a state-policy table — verify with the county assessor before closing.
Climate risk First Street
- Flood 1/10 Low FEMA zone X (unshaded) · 0% chance over 30 yrs
- Wildfire 2/10 Low
- Heat 10/10 Extreme 7 d/yr ≥105°F today · 24 d/yr by 30 yrs out
- Wind 9/10 Extreme 99% chance of damaging wind over 30 yrs
- Air quality 1/10 Low 0 unhealthy d/yr today · 0 by 30 yrs out
Nearby sold comps map
Loading sold comps map…
Walkable amenities ~0.75 mi
Loading nearby amenities…
Taxation est. · year 1
- Rental income
- $18,501
- − Mortgage interest
- −$10,083
- − Property taxes
- −$1,526
- − Insurance
- −$900
- − Repairs & maintenance
- −$1,480
- − Management
- −$1,480
- − Depreciation
- −$5,236
- Taxable loss
- −$2,204
- Est. tax savings @ 24.0%
- +$529
- After-tax cash flow
- $1,392/yr
For passive investors: Depreciation is non-cash, so a rental often shows a tax loss while cash-flowing — sheltering income. Rental losses are passive: they offset passive income freely, and up to $25,000/yr can offset ordinary (W-2) income if you actively participate and your MAGI is under $100k (phasing out to $0 by $150k); unused losses carry forward. On sale, claimed depreciation is recaptured at up to 25%, and gains may owe capital-gains tax (a 1031 exchange can defer both). Figures are a year-1 estimate at your 24.0% rate — not tax advice; consult a CPA.
Schools (NCES district)
- District
- Escambia
- NCES district ID
- 1200510
- Math proficiency
- 40% ▼ -9.00%
- Reading proficiency
- 45% ▼ -4.00%
- Median HH income
- $44,649
- Composite
- 36.04/100
- National rank
- #4773
- State rank
- #56 of 73 in FL
Livability — Warrington
- Score
- 65/100
- State rank
- #631
- US rank
- #12396
Category grades
Schools grade is shown separately in the Schools card above.
Census & demographics
- Census place
- Warrington, FL
- County
- Escambia County · 301,722 people
- Metro
- Pensacola-Ferry Pass-Brent, FL
- Population (ZIP)
- 32,226
- Household income
- $73,540
- Rent vs Own
- Severe rent burden
- 1175.0
Population outlook (Escambia County) Hauer SSP2
- Today (2025)
- 334,637 people
- By 2030
- 345,779 · +3.3%
- By 2040
- 364,828 · +9.0%
- By 2050
- 378,514 · +13.1%
- By 2075
- 403,220 · +20.5%
- By 2100
- 386,125 · +15.4%
Race, ethnicity, and origin ACS 2023
- Neighborhood character
- Predominantly White (73%)
- Race & ethnicity
- White 73% Black 10% Two or more races 10% Hispanic / Latino 7% Asian 2%
- Hispanic origin (detail)
- Mexican 3% Puerto Rican 2%
- Common ancestry
- Slovak 3% Lithuanian 2% Romanian 2%
- Foreign-born
- 5% · Canada, Vietnam
- Languages at home
- 92% English-only · Spanish 4% Other Asian/Pacific 1% French/Haitian/Cajun 1%
Political lean MEDSL · Escambia
- 2024 margin
- R (+19.5) · D 39.7% · R 59.2% · Other 1.1%
- 2008→2024 swing
- -0.2pp no change · 2008: -19.3pp · 2024: -19.5pp
- All cycles
- 2024: R+19.5 2020: R+15.1 2016: R+20.6 2012: R+20.6 2008: R+19.3
Not yet ingested
- Civics
- —
Market trends
- HPI YoY
- ▼ -26.23%
- Current HPI
- 548.03
- Rent YoY
- ▲ 1.22%
- Metro
- Pensacola-Ferry Pass-Brent, FL
- State GDP YoY
- ▲ 3.28%
- F500 in state
- 36
Industry mix (Fortune 500 HQ in FL)
| Industry | F500 HQs | Revenue |
|---|---|---|
| Industrial Technology | 2 | $29B |
|
||
| Insurance | 2 | $17B |
|
||
| Retail | 1 | $60B |
|
||
| Technology Distribution | 1 | $58B |
|
||
| Homebuilding | 1 | $35B |
|
||
| Technology Manufacturing | 1 | $35B |
|
||
Price history
+174.1% since first listed6 events — show timeline
- 2026-05-12 Price Changed $185,000 PARMLS
- 2026-05-12 Price Changed $180,000 PARMLS
- 2026-04-17 Listed $190,000 PARMLS
- 2017-01-30 Sold (Public Records) $927,000 Public Records
- 2006-10-24 Sold (Public Records) $67,500 Public Records
- 2006-10-19 Listed $67,500 PARMLS
Property tax history
+8.0%/yrLatest (2025): $1,526 · +17.7% YoY. Source: county tax records.
Cash-flow waterfall
monthlySold comps — $/sqft
last 12 mo · ≤1 miLoading sold comps…