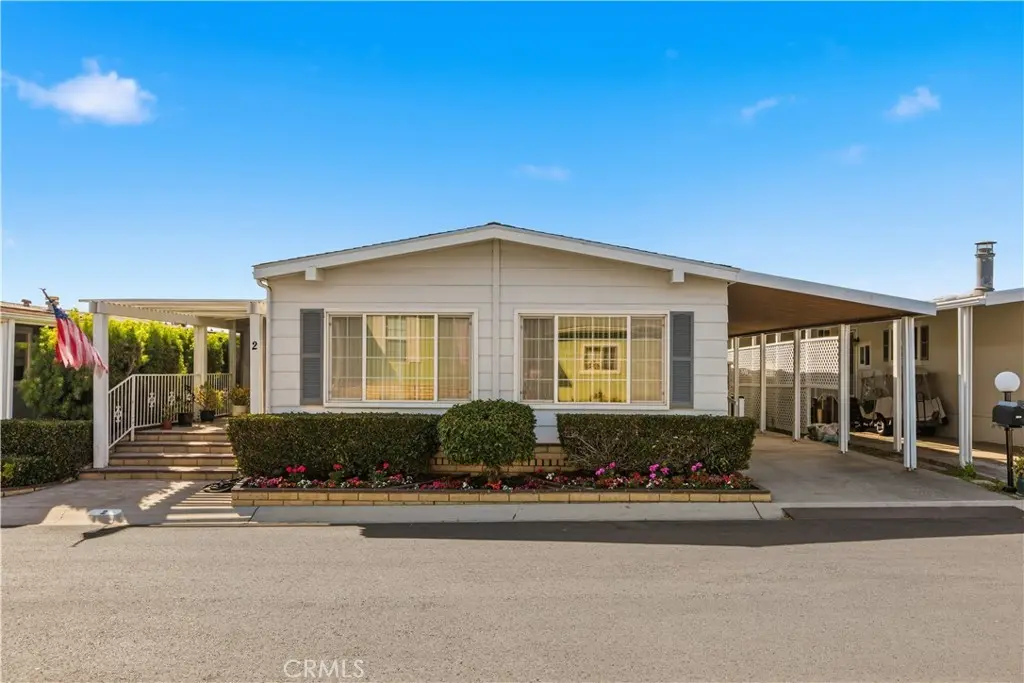
5200 Irvine Blvd., Space 2 · Irvine, CA
Flood risk No data
- FEMA flood zone
- —
- Chance of flooding over 30 yrs
- —
- Est. flood insurance / yr
- —
Fire risk No data
- Est. fire insurance / yr
- —
Heat risk No data
- Hot days now (above threshold)
- —
- Hot days in 30 yrs
- —
Wind risk No data
- Chance of severe wind over 30 yrs
- —
Air-quality risk No data
- Unhealthy air days now
- —
- Unhealthy air days in 30 yrs
- —
Risk factors via First Street. Map © Google.
Why this score? — see what drove the D grade
The composite is a weighted blend of 9 inputs, each scored 0–100. Each bar is that input's sub-score; the figure is the points it added to the 100-point composite (weight × sub-score).
- Cash flow +12.8/30.0
- Schools +6.9/10.0
- Appreciation +6.2/10.0
- DSCR +3.8/10.0
- Livability +3.8/5.0
- 1% rule +3.0/10.0
- ARV discount +3.0/15.0
- Rent growth +2.5/5.0
- Condition / age +2.5/5.0
$529,000
🖨 Deal sheet 📄 Offer letter ✓ Due diligence
Listing remarks
Welcome home to this wonderful light and bright 2-bedroom, 2-bath residence offering 1,536 square feet of comfortable living space in a quiet and desirable location within the community. This well-maintained double-wide home is truly move-in ready, with fresh interior paint and brand-new luxury vinyl flooring throughout. Recent improvements include a new water heater. A spacious screened-in front porch provides the perfect place to enjoy your morning coffee, relax with a good book, or take in the peaceful surroundings year-round. Inside, the open floor plan is filled with natural light, creating a warm and inviting atmosphere. The dedicated laundry room offers ample storage space for added
Key facts
- Secured storage shed
- Double-wide home
- New water heater
Tags
Property features AI
Finance
- Other: Community contains 533 units; Assessor/public records used for lot and year-built info; Special assessments exist
- Financial info: Property is on land-lease purchase
- HOA & community: Part of The Groves association; Monthly association fee; Association fee applies monthly; Association amenities include: clubhouse, pool, spa, gym/exercise room, billiard and card rooms, meeting/banquet facilities, bocce ball, tennis, pickleball, paddle tennis, biking trails, dog park, outdoor cooking and picnic areas, RV parking, storage area, maintenance of grounds, trash and utilities, controlled access, onsite property management, pet rules (pets permitted), and more; Senior community
Exterior
- Parking: Attached carport; 2 uncovered parking spaces (total 2 parking spaces)
- Security: Gated community with attendant; Controlled access; Resident manager; Card/code access; Smoke detector; Carbon monoxide detector(s); Onsite property management; Guard
- Utilities: District / public water; Public sewer (sewer connected); Natural gas connected; Electricity connected (standard); Telephone in street; Cable available; Hot water available
- Home design: Manufactured house; Single-story; Entry at level 1 via porch and carport; Planned development; No common walls; Turnkey condition; No ADU
- Construction: Raised foundation with pier jacks; Composition roof; Built by Silvercrest IND (builder model unknown)
- Exterior features: Covered front porch; Screened porch; Rain gutters; Shed; Landscaped grounds; Private maintained road frontage; Community heated in-ground pool and spa (saltwater, solar heat, exercise pool); Patio
Interior
- Kitchen: Gas cooktop; Built-in range; Range/stove hood; Dishwasher; Garbage disposal; Breakfast counter / bar; Formal dining room; Kitchen open to family room; Tile counters
- Bedrooms: 2 bedrooms on the main level
- Flooring: Vinyl flooring
- Bathrooms: 2 main-level bathrooms; Soaking tub; Bathtub; Shower; Double sinks in primary bath; Vanity area; Linen closet / storage
- Heating & cooling: Central heating (furnace); Central cooling
- Interior features: Pantry; Storage space; Tile counters; Sliding glass doors; Double pane windows; No interior steps; Ramp to main level; One-level living; Turnkey condition; Main-level primary bedroom; Separate family room; Living room; Family room; Primary bathroom; Laundry room
- Laundry & utility: Individual laundry room; Washer and dryer excluded from sale
Neighborhood map
What this means for you Summary
Snapshot
- This is a 2-bed/2.0-bath manufactured listed at $529k.
Deal economics
- At list price, monthly cash flow is $-47 ($-565/yr) — negative.
- To cash-flow at today's rent, offer at most $521k (1.6% below list).
- To meet the 1% rule (rent ≥ 1% of price), the offer needs to be $422k (20.3% below list).
- Recommended offer: $422k (20.3% below list) — sets the bar for 1% rule.
- Cap rate 6.2% vs local median 1.2% in Irvine — top-decile yield for the area; either an underpriced asset or a hidden risk that comps aren't pricing in. Stress-test before assuming the spread holds.
Location & tenants
- Location reads 76/100 on livability (#100 in CA, #3,537 nationally) — a middle-class / working-renter tenant base. Strengths: schools A+, crime A+, commute A+; Watch: health & safety C-, cost of living F.
- Irvine Unified (urban): math 74% / reading 80% proficiency, ranked #31 of 517 in CA (top 6%) — strong family-tenant draw, lease renewals of 3-5y typical; only 10% free/reduced lunch — higher-income household profile.
- Market conditions: Rents flat; 144 active listings in the ZIP; 40 comparable units currently listed for rent nearby; rentals at typical pace (median 24d on market — plan ~3-4 weeks tenant-placement turnaround); high-income renter base; 6,974 units permitted in Orange County in 2024 (3,839 in 5+ unit buildings).
- This rent runs 34% of the median local income ($147k/yr) — at the standard rent-burdened threshold; future hikes will face affordability resistance.
Forward outlook
- In year one you build about $17k of equity ($4k loan paydown + $13k appreciation (2.5% local appreciation)).
- Orange County population projected at +14% by 2050 — modest demand growth; plan on rents tracking national, not racing it.
- At projected returns (2.5% appreciation + 0.1% rent growth), your $148k cash investment doubles in ~9 years — after that, you're playing with house money.
- By year 3, paydown + projected appreciation supports a ~$42k cash-out refi (75% LTV) — recoverable capital for the next deal without selling this one.
Negotiation context
- Only 9 days on market — expect competitive offers; lowballing is unlikely to land.
Questions for the listing agent
- What do current leases actually rent for vs. the listed asking? Can we see a recent rent roll and the last 12 months of T-12 income?
- Built in 1978 — when were the roof, HVAC, electrical panel, plumbing, and water heater last replaced?
- What does the HOA fee cover, when was the last increase, and are there any pending special assessments or reserve-fund shortfalls?
- Is there a deadline driving the sale (1031 exchange, divorce, estate, relocation)? That informs how much negotiation room exists.
- Schools are A-rated — typically a magnet for longer-tenancy family renters. What's the average tenant stay here, and is there a school-zone premium baked into asking?
- The area grade is low — what's the realistic commute time and amenity access for the typical tenant pool here? Any planned neighborhood developments (good or bad) we should know about?
- What's the average days-on-market for RENTAL listings here right now (not sales)? A rising rental-DOM trend means longer vacancies and softer asking-rent achievability than the comps imply.
- What's the recent tenant-quality profile in this submarket — average credit score on applications, eviction rate, late-payment / NSF rate, and stable-employment percentage? A property-management company in the area should have these aggregated.
- How much new for-sale + rental construction is in the pipeline within 1–3 miles? Heavy new supply typically softens prices + rents 12–24 months out; constrained supply supports both.
Investment metrics
- 1% rule
- 0.80% ✗
- Cap rate
- 6.19%
- Cash-on-cash
- -0.38%
- DSCR
- 0.98
- GRM
- 10.5
CMA / ARV
- ARV (on-the-fly)
- $480,768
- Comps found
- 12
Show comp detail 12 sales within ~0.75 mi
| Address | Dist | Beds/Ba | Sqft | Sold | Price | $/sf | Match |
|---|---|---|---|---|---|---|---|
| 5200 Irvine #109 | 0.24mi | 2/2.0 | 1,536 (0%) | 0mo | $689,000 | $449 | 88 |
| 5200 Irvine Blvd #505 | 0.00mi | 2/2.0 | 1,440 (-6%) | 4mo | $600,000 | $417 | 86 |
| 5200 Irvine Blvd #360 | 0.00mi | 2/2.0 | 1,680 (+9%) | 2mo | $430,000 | $256 | 83 |
| 5200 Irvine Blvd #331 | 0.00mi | 2/2.0 | 1,440 (-6%) | 9mo | $450,000 | $313 | 82 |
| 5200 Irvine Blvd #156 | 0.24mi | 2/2.0 | 1,440 (-6%) | 1mo | $535,000 | $372 | 77 |
| 5200 Irvine Blvd #399 | 0.00mi | 2/2.0 | 1,740 (+13%) | 1mo | $528,000 | $303 | 77 |
| 5200 Irvine Blvd. Space 250 | 0.24mi | 2/2.0 | 1,440 (-6%) | 2mo | $395,000 | $274 | 77 |
| 5200 Irvine Blvd #123 | 0.24mi | 2/2.0 | 1,440 (-6%) | 2mo | $405,000 | $281 | 76 |
| 5200 Irvine Blvd #131 | 0.24mi | 2/2.0 | 1,440 (-6%) | 4mo | $529,000 | $367 | 75 |
| 5200 Irvine Blvd #469 | 0.00mi | 2/2.0 | 1,750 (+14%) | 5mo | $540,000 | $309 | 73 |
| 5200 Irvine Blvd #237 | 0.24mi | 2/2.0 | 1,680 (+9%) | 9mo | $460,000 | $274 | 65 |
| 5200 Irvine Blvd Spc 218 | 0.24mi | 2/2.0 | 1,740 (+13%) | 8mo | $590,000 | $339 | 60 |
Match score weights: distance 35% · size 25% · config 20% · recency 20%. Top-matched comps best support the ARV.
Projected returns pro-forma
2.48% appreciation · 0.13% rent growth · sell at horizon
- IRR
- 4.2%
- Equity multiple
- 1.23×
- Total profit
- $34,418
- Equity at exit
- $222,577
- IRR
- 6.4%
- Equity multiple
- 1.88×
- Total profit
- $130,876
- Equity at exit
- $331,578
Cash invested: $148,120 (down + closing). Projections, not guarantees.
Landlord ↔ Tenant lean methodology
- Overall (STATE)
- 18 Strongly Tenant-Friendly
- State California
- 18 Strongly Tenant-Friendly · D+13
- County
- — inherits STATE
- City
- — inherits STATE
ZIP-level market 92620
- Home prices YoY
- 0.5%
- Rents YoY
- 0.1%
- Active inventory
- 144
- Price-to-rent
- 10.5×
Monthly cashflow live
- Estimated rent
- $4,217 high interval (Pro) →
- Mortgage (P&I)
- −$2,774
- Tax from tax record
- −$95 /mo · $1,139/yr
- Insurance
- −$220
- HOA
- −$289
- Vacancy / Maint / Mgmt
- −$886
- Net cashflow
- $-47
Break-even live
UW: 25.0% down · 7.5% · 30yr · 1.5% tax · 5.0% vac · 8.0% maint · 8.0% mgmt
Financing live
Cash to close
- Down payment
- $132,250
- Closing costs
- $15,870
- Reserves months
- —
- Total cash needed
- —
Loan-product check · same deal, 3 products live
Conventional
25% down · 7.5% · 30yr
- Down + closing
- —
- Monthly P&I
- —
- Monthly cashflow
- —
- DSCR
- —
- Eligible?
- —
Personal DTI + credit; lowest rate.
DSCR
20% down · 8.5% · 30yr
- Down + closing
- —
- Monthly P&I
- —
- Monthly cashflow
- —
- DSCR
- —
- Eligible?
- —
No personal income docs; deal must DSCR.
Hard money
10% down · 12.0% · 12mo
- Down + closing
- —
- Monthly P&I
- —
- Monthly cashflow
- —
- DSCR
- —
- Eligible?
- —
Short-term bridge; refi at stabilization.
Rent comps 40 comps
| Address | Beds | Baths | Sqft | Rent | $/sqft | DOM | Units | Dist |
|---|---|---|---|---|---|---|---|---|
| 136 Bishop Lndg Irvine, CA | 2.0 | 2.0 | 1539 | $4,300 | $2.79 | 24d | 1 | 0.17mi |
| 238 Bishop Lndg Unit NA Irvine, CA | 2.0 | 2.0 | 1539 | $4,300 | $2.79 | 24d | 1 | 0.21mi |
| 238 Bishop Lndg Irvine, CA | 2.0 | 2.0 | 1539 | $4,300 | $2.79 | 24d | 1 | 0.21mi |
| 101 Thornhurst Irvine, CA | 3.0 | 3.0 | 1614 | $12,000 | $7.43 | 21d | 1 | 0.26mi |
| 101 Thornhurst Irvine, CA | 3.0 | 3.0 | 1518 | $14,400 | $9.49 | 24d | 1 | 0.26mi |
| 112 Breakwater Irvine, CA | 3.0 | 2.5 | 1632 | $4,700 | $2.88 | 20d | 1 | 0.31mi |
| 112 Breakwater Irvine, CA | 3.0 | 3.0 | 1632 | $4,700 | $2.88 | 15d | 1 | 0.31mi |
| 103 Oasis Irvine, CA | 3.0 | 2.5 | 1654 | $5,000 | $3.02 | 3d | 1 | 0.34mi |
| 117 Henson Irvine, CA | 3.0 | 2.5 | 1724 | $5,300 | $3.07 | 18d | 1 | 0.41mi |
| 98 Devonshire Irvine, CA | 3.0 | 2.5 | 1861 | $5,100 | $2.74 | 10d | 1 | 0.42mi |
| 63 Darby Irvine, CA | 3.0 | 2.5 | 1753 | $5,500 | $3.14 | 17d | 1 | 0.44mi |
| 100 Simplicity Irvine, CA | 1.0–2.0 | 1.0–2.0 | 954 | $3,575 | $3.75 | 3d | 22 | 0.51mi |
| 122 Overbrook Irvine, CA | 2.0 | 2.0 | 1129 | $3,600 | $3.19 | 43d | 1 | 0.52mi |
| 162 Overbrook Irvine, CA | 2.0 | 2.0 | 1129 | $4,200 | $3.72 | 43d | 1 | 0.52mi |
| 92 Rinaldi Irvine, CA | 3.0 | 3.0 | 2152 | $4,950 | $2.30 | 24d | 1 | 0.52mi |
| 88 Parkwood Irvine, CA | 3.0 | 2.0 | 1532 | $4,580 | $2.99 | 43d | 1 | 0.54mi |
| 224 Overbrook Irvine, CA | 3.0 | 3.0 | 1518 | $4,500 | $2.96 | 4d | 1 | 0.56mi |
| 40 Lakepines Irvine, CA | 2.0 | 1.5 | 1204 | $3,300 | $2.74 | 18d | 1 | 0.59mi |
| 215 Groveland Irvine, CA | 3.0 | 2.5 | 1987 | $4,500 | $2.26 | 24d | 1 | 0.60mi |
| 20 Lakepines Irvine, CA | 2.0 | 1.5 | 1204 | $3,300 | $2.74 | 17d | 1 | 0.62mi |
| 49 Concierto Irvine, CA | 3.0 | 2.5 | 1808 | $4,500 | $2.49 | 24d | 1 | 0.63mi |
| 49 Concierto Irvine, CA | 2.0 | 2.5 | 1808 | $4,500 | $2.49 | 21d | 1 | 0.63mi |
| 70 Kempton Irvine, CA | 2.0 | 1.5 | 1129 | $3,600 | $3.19 | 43d | 1 | 0.64mi |
| 50 Vintage Irvine, CA | 3.0 | 3.0 | 1792 | $4,400 | $2.46 | 17d | 1 | 0.64mi |
| 8 Iceberg Rose Irvine, CA | 2.0 | 2.5 | 1170 | $4,050 | $3.46 | 43d | 1 | 0.67mi |
| 76 Great Lawn Irvine, CA | 2.0 | 2.5 | 1154 | $3,800 | $3.29 | 5d | 1 | 0.68mi |
| 39 Costa Brava Irvine, CA | 2.0 | 2.5 | 1170 | $4,000 | $3.42 | 24d | 1 | 0.69mi |
| 66 Gust Irvine, CA | 3.0 | 2.5 | 1902 | $5,200 | $2.73 | 7d | 1 | 0.70mi |
| 37 Spanish Lace Irvine, CA | 1.0 | 2.0 | 1100 | $3,000 | $2.73 | 43d | 1 | 0.70mi |
| 33 Richmond Irvine, CA | 3.0 | 2.0 | 1370 | $4,100 | $2.99 | 1d | 1 | 0.71mi |
| 41 Bamboo Irvine, CA | 3.0 | 3.5 | 1600 | $4,200 | $2.62 | 24d | 1 | 0.71mi |
| 33 Iceberg Rose Irvine, CA | 2.0 | 2.0 | 1106 | $3,500 | $3.16 | 43d | 1 | 0.72mi |
| 19 Fulton Irvine, CA | 2.0 | 2.0 | 1475 | $4,500 | $3.05 | 18d | 1 | 0.72mi |
| 17 City Stroll Irvine, CA | 2.0 | 2.5 | 1842 | $4,500 | $2.44 | 24d | 1 | 0.75mi |
| 56 Quentin Irvine, CA | 3.0 | 2.5 | 1971 | $5,295 | $2.69 | 24d | 1 | 0.76mi |
| 48 Nature Irvine, CA | 2.0 | 2.0 | 1550 | $4,600 | $2.97 | 3d | 1 | 0.77mi |
| 67 Nature Irvine, CA | 3.0 | 2.5 | 1734 | $4,500 | $2.60 | 43d | 1 | 0.77mi |
| 100 Mirasol Irvine, CA | 1.0–2.0 | 1.0–2.0 | 987 | $3,710 | $3.76 | 2d | 19 | 0.79mi |
| 42 Talisman Irvine, CA | 2.0 | 2.0 | 1165 | $3,700 | $3.18 | 2d | 1 | 0.86mi |
| 3 Delamesa W Irvine, CA | 3.0 | 2.5 | 1915 | $4,300 | $2.25 | 43d | 1 | 0.89mi |
HOA detail
- Monthly dues
- $289 · $3,468/yr
- Likely covers
- water
Listing history 8 events
-
2026-06-18days on market $529,000 Active 9 DOM
-
2026-06-17days on market $529,000 Active 8 DOM
-
2026-06-16days on market $529,000 Active 7 DOM
-
2026-06-15days on market $529,000 Active 6 DOM
-
2026-06-13days on market $529,000 Active 4 DOM
-
2026-06-13days on market $529,000 Active 3 DOM
-
2026-06-10remarks 699-char remark
-
2026-06-10$529,000 Active 1 DOM
ⓘ Source: listings_history table (triggers on properties + properties_extension) + one-shot
backfill from property_details.listing_events for pre-trigger history.
Tax reassessment forecast CA · Resets to sale price
- Current annual tax
- $1,139 · $95/mo
- Projected year-2 tax
- $4,020 · $335/mo
- Expected delta
- +$2,882/yr (+$240/mo · 253.0%)
ⓘ Screening estimate from a state-policy table — verify with the county assessor before closing.
Nearby sold comps map
Loading sold comps map…
Walkable amenities ~0.75 mi
Loading nearby amenities…
Taxation est. · year 1
- Rental income
- $50,604
- − Mortgage interest
- −$29,632
- − Property taxes
- −$1,139
- − Insurance
- −$2,645
- − Repairs & maintenance
- −$4,048
- − Management
- −$4,048
- − HOA
- −$3,468
- − Depreciation
- −$15,389
- Taxable loss
- −$9,766
- Est. tax savings @ 24.0%
- +$2,344
- After-tax cash flow
- $1,779/yr
For passive investors: Depreciation is non-cash, so a rental often shows a tax loss while cash-flowing — sheltering income. Rental losses are passive: they offset passive income freely, and up to $25,000/yr can offset ordinary (W-2) income if you actively participate and your MAGI is under $100k (phasing out to $0 by $150k); unused losses carry forward. On sale, claimed depreciation is recaptured at up to 25%, and gains may owe capital-gains tax (a 1031 exchange can defer both). Figures are a year-1 estimate at your 24.0% rate — not tax advice; consult a CPA.
Schools (NCES district)
- District
- Irvine Unified
- NCES district ID
- 0684500
- Math proficiency
- 74% ▲ 1.00%
- Reading proficiency
- 80% ▲ 3.00%
- Median HH income
- $92,078
- Composite
- 69.17/100
- National rank
- #319
- State rank
- #31 of 517 in CA
Livability — Irvine
- Score
- 76/100
- State rank
- #100
- US rank
- #3537
Category grades
Schools grade is shown separately in the Schools card above.
Census & demographics
- Census place
- Irvine, CA
- County
- Orange County · 3,096,323 people
- City population
- 287,839
- Metro
- Los Angeles-Long Beach-Anaheim, CA
- Population (ZIP)
- 61,631
- Household income
- $146,942
- Rent vs Own
- Severe rent burden
- 2240.0
Population outlook (Orange County) Hauer SSP2
- Today (2025)
- 3,477,456 people
- By 2030
- 3,613,117 · +3.9%
- By 2040
- 3,835,945 · +10.3%
- By 2050
- 3,968,736 · +14.1%
- By 2075
- 4,097,053 · +17.8%
- By 2100
- 3,903,633 · +12.3%
Race, ethnicity, and origin ACS 2023
- Neighborhood character
- Diverse neighborhood (Simpson 0.58)
- Race & ethnicity
- Asian 59% White 26% Two or more races 9% Hispanic / Latino 8% Black 1%
- Hispanic origin (detail)
- Mexican 6%
- Common ancestry
- Scotch-Irish 1% Italian 1% Romanian 1%
- Foreign-born
- 43% · China, South Korea, Vietnam
- Languages at home
- 45% English-only · Chinese 21% Other Indo-European 10% Korean 8%
Political lean MEDSL · Orange
- 2024 margin
- Toss-up / Even · D 49.7% · R 47.1% · Other 3.2%
- 2008→2024 swing
- +5.2pp toward D · 2008: -2.6pp · 2024: 2.6pp
- All cycles
- 2024: D+2.6 2020: D+9.0 2016: D+7.7 2012: R+8.3 2008: R+2.6
Not yet ingested
- Civics
- —
Market trends
- HPI YoY
- ▲ 2.48%
- Current HPI
- 499.7012
- Rent YoY
- ▲ 0.13%
- Metro
- Los Angeles-Long Beach-Anaheim, CA
- State GDP YoY
- ▲ 3.21%
- F500 in state
- 116
Industry mix (Fortune 500 HQ in CA)
| Industry | F500 HQs | Revenue |
|---|---|---|
| Technology | 27 | $1,492B |
|
||
| Financial Services | 3 | $174B |
|
||
| Retail | 3 | $44B |
|
||
| Insurance | 3 | $26B |
|
||
| Media / Entertainment | 2 | $115B |
|
||
| Pharmaceuticals / Biotech | 2 | $62B |
|
||
Price history
1 event — show timeline
- 2026-06-09 Listed $529,000 CRMLS
Property tax history
+2.0%/yrLatest (2025): $1,139 · +2.8% YoY. Source: county tax records.
Cash-flow waterfall
monthlySold comps — $/sqft
last 12 mo · ≤1 miLoading sold comps…