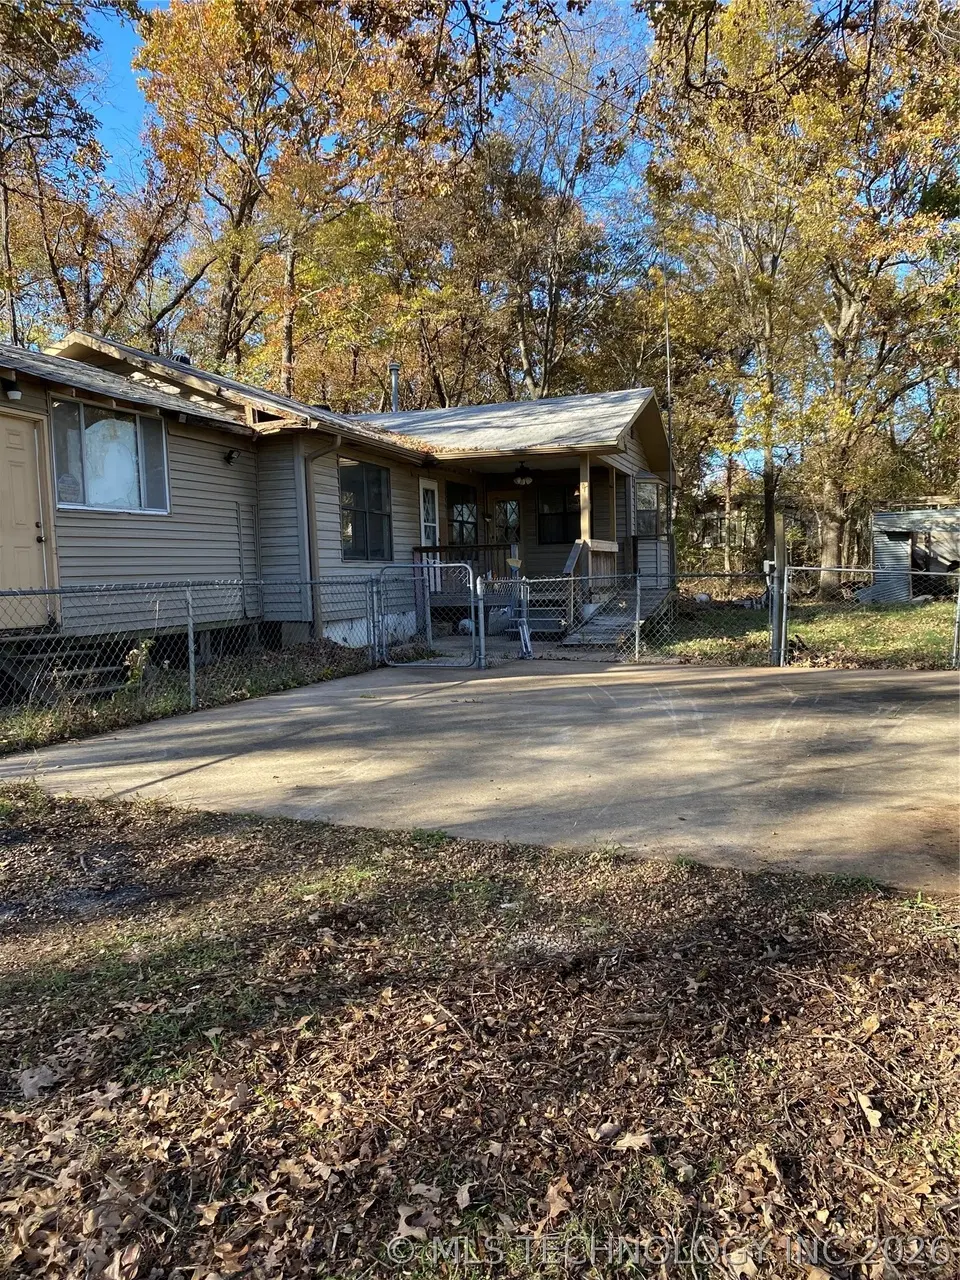
30487 S 552 Rd · Cookson, OK
Flood risk 1/10 · Minimal
- FEMA flood zone
- X (unshaded)
- Chance of flooding over 30 yrs
- 0.0%
- Est. flood insurance / yr
- $507 – $1,088
Fire risk 5/10 · Moderate
- Est. fire insurance / yr
- $2,463 – $4,575
Heat risk 6/10 · Moderate
- Hot days now (above 110°F)
- 7 days/yr
- Hot days in 30 yrs
- 20 days/yr
Wind risk 2/10 · Minimal
- Chance of severe wind over 30 yrs
- 3.0%
Air-quality risk 2/10 · Minimal
- Unhealthy air days now
- 1 days/yr
- Unhealthy air days in 30 yrs
- 1 days/yr
Risk factors via First Street. Map © Google.
Why this score? — see what drove the B grade
The composite is a weighted blend of 9 inputs, each scored 0–100. Each bar is that input's sub-score; the figure is the points it added to the 100-point composite (weight × sub-score).
- Cash flow +27.8/30.0
- DSCR +9.8/10.0
- ARV discount +7.5/15.0
- Appreciation +7.3/10.0
- 1% rule +7.2/10.0
- Schools +3.4/10.0
- Rent growth +2.5/5.0
- Livability +2.5/5.0
- Condition / age +2.5/5.0
$90,000
🖨 Deal sheet (PDF) 📄 Offer letter ✓ Due diligence
Listing remarks
Get ready for boat season by putting your handyman skills to use this winter! This property offers just over an acre and is approximately a mile from public lake access at Lake Tenkiller, complete with a boat ramp and picnic tables. The 1 bed, 1 bath home boasts updates like new electrical, laminate flooring, a remodeled tile bathroom, newer kitchen cabinets, and a newer hot water tank. An added space could easily be finished into a large master bedroom or a second living area. Plus, it’s only 15 miles from Tahlequah for convenient shopping.
Key facts
- Picnic tables
- New hot water tank
- Public lake access
Tags
Property features AI
Exterior
- Parking: Dirt driveway
- Security: No safety shelter
- Utilities: Electricity available; Phone available; Water available (rural); Septic tank
- Home design: Single-story; Faces west; Crawlspace foundation
- Construction: Vinyl siding; Wood frame construction; Asphalt/fiberglass roof; Built per public records
- Exterior features: Covered porch; Dirt driveway; Partial chain link fencing; Corner lot; Mature trees; Boat ramp/lift access to Tenkiller Lake; Horses allowed
Interior
- Kitchen: Laminate counters; Electric oven/range connection
- Flooring: Tile; Vinyl
- Bathrooms: 1 full bathroom
- Heating & cooling: Central heating; Propane heating; Central air conditioning
- Interior features: Ceiling fan(s); Laminate counters; Electric oven/range connection
- Laundry & utility: Washer hookup; Electric dryer hookup
Neighborhood map
What this means for you Summary
Snapshot
- This is a 3-bed/2.0-bath single-family listed at $90k.
Deal economics
- At list price, monthly cash flow is $274 ($3k/yr) — positive.
- The deal already cash-flows at list — no discount required.
- Meets the 1% rule at list price ($1k rent vs $90k).
- Recommended offer: $89k (1.5% below list) — sets the bar for market timing.
- Cap rate 9.9% vs local median 1.8% in Cookson — top-decile yield for the area; either an underpriced asset or a hidden risk that comps aren't pricing in. Stress-test before assuming the spread holds.
Location & tenants
- Location reads: area grade B — affects rentability + tenant quality, not the cash-flow math above.
- Keys (rural): math 39% / reading 40% proficiency, ranked #19 of 270 in OK (top 7%) — families likely to look elsewhere, expect single-tenant / working-renter base with shorter leases.
- Market conditions: 106 active listings in the ZIP; 48 units permitted in Cherokee County in 2024 (0 in 5+ unit buildings).
Forward outlook
- In year one you build about $5k of equity ($622 loan paydown + $4k appreciation (4.7% local appreciation)).
- Cherokee County population projected at +15% by 2050 — modest demand growth; plan on rents tracking national, not racing it.
- At projected returns (4.7% appreciation + 3.0% rent growth), your $25k cash investment doubles in ~3 years — after that, you're playing with house money.
- By year 7, paydown + projected appreciation supports a ~$31k cash-out refi (75% LTV) — recoverable capital for the next deal without selling this one.
Negotiation context
- It's been on market 18 days — a 2% lower offer ($89k) is reasonable based on typical stale-listing flexibility.
- 3 sale attempts since 3y ago; this cycle's ask has dropped $35k (28%) from the opening price — seller is motivated, your offer sets the floor, not the list.
- Current owner paid $30k; list at $90k implies a 200% gain — meaningful room to come down on a strong offer.
Risks & watch-outs
- Climate carrying-cost: moderate wildfire risk; extreme-heat days projected 7→20/yr by 2055 (HVAC capex compounding) — expect insurance premiums to compound above CPI over the hold.
Questions for the listing agent
- Built in 1970 — when were the roof, HVAC, electrical panel, plumbing, and water heater last replaced?
- Is there a deadline driving the sale (1031 exchange, divorce, estate, relocation)? That informs how much negotiation room exists.
- What's the average days-on-market for RENTAL listings here right now (not sales)? A rising rental-DOM trend means longer vacancies and softer asking-rent achievability than the comps imply.
- What's the recent tenant-quality profile in this submarket — average credit score on applications, eviction rate, late-payment / NSF rate, and stable-employment percentage? A property-management company in the area should have these aggregated.
- How much new for-sale + rental construction is in the pipeline within 1–3 miles? Heavy new supply typically softens prices + rents 12–24 months out; constrained supply supports both.
Investment metrics
- 1% rule
- 1.22% ✓
- Cap rate
- 9.95%
- Cash-on-cash
- 13.06%
- DSCR
- 1.58
- GRM
- 6.8
CMA / ARV
- ARV (on-the-fly)
- $181,500
- Comps found
- 1
Show comp detail 1 sale within ~0.75 mi
| Address | Dist | Beds/Ba | Sqft | Sold | Price | $/sf | Match |
|---|---|---|---|---|---|---|---|
| 21245 W 888 Rd | 0.72mi | 4/2.0 (+1) | 1,480 (-1%) | 19mo | $179,000 | $121 | 43 |
Match score weights: distance 35% · size 25% · config 20% · recency 20%. Top-matched comps best support the ARV.
Projected returns pro-forma
4.68% appreciation · 3.0% rent growth · sell at horizon
- IRR
- 23.5%
- Equity multiple
- 2.45×
- Total profit
- $36,571
- Equity at exit
- $49,262
- IRR
- 23.0%
- Equity multiple
- 4.82×
- Total profit
- $96,278
- Equity at exit
- $83,614
Cash invested: $25,200 (down + closing). Projections, not guarantees.
Landlord ↔ Tenant lean methodology
- Overall (STATE)
- 83 Strongly Landlord-Friendly
- State Oklahoma
- 83 Strongly Landlord-Friendly · R+20
- County
- — inherits STATE
- City
- — inherits STATE
ZIP-level market 74427
- Home prices YoY
- 1.6%
- Active inventory
- 106
- Price-to-rent
- 6.8×
Monthly cashflow live
- Estimated rent
- $1,102 medium interval (Pro) →
- Mortgage (P&I)
- −$472
- Tax from tax record
- −$87 /mo · $1,041/yr
- Insurance
- −$38
- HOA
- −$0
- Vacancy / Maint / Mgmt
- −$231
- Net cashflow
- $274
Break-even live
Sensitivity live
| Price | -10% $325 | -5% $300 | +0% $274 | +5% $249 | +10% $223 |
|---|---|---|---|---|---|
| Rent | -10% $187 | -5% $231 | +0% $274 | +5% $318 | +10% $361 |
| Rate | -1.0pp $319 | -0.5pp $297 | base $274 | +0.5pp $251 | +1.0pp $227 |
UW: 25.0% down · 7.5% · 30yr · 1.5% tax · 5.0% vac · 8.0% maint · 8.0% mgmt
Financing live
Cash to close
- Down payment
- $22,500
- Closing costs
- $2,700
- Reserves months
- —
- Total cash needed
- —
Loan-product check · same deal, 3 products live
Conventional
25% down · 7.5% · 30yr
- Down + closing
- —
- Monthly P&I
- —
- Monthly cashflow
- —
- DSCR
- —
- Eligible?
- —
Personal DTI + credit; lowest rate.
DSCR
20% down · 8.5% · 30yr
- Down + closing
- —
- Monthly P&I
- —
- Monthly cashflow
- —
- DSCR
- —
- Eligible?
- —
No personal income docs; deal must DSCR.
Hard money
10% down · 12.0% · 12mo
- Down + closing
- —
- Monthly P&I
- —
- Monthly cashflow
- —
- DSCR
- —
- Eligible?
- —
Short-term bridge; refi at stabilization.
Listing history 22 events
-
2026-06-19days on market $90,000 Active 18 DOM
-
2026-06-18days on market $90,000 Active 17 DOM
-
2026-06-17days on market $90,000 Active 16 DOM
-
2026-06-16days on market $90,000 Active 15 DOM
-
2026-06-15days on market $90,000 Active 14 DOM
-
2026-06-14days on market $90,000 Active 12 DOM
-
2026-06-12pricedays on market $90,000 Active 11 DOM
-
2026-06-09days on market $110,000 Active 8 DOM
-
2026-06-08days on market $110,000 Active 7 DOM
-
2026-06-07days on market $110,000 Active 6 DOM
-
2026-06-05days on market $110,000 Active 3 DOM
-
2026-06-01pricedays on market $110,000 Active 1 DOM
-
2026-05-31days on market $120,000 Active 177 DOM
-
2026-05-30days on market $120,000 Active 176 DOM
-
2026-03-20price $120,000
-
2026-03-20price $12,000
-
2025-12-05$125,000 Active
-
2023-06-06status Active
-
2023-06-06historical
-
2023-04-27status Pending
-
2023-04-19$72,000 Active
-
1998-01-07soldstatus $30,000
ⓘ Source: listings_history table (triggers on properties + properties_extension) + one-shot
backfill from property_details.listing_events for pre-trigger history.
Tax reassessment forecast OK · Resets to sale price
- Current annual tax
- $1,041 · $87/mo
- Projected year-2 tax
- $1,041 · $87/mo
- Expected delta
- $0/yr ($0/mo · 0.0%)
ⓘ Screening estimate from a state-policy table — verify with the county assessor before closing.
Climate risk First Street
- Flood 1/10 Low FEMA zone X (unshaded) · 0% chance over 30 yrs
- Wildfire 5/10 Major
- Heat 6/10 Major 7 d/yr ≥110°F today · 20 d/yr by 30 yrs out
- Wind 2/10 Low 3% chance of damaging wind over 30 yrs
- Air quality 2/10 Low 1 unhealthy d/yr today · 1 by 30 yrs out
Nearby sold comps map
Loading sold comps map…
Walkable amenities ~0.75 mi
Loading nearby amenities…
Taxation est. · year 1
- Rental income
- $13,221
- − Mortgage interest
- −$5,041
- − Property taxes
- −$1,041
- − Insurance
- −$450
- − Repairs & maintenance
- −$1,058
- − Management
- −$1,058
- − Depreciation
- −$2,618
- Taxable income
- $1,955
- Est. tax owed @ 24.0%
- −$469
- After-tax cash flow
- $2,821/yr
For passive investors: Depreciation is non-cash, so a rental often shows a tax loss while cash-flowing — sheltering income. Rental losses are passive: they offset passive income freely, and up to $25,000/yr can offset ordinary (W-2) income if you actively participate and your MAGI is under $100k (phasing out to $0 by $150k); unused losses carry forward. On sale, claimed depreciation is recaptured at up to 25%, and gains may owe capital-gains tax (a 1031 exchange can defer both). Figures are a year-1 estimate at your 24.0% rate — not tax advice; consult a CPA.
Schools (NCES district)
- District
- Keys
- NCES district ID
- 4000033
- Math proficiency
- 39% ▼ -2.00%
- Reading proficiency
- 40% ▲ 4.00%
- Median HH income
- $46,426
- Composite
- 33.74/100
- National rank
- #5370
- State rank
- #19 of 270 in OK
Livability — Cookson
No livability data for this city. (Only ~50 U.S. cities are tracked.)
Census & demographics
- Census place
- Cookson, OK
- Population (ZIP)
- 1,332
Population outlook (Cherokee County) Hauer SSP2
- Today (2025)
- 51,747 people
- By 2030
- 53,481 · +3.4%
- By 2040
- 56,503 · +9.2%
- By 2050
- 59,370 · +14.7%
- By 2075
- 67,178 · +29.8%
- By 2100
- 70,900 · +37.0%
Race, ethnicity, and origin ACS 2023
- Neighborhood character
- Predominantly White (75%)
- Race & ethnicity
- White 75% Two or more races 16% Native American 9%
- Common ancestry
- Slovak 4% Iranian 3% Lithuanian 1%
- Foreign-born
- 1% · China
- Languages at home
- 98% English-only · Spanish 1% Chinese 1%
Political lean MEDSL · Cherokee
- 2024 margin
- Solid R (+32.6) · D 32.7% · R 65.3% · Other 2.0%
- 2008→2024 swing
- -20.4pp toward R · 2008: -12.2pp · 2024: -32.6pp
- All cycles
- 2024: R+32.6 2020: R+29.3 2016: R+27.5 2012: R+14.1 2008: R+12.2
Not yet ingested
- Civics
- —
Market trends
- HPI YoY
- ▲ 4.68%
- Current HPI
- 288.6235
- Rent YoY
- —
- Metro
- —
- State GDP YoY
- ▲ 1.55%
- F500 in state
- 6
Industry mix (Fortune 500 HQ in OK)
| Industry | F500 HQs | Revenue |
|---|---|---|
| Energy | 3 | $48B |
|
||
Price history
+300.0% since first listed8 events — show timeline
- 2026-03-20 Price Changed $120,000 MLS Technology, Inc.
- 2026-03-20 Price Changed $12,000 MLS Technology, Inc.
- 2025-12-05 Listed $125,000 MLS Technology, Inc.
- 2023-06-06 Relisted — MLS Technology, Inc.
- 2023-06-06 Listing Removed — MLS Technology, Inc.
- 2023-04-27 Pending — MLS Technology, Inc.
- 2023-04-19 Listed $72,000 MLS Technology, Inc.
- 1998-01-07 Sold (Public Records) $30,000 Public Records
Property tax history
+12.3%/yrLatest (2025): $1,041 · +4.9% YoY. Source: county tax records.
Cash-flow waterfall
monthlySold comps — $/sqft
last 12 mo · ≤1 miLoading sold comps…