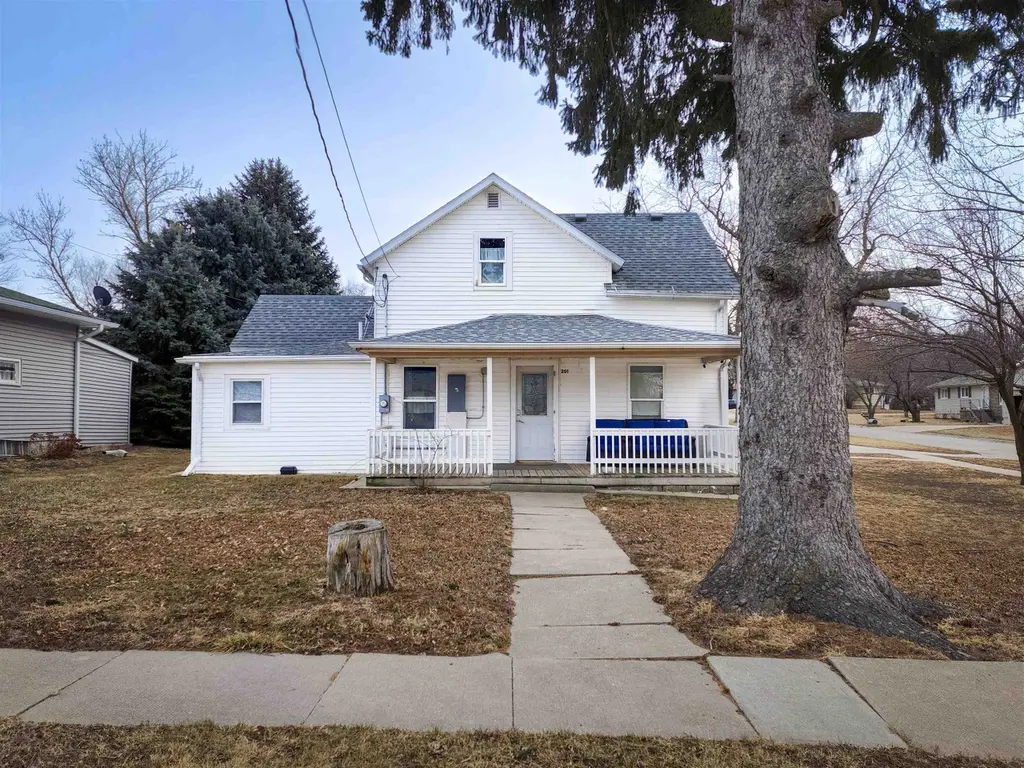
201 9th St · Madison, NE
Flood risk 1/10 · Minimal
- FEMA flood zone
- X (unshaded)
- Chance of flooding over 30 yrs
- 0.0%
- Est. flood insurance / yr
- $507 – $1,088
Fire risk 2/10 · Minimal
- Est. fire insurance / yr
- $1,161 – $2,155
Heat risk 2/10 · Minimal
- Hot days now (above 101°F)
- 7 days/yr
- Hot days in 30 yrs
- 16 days/yr
Wind risk 2/10 · Minimal
- Chance of severe wind over 30 yrs
- —
Air-quality risk 2/10 · Minimal
- Unhealthy air days now
- 1 days/yr
- Unhealthy air days in 30 yrs
- 1 days/yr
Risk factors via First Street. Map © Google.
Why this score? — see what drove the D grade
The composite is a weighted blend of 9 inputs, each scored 0–100. Each bar is that input's sub-score; the figure is the points it added to the 100-point composite (weight × sub-score).
- Cash flow +12.0/30.0
- ARV discount +8.7/15.0
- Appreciation +6.9/10.0
- Livability +3.6/5.0
- DSCR +3.5/10.0
- 1% rule +2.6/10.0
- Rent growth +2.5/5.0
- Condition / age +2.5/5.0
- Schools +2.2/10.0
$169,500
🖨 Deal sheet (PDF) 📄 Offer letter ✓ Due diligence
Listing remarks MLS
This cozy four-bedroom, one-bath home sits on a desirable corner lot in a quiet neighborhood. Offering comfortable living space with a functional layout, the home features a convenient carport and plenty of natural light throughout. The corner lot provides added privacy and outdoor space, perfect for relaxing or entertaining. A great opportunity for anyone looking for an inviting home in a peaceful setting.
Key facts
- 0.23 acre lot
- Built 1906
- Listed 146 days
Neighborhood map
What this means for you Summary
Snapshot
- This is a 4-bed/1.0-bath single-family listed at $170k.
Deal economics
- At list price, monthly cash flow is $-41 ($-497/yr) — negative.
- To cash-flow at today's rent, offer at most $162k (4.3% below list).
- To meet the 1% rule (rent ≥ 1% of price), the offer needs to be $129k (23.6% below list).
- Recommended offer: $129k (23.6% below list) — sets the bar for 1% rule.
Location & tenants
- Location reads 71/100 on livability (#193 in NE) — a middle-class / working-renter tenant base. Strengths: crime A+, cost of living A+, housing A+; Watch: employment C-, amenities F, commute F.
- Madison Public Schools (rural): math 22% / reading 27% proficiency, ranked #109 of 111 in NE (top 98%) — low school quality limits family demand, transient renter base, plan for 1-2y turnover.
- Zoned schools: Madison Elementary School (math 22% / reading 27%, grade F, #445 of 502 statewide, top 91%, 210 students, 68% FRL); Madison Middle School (math 17% / reading 22%, grade F, #121 of 128 statewide, top 95%, 106 students, 73% FRL); Madison High School (math 34% / reading 34%, grade F, #208 of 261 statewide, top 86%, 160 students, 61% FRL).
- Market conditions: 14 active listings in the ZIP; 270 units permitted in Madison County in 2024 (196 in 5+ unit buildings).
Forward outlook
- In year one you build about $8k of equity ($1k loan paydown + $7k appreciation (3.9% local appreciation)).
- At projected returns (3.9% appreciation + 3.0% rent growth), your $47k cash investment doubles in ~6 years — after that, you're playing with house money.
- By year 5, paydown + projected appreciation supports a ~$33k cash-out refi (75% LTV) — recoverable capital for the next deal without selling this one.
Negotiation context
- It's been on market 147 days — a 12% lower offer ($149k) is reasonable based on typical stale-listing flexibility.
- 2 sale attempts since 7y ago; this cycle's ask has dropped $10k (6%) from the opening price — seller is motivated, your offer sets the floor, not the list.
- Current owner paid $88k; list at $170k implies a 93% gain — meaningful room to come down on a strong offer.
Risks & watch-outs
- Watch-outs: built in 1906 — expect roof / HVAC / electrical / plumbing capex.
Questions for the listing agent
- What do current leases actually rent for vs. the listed asking? Can we see a recent rent roll and the last 12 months of T-12 income?
- It's been on market 147 days. Have you received any prior offers? Is the seller open to a 24% concession, seller financing, or rate buy-down credit?
- Built in 1906 — when were the roof, HVAC, electrical panel, plumbing, and water heater last replaced?
- Why hasn't it sold? Are there any deal-killer items the seller is aware of (foundation, flood, title, zoning, code violations)?
- Is there a deadline driving the sale (1031 exchange, divorce, estate, relocation)? That informs how much negotiation room exists.
- Schools are D-rated, which usually means shorter tenancies and higher turnover. Who's the typical renter profile here, and what's been the actual vacancy rate?
- The area grade is low — what's the realistic commute time and amenity access for the typical tenant pool here? Any planned neighborhood developments (good or bad) we should know about?
- What's the average days-on-market for RENTAL listings here right now (not sales)? A rising rental-DOM trend means longer vacancies and softer asking-rent achievability than the comps imply.
- What's the recent tenant-quality profile in this submarket — average credit score on applications, eviction rate, late-payment / NSF rate, and stable-employment percentage? A property-management company in the area should have these aggregated.
- How much new for-sale + rental construction is in the pipeline within 1–3 miles? Heavy new supply typically softens prices + rents 12–24 months out; constrained supply supports both.
Investment metrics
- 1% rule
- 0.76% ✗
- Cap rate
- 6.00%
- Cash-on-cash
- -1.05%
- DSCR
- 0.95
- GRM
- 10.9
CMA / ARV
- ARV (median comp)
- $174,111
- List price
- $169,500
- Delta
- -2.65%
- Verdict
- FAIR
- Comps
- 20 within 1.0 mi
Show comp detail 5 sales within ~0.75 mi
| Address | Dist | Beds/Ba | Sqft | Sold | Price | $/sf | Match |
|---|---|---|---|---|---|---|---|
| 606 Lincoln St | 0.22mi | 3/1.0 (-1) | 1,470 (-8%) | 6mo | $168,500 | $115 | 66 |
| 806 Orchard St | 0.07mi | 4/2.0 | 1,764 (+10%) | 16mo | $175,000 | $99 | 62 |
| 408 7th St | 0.35mi | 4/2.0 | 1,444 (-10%) | 9mo | $175,000 | $121 | 56 |
| 307 3rd St | 0.41mi | 3/1.0 (-1) | 1,474 (-8%) | 9mo | $165,000 | $112 | 55 |
| 403 Lincoln St | 0.36mi | 4/2.0 | 1,424 (-11%) | 11mo | $155,000 | $109 | 52 |
Match score weights: distance 35% · size 25% · config 20% · recency 20%. Top-matched comps best support the ARV.
Projected returns pro-forma
3.85% appreciation · 3.0% rent growth · sell at horizon
- IRR
- 8.9%
- Equity multiple
- 1.54×
- Total profit
- $25,495
- Equity at exit
- $84,471
- IRR
- 11.0%
- Equity multiple
- 2.79×
- Total profit
- $85,164
- Equity at exit
- $137,001
Cash invested: $47,460 (down + closing). Projections, not guarantees.
Landlord ↔ Tenant lean methodology
- Overall (STATE)
- 83 Strongly Landlord-Friendly
- State Nebraska
- 83 Strongly Landlord-Friendly · R+13
- County
- — inherits STATE
- City
- — inherits STATE
ZIP-level market 68748
- Home prices YoY
- 1.5%
- Active inventory
- 14
- Price-to-rent
- 10.9×
Monthly cashflow live
- Estimated rent
- $1,295 medium interval (Pro) →
- Mortgage (P&I)
- −$889
- Tax from tax record
- −$105 /mo · $1,255/yr
- Insurance
- −$71
- HOA
- −$0
- Vacancy / Maint / Mgmt
- −$272
- Net cashflow
- $-41
Break-even live
Sensitivity live
| Price | -10% $55 | -5% $7 | +0% $-41 | +5% $-89 | +10% $-137 |
|---|---|---|---|---|---|
| Rent | -10% $-144 | -5% $-93 | +0% $-41 | +5% $10 | +10% $61 |
| Rate | -1.0pp $44 | -0.5pp $2 | base $-41 | +0.5pp $-85 | +1.0pp $-130 |
UW: 25.0% down · 7.5% · 30yr · 1.5% tax · 5.0% vac · 8.0% maint · 8.0% mgmt
Financing live
Cash to close
- Down payment
- $42,375
- Closing costs
- $5,085
- Reserves months
- —
- Total cash needed
- —
Loan-product check · same deal, 3 products live
Conventional
25% down · 7.5% · 30yr
- Down + closing
- —
- Monthly P&I
- —
- Monthly cashflow
- —
- DSCR
- —
- Eligible?
- —
Personal DTI + credit; lowest rate.
DSCR
20% down · 8.5% · 30yr
- Down + closing
- —
- Monthly P&I
- —
- Monthly cashflow
- —
- DSCR
- —
- Eligible?
- —
No personal income docs; deal must DSCR.
Hard money
10% down · 12.0% · 12mo
- Down + closing
- —
- Monthly P&I
- —
- Monthly cashflow
- —
- DSCR
- —
- Eligible?
- —
Short-term bridge; refi at stabilization.
Listing history 26 events
-
2026-06-22days on market $169,500 Active 147 DOM
-
2026-06-21days on market $169,500 Active 146 DOM
-
2026-06-19days on market $169,500 Active 144 DOM
-
2026-06-18days on market $169,500 Active 143 DOM
-
2026-06-17days on market $169,500 Active 142 DOM
-
2026-06-16days on market $169,500 Active 141 DOM
-
2026-06-15days on market $169,500 Active 140 DOM
-
2026-06-14days on market $169,500 Active 138 DOM
-
2026-06-12days on market $169,500 Active 137 DOM
-
2026-06-09days on market $169,500 Active 134 DOM
-
2026-06-08days on market $169,500 Active 133 DOM
-
2026-06-07days on market $169,500 Active 132 DOM
-
2026-06-05days on market $169,500 Active 129 DOM
-
2026-06-03days on market $169,500 Active 128 DOM
-
2026-06-02days on market $169,500 Active 127 DOM
-
2026-06-01days on market $169,500 Active 126 DOM
-
2026-05-31days on market $169,500 Active 125 DOM
-
2026-05-30days on market $169,500 Active 124 DOM
-
2026-02-27price $169,500 410-char remark
Show marketing remark (410 chars)
This cozy four-bedroom, one-bath home sits on a desirable corner lot in a quiet neighborhood. Offering comfortable living space with a functional layout, the home features a convenient carport and plenty of natural light throughout. The corner lot provides added privacy and outdoor space, perfect for relaxing or entertaining. A great opportunity for anyone looking for an inviting home in a peaceful setting.
-
2026-01-26$179,900 Active 410-char remark
Show marketing remark (410 chars)
This cozy four-bedroom, one-bath home sits on a desirable corner lot in a quiet neighborhood. Offering comfortable living space with a functional layout, the home features a convenient carport and plenty of natural light throughout. The corner lot provides added privacy and outdoor space, perfect for relaxing or entertaining. A great opportunity for anyone looking for an inviting home in a peaceful setting.
-
2019-06-17soldstatus $88,000
-
2019-06-14soldstatus $88,000 170-char remark
Show marketing remark (170 chars)
Nice 4 bedroom, 1 bath home with updated kitchen and bath. Laundry room main level. Newer roof and furnace/central air. Washer and dryer stay. Call agent for appointment.
-
2019-05-08$87,900 170-char remark
Show marketing remark (170 chars)
Nice 4 bedroom, 1 bath home with updated kitchen and bath. Laundry room main level. Newer roof and furnace/central air. Washer and dryer stay. Call agent for appointment.
-
2016-08-12soldstatus $54,000
-
2009-11-01soldstatus $23,000
-
2001-02-01soldstatus $25,000
ⓘ Source: listings_history table (triggers on properties + properties_extension) + one-shot
backfill from property_details.listing_events for pre-trigger history.
Tax reassessment forecast NE · Resets to sale price
- Current annual tax
- $1,255 · $105/mo
- Projected year-2 tax
- $2,932 · $244/mo
- Expected delta
- +$1,677/yr (+$140/mo · 133.6%)
ⓘ Screening estimate from a state-policy table — verify with the county assessor before closing.
Climate risk First Street
- Flood 1/10 Low FEMA zone X (unshaded) · 0% chance over 30 yrs
- Wildfire 2/10 Low
- Heat 2/10 Low 7 d/yr ≥101°F today · 16 d/yr by 30 yrs out
- Wind 2/10 Low
- Air quality 2/10 Low 1 unhealthy d/yr today · 1 by 30 yrs out
Nearby sold comps map
Loading sold comps map…
Walkable amenities ~0.75 mi
Loading nearby amenities…
Taxation est. · year 1
- Rental income
- $15,534
- − Mortgage interest
- −$9,495
- − Property taxes
- −$1,255
- − Insurance
- −$848
- − Repairs & maintenance
- −$1,243
- − Management
- −$1,243
- − Depreciation
- −$4,931
- Taxable loss
- −$3,479
- Est. tax savings @ 24.0%
- +$835
- After-tax cash flow
- $338/yr
For passive investors: Depreciation is non-cash, so a rental often shows a tax loss while cash-flowing — sheltering income. Rental losses are passive: they offset passive income freely, and up to $25,000/yr can offset ordinary (W-2) income if you actively participate and your MAGI is under $100k (phasing out to $0 by $150k); unused losses carry forward. On sale, claimed depreciation is recaptured at up to 25%, and gains may owe capital-gains tax (a 1031 exchange can defer both). Figures are a year-1 estimate at your 24.0% rate — not tax advice; consult a CPA.
Schools (NCES district)
- District
- Madison Public Schools
- NCES district ID
- 3173230
- Math proficiency
- 22% ▼ -7.00%
- Reading proficiency
- 27% ▼ -7.00%
- Median HH income
- $51,419
- Composite
- 21.76/100
- National rank
- #8259
- State rank
- #109 of 111 in NE
Livability — Madison
- Score
- 71/100
- State rank
- #193
- US rank
- #6785
Category grades
Schools grade is shown separately in the Schools card above.
Census & demographics
- Census place
- Madison, NE
- Population (ZIP)
- 2,698
Population outlook (Madison County) Hauer SSP2
- Today (2025)
- 35,536 people
- By 2030
- 35,518 · -0.1%
- By 2040
- 35,170 · -1.0%
- By 2050
- 34,606 · -2.6%
- By 2075
- 34,522 · -2.9%
- By 2100
- 34,307 · -3.5%
Race, ethnicity, and origin ACS 2023
- Neighborhood character
- Diverse neighborhood (Simpson 0.56)
- Race & ethnicity
- White 47% Hispanic / Latino 46% Two or more races 20% Asian 5% Native American 5%
- Hispanic origin (detail)
- Mexican 34% Cuban 3%
- Common ancestry
- Italian 2% Portuguese 1% Iranian 1%
- Foreign-born
- 24% · Canada, Philippines, South Korea
- Languages at home
- 57% English-only · Spanish 38% Other Asian/Pacific 3% Korean 2%
Political lean MEDSL · Madison
- 2024 margin
- Solid R (+56.0) · D 21.4% · R 77.4% · Other 1.2%
- 2008→2024 swing
- -16.8pp toward R · 2008: -39.2pp · 2024: -56.0pp
- All cycles
- 2024: R+56.0 2020: R+53.5 2016: R+56.3 2012: R+48.1 2008: R+39.2
Not yet ingested
- Civics
- —
Market trends
- HPI YoY
- ▲ 3.85%
- Current HPI
- 261.8142
- Rent YoY
- —
- Metro
- —
- State GDP YoY
- ▲ 0.68%
- F500 in state
- 2
Industry mix (Fortune 500 HQ in NE)
| Industry | F500 HQs | Revenue |
|---|---|---|
| Conglomerate | 1 | $371B |
|
||
Price history
+578.0% since first listed8 events — show timeline
- 2026-02-27 Price Changed $169,500 NNEMLS
- 2026-01-26 Listed $179,900 NNEMLS
- 2019-06-17 Sold (Public Records) $88,000 Public Records
- 2019-06-14 Sold (MLS) $88,000 NNEMLS
- 2019-05-08 Listed $87,900 NNEMLS
- 2016-08-12 Sold (Public Records) $54,000 Public Records
- 2009-11-01 Sold (Public Records) $23,000 Public Records
- 2001-02-01 Sold (Public Records) $25,000 Public Records
Property tax history
+6.8%/yrLatest (2025): $1,255 · +8.7% YoY. Source: county tax records.
Cash-flow waterfall
monthlySold comps — $/sqft
last 12 mo · ≤1 miLoading sold comps…