5155 Europa Dr Unit U · Boynton Beach, FL
Flood risk 1/10 · Minimal
- FEMA flood zone
- X (unshaded)
- Chance of flooding over 30 yrs
- 0.0%
- Est. flood insurance / yr
- $507 – $1,088
Fire risk 1/10 · Minimal
- Est. fire insurance / yr
- $947 – $1,759
Heat risk 9/10 · Severe
- Hot days now (above 106°F)
- 7 days/yr
- Hot days in 30 yrs
- 23 days/yr
Wind risk 10/10 · Severe
- Chance of severe wind over 30 yrs
- 99.0%
Air-quality risk 2/10 · Minimal
- Unhealthy air days now
- 1 days/yr
- Unhealthy air days in 30 yrs
- 2 days/yr
Risk factors via First Street. Map © Google.
Why this score? — see what drove the D- grade
The composite is a weighted blend of 9 inputs, each scored 0–100. Each bar is that input's sub-score; the figure is the points it added to the 100-point composite (weight × sub-score).
- ARV discount +7.5/15.0
- 1% rule +5.3/10.0
- Appreciation +4.9/10.0
- Cash flow +4.4/30.0
- Schools +4.3/10.0
- Livability +3.6/5.0
- Rent growth +2.8/5.0
- Condition / age +2.5/5.0
- DSCR +0.0/10.0
$269,000
🖨 Deal sheet 📄 Offer letter ✓ Due diligence
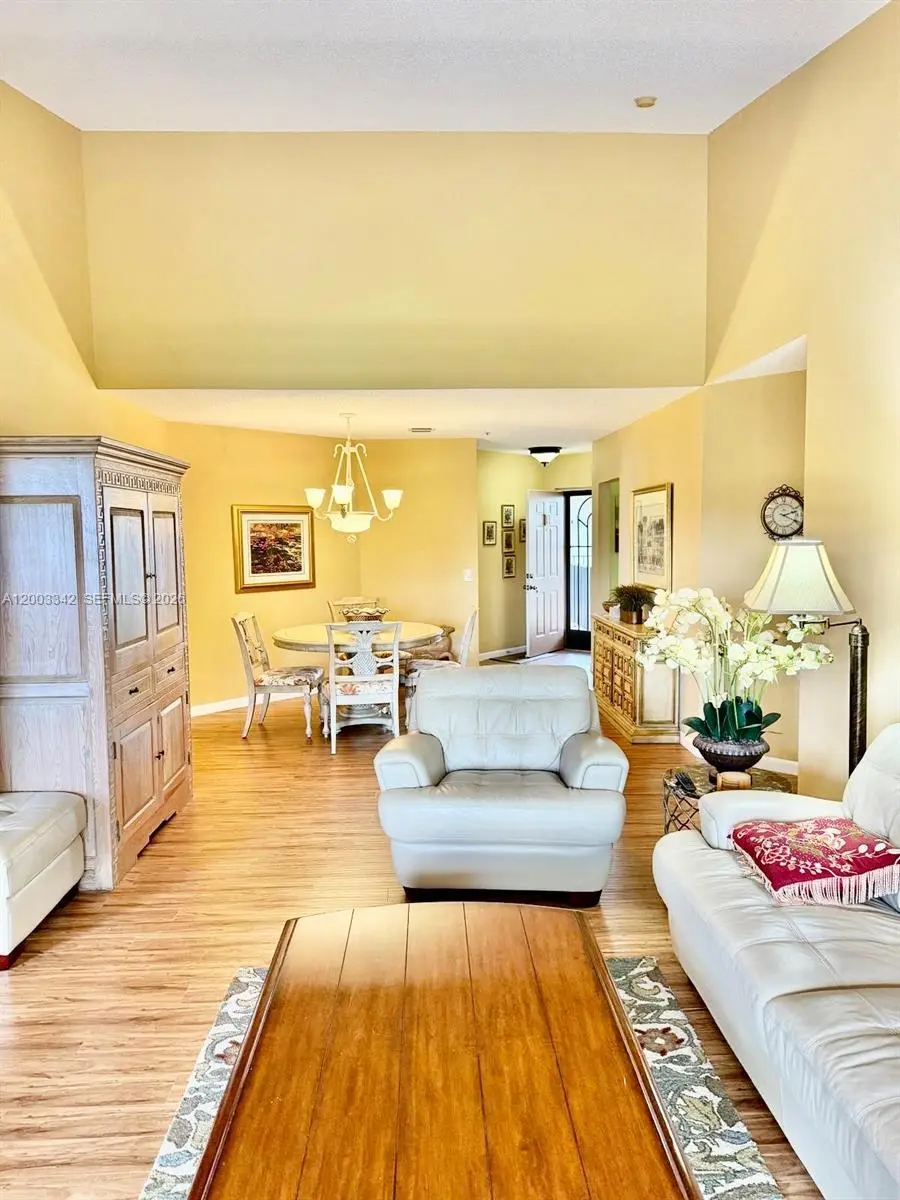
Listing remarks
Beautifully renovated 3-bedroom penthouse in the highly sought-after Platina community, offering the perfect blend of luxury, comfort, and lifestyle. This top-floor residence features soaring ceilings and an open-concept living and dining area filled with natural light, creating a bright and spacious feel throughout. The updated interior includes modern finishes and a well-designed layout ideal for both everyday living and entertaining. Enjoy breathtaking lake views from your private balcony—perfect for morning coffee or unwinding at sunset—with the same serene scenery visible from all bedrooms. The expansive primary suite offers a true retreat with generous space and a beautifu
Key facts
- Gated community
- Renovated penthouse
- Private balcony
Tags
Property features AI
Finance
- Other: Association-maintained heated pool
- Financial info: Pets not allowed
- HOA & community: Monthly association fee; Association fee covers amenities, common areas, cable TV, grounds maintenance, parking, pest control, pool(s), security, and trash; Community amenities include cabana, clubhouse, community kitchen, fitness center, hobby room, pickleball, pool, tennis courts, and elevators
Exterior
- Parking: One parking space
- Security: Security guard; Smoke detectors
- Utilities: Cable available
- Home design: Attached property; 3 stories; Entry on third floor
- Construction: Block construction; Resale property
- Exterior features: Balcony; Glass-enclosed balcony; Porch; Screened porch; Has view; Complex fenced; Exterior lighting
Interior
- Kitchen: Built-in oven; Electric range; Microwave; Dishwasher; Refrigerator
- Flooring: Ceramic tile; Laminate
- Bathrooms: 2 full bathrooms
- Heating & cooling: Central heating; Central air conditioning
- Interior features: Blinds on windows; Eat-in kitchen; Combined family and dining area; Tub with shower; Elevator access; Third-floor entry
- Laundry & utility: Washer hookup; Dryer hookup; Washer; Dryer; Utility room; Laundry room
Neighborhood map
What this means for you Summary
Snapshot
- This is a 3-bed/2.0-bath condo listed at $269k.
Deal economics
- At list price, monthly cash flow is $-705 ($-8k/yr) — negative.
- The deal already cash-flows at list — no discount required.
- Meets the 1% rule at list price ($3k rent vs $269k).
- Recommended offer: $261k (3.0% below list) — sets the bar for market timing.
- Cap rate 3.1% vs local median 4.3% in Boynton Beach — below-typical yield; the buyer is paying a premium for something (appreciation thesis, condition, location) that the cap rate doesn't capture.
Location & tenants
- Location reads 72/100 on livability (#351 in FL) — a middle-class / working-renter tenant base. Strengths: housing A+, health & safety B+, cost of living B; Watch: amenities D+, crime D-, commute F.
- Palm Beach (suburban): math 46% / reading 53% proficiency, ranked #34 of 73 in FL (top 47%) — families likely to look elsewhere, expect single-tenant / working-renter base with shorter leases.
- Market conditions: Rents rising (+1.3%/yr); 479 active listings in the ZIP; 30 comparable units currently listed for rent nearby; rentals at typical pace (median 24d on market — plan ~3-4 weeks tenant-placement turnaround); solid renter incomes; 3,974 units permitted in Palm Beach County in 2024 (1,012 in 5+ unit buildings).
- This rent runs 41% of the median local income ($81k/yr) — at the standard rent-burdened threshold; future hikes will face affordability resistance.
Forward outlook
- In year one you build about $1k of equity ($2k loan paydown + $-650 appreciation (-0.2% local appreciation)).
- Palm Beach County population projected at +30% by 2050 — long-run rental-demand tailwind backs the buy-and-hold thesis.
Negotiation context
- It's been on market 60 days — a 3% lower offer ($261k) is reasonable based on typical stale-listing flexibility.
- 5 sale attempts since 2y ago; this cycle's ask is 9507% above the opening price — seller raised mid-cycle; expect resistance to lowballs.
- Current owner paid $154k; list at $269k implies a 75% gain — meaningful room to come down on a strong offer.
Risks & watch-outs
- Watch-outs: HOA is 39% of rent.
- Climate carrying-cost: severe wind risk, 99% chance of damaging wind over 30y; extreme-heat days projected 7→23/yr by 2055 (HVAC capex compounding) — expect insurance premiums to compound above CPI over the hold.
Questions for the listing agent
- What do current leases actually rent for vs. the listed asking? Can we see a recent rent roll and the last 12 months of T-12 income?
- It's been on market 60 days. Have you received any prior offers? Is the seller open to a 3% concession, seller financing, or rate buy-down credit?
- What does the HOA fee cover, when was the last increase, and are there any pending special assessments or reserve-fund shortfalls?
- Any open or pending special assessments — roof, HVAC, plumbing, elevator, façade? What's the per-unit balance and payoff schedule, and is the seller paying it off at close or rolling it to the buyer?
- Is there a deadline driving the sale (1031 exchange, divorce, estate, relocation)? That informs how much negotiation room exists.
- Crime grade is D in this area — have there been break-ins, vandalism, or insurance claims at this property in the last 3 years? What carrier currently insures it and at what premium?
- The area grade is low — what's the realistic commute time and amenity access for the typical tenant pool here? Any planned neighborhood developments (good or bad) we should know about?
- What's the average days-on-market for RENTAL listings here right now (not sales)? A rising rental-DOM trend means longer vacancies and softer asking-rent achievability than the comps imply.
- What's the recent tenant-quality profile in this submarket — average credit score on applications, eviction rate, late-payment / NSF rate, and stable-employment percentage? A property-management company in the area should have these aggregated.
- How much new apartment / multifamily construction is in the pipeline within 1–3 miles? Heavy new supply (>2% of stock underway) typically softens rents 12–24 months out; light construction supports rent growth.
Investment metrics
- 1% rule
- 1.03% ✓
- Cap rate
- 3.15%
- Cash-on-cash
- -11.24%
- DSCR
- 0.50
- GRM
- 8.1
CMA / ARV
No comps found within radius.
Projected returns pro-forma
-0.24% appreciation · 1.28% rent growth · sell at horizon
- IRR
- -17.8%
- Equity multiple
- 0.20×
- Total profit
- $-59,882
- Equity at exit
- $74,874
- IRR
- -13.1%
- Equity multiple
- -0.25×
- Total profit
- $-94,071
- Equity at exit
- $87,460
Cash invested: $75,320 (down + closing). Projections, not guarantees.
Landlord ↔ Tenant lean methodology
- Overall (STATE)
- 87 Strongly Landlord-Friendly
- State Florida
- 87 Strongly Landlord-Friendly · R+3
- County
- — inherits STATE
- City
- — inherits STATE
ZIP-level market 33437
- Home prices YoY
- -0.1%
- Rents YoY
- 1.3%
- Active inventory
- 479
- Price-to-rent
- 8.1×
Monthly cashflow live
- Estimated rent
- $2,778 high interval (Pro) →
- Mortgage (P&I)
- −$1,411
- Tax from tax record
- −$307 /mo · $3,689/yr
- Insurance
- −$112
- HOA est. from 2 same-building comps
- −$1,070
- Vacancy / Maint / Mgmt
- −$583
- Net cashflow
- $-705
Break-even live
UW: 25.0% down · 7.5% · 30yr · 1.5% tax · 5.0% vac · 8.0% maint · 8.0% mgmt
Financing live
Cash to close
- Down payment
- $67,250
- Closing costs
- $8,070
- Reserves months
- —
- Total cash needed
- —
Loan-product check · same deal, 3 products live
Conventional
25% down · 7.5% · 30yr
- Down + closing
- —
- Monthly P&I
- —
- Monthly cashflow
- —
- DSCR
- —
- Eligible?
- —
Personal DTI + credit; lowest rate.
DSCR
20% down · 8.5% · 30yr
- Down + closing
- —
- Monthly P&I
- —
- Monthly cashflow
- —
- DSCR
- —
- Eligible?
- —
No personal income docs; deal must DSCR.
Hard money
10% down · 12.0% · 12mo
- Down + closing
- —
- Monthly P&I
- —
- Monthly cashflow
- —
- DSCR
- —
- Eligible?
- —
Short-term bridge; refi at stabilization.
Rent comps 30 comps
| Address | Beds | Baths | Sqft | Rent | $/sqft | DOM | Units | Dist |
|---|---|---|---|---|---|---|---|---|
| 5155 Europa Dr Unit J Boynton Beach, FL | 3.0 | 2.0 | 1333 | $2,750 | $2.06 | 24d | 1 | 0.02mi |
| 5157 Floria Way Unit J Boynton Beach, FL | 3.0 | 2.0 | 1447 | $3,300 | $2.28 | 24d | 1 | 0.14mi |
| 5133 Brisata Cir Unit P Boynton Beach, FL | 3.0 | 2.0 | 1374 | $2,800 | $2.04 | 24d | 1 | 0.20mi |
| 9498 S Military Trl #5 Boynton Beach, FL | 3.0 | 2.5 | 1317 | $2,900 | $2.20 | 24d | 1 | 0.24mi |
| 5373 Mirror Lakes Blvd Boynton Beach, FL | 3.0 | 2.0 | 1310 | $2,100 | $1.60 | 24d | 1 | 0.33mi |
| 5418 Firenze Dr Unit P Boynton Beach, FL | 2.0 | 2.0 | 1139 | $2,400 | $2.11 | 2d | 1 | 0.34mi |
| 5275 Europa Dr Unit I Boynton Beach, FL | 3.0 | 2.0 | 1282 | $2,500 | $1.95 | 1d | 1 | 0.34mi |
| 9935 Pineapple Tree Dr #202 Boynton Beach, FL | 2.0 | 2.0 | 1008 | $2,575 | $2.55 | 14d | 1 | 0.45mi |
| 9900 Pineapple Tree Dr #106 Boynton Beach, FL | 2.0 | 2.0 | 1008 | $2,250 | $2.23 | 24d | 1 | 0.49mi |
| 10492 Boynton Place Cir Boynton Beach, FL | 1.0–3.0 | 1.0–2.0 | 1017 | $2,839 | $2.79 | 1d | 19 | 0.66mi |
| 10187 Mangrove Dr #104 Boynton Beach, FL | 2.0 | 2.0 | 1260 | $2,350 | $1.87 | 24d | 1 | 0.66mi |
| 10056 Boynton Place Cir Boynton Beach, FL | 3.0 | 2.0 | 1253 | $3,000 | $2.39 | 24d | 1 | 0.67mi |
| 10056 Boynton Place Cir Boynton Beach, FL | 3.0 | 2.0 | 1253 | $2,950 | $2.35 | 1d | 1 | 0.67mi |
| 4525 Nutmeg Tree Ln Unit A Boynton Beach, FL | 2.0 | 2.0 | 1404 | $3,000 | $2.14 | 24d | 1 | 0.72mi |
| 5217 Cedar Lake Rd Boynton Beach, FL | 1.0–3.0 | 1.0–2.0 | 1030 | $2,811 | $2.73 | 1d | 51 | 0.74mi |
| 5020 Ashley Lake Dr Boynton Beach, FL | 2.0 | 2.0 | 1002 | $2,394 | $2.39 | 2d | 1 | 0.74mi |
| 5020 Ashley Lake Dr Boynton Beach, FL | 2.0 | 2.0 | 1002 | $2,346 | $2.34 | 13d | 1 | 0.74mi |
| 10423 Boynton Place Cir Boynton Beach, FL | 2.0 | 1.0 | 861 | $2,200 | $2.56 | 18d | 1 | 0.75mi |
| 10423 Boynton Place Cir Boynton Beach, FL | 2.0 | 1.0 | 861 | $2,200 | $2.56 | 7d | 1 | 0.75mi |
| 4944 Equestrian Cir Unit A Boynton Beach, FL | 2.0 | 2.0 | 1400 | $2,500 | $1.79 | 7d | 1 | 0.78mi |
| 5724 Boynton Cres Boynton Beach, FL | 2.0 | 1.0 | 861 | $2,300 | $2.67 | 24d | 1 | 0.87mi |
| 5895 Autumn Lake Ln Unit A Boynton Beach, FL | 3.0 | 2.0 | 1469 | $2,600 | $1.77 | 24d | 1 | 0.92mi |
| 10592 Tropic Palm Ave #202 Boynton Beach, FL | 2.0 | 2.0 | 1385 | $2,450 | $1.77 | 24d | 1 | 1.01mi |
| 10624 Tropic Palm Ave #202 Boynton Beach, FL | 3.0 | 2.0 | 1385 | $2,550 | $1.84 | 24d | 1 | 1.04mi |
| 9873 Lawrence Rd Boynton Beach, FL | 2.0 | 2.0 | 1200 | $2,315 | $1.93 | 3d | 1 | 1.10mi |
| 9873 Lawrence Rd Boynton Beach, FL | 2.0 | 2.0 | 1200 | $2,267 | $1.89 | 22d | 1 | 1.10mi |
| 5537 Pebble Brook Ln Boynton Beach, FL | 3.0 | 2.0 | 1166 | $2,825 | $2.42 | 14d | 1 | 1.16mi |
| 9926 Watermill Cir Unit F Boynton Beach, FL | 3.0 | 2.0 | 1471 | $2,400 | $1.63 | 24d | 1 | 1.18mi |
| 8949 Oak St Boynton Beach, FL | 2.0 | 2.0 | 1040 | $1,300 | $1.25 | 24d | 1 | 1.18mi |
| 9746 Nickels Blvd Boynton Beach, FL | 2.0 | 2.0 | 1215 | $2,800 | $2.30 | 24d | 1 | 1.46mi |
HOA detail condo
- Monthly dues
- $0 · $0/yr
- Assessments
- None detected in remarks — confirm with the listing agent.
Listing history 27 events
-
2026-06-18days on market $269,000 Active 60 DOM
-
2026-06-17days on market $269,000 Active 59 DOM
-
2026-06-16days on market $269,000 Active 58 DOM
-
2026-06-15days on market $269,000 Active 57 DOM
-
2026-06-13days on market $269,000 Active 55 DOM
-
2026-06-09days on market $269,000 Active 51 DOM
-
2026-06-08days on market $269,000 Active 50 DOM
-
2026-06-07days on market $269,000 Active 49 DOM
-
2026-06-04days on market $269,000 Active 46 DOM
-
2026-06-03days on market $269,000 Active 45 DOM
-
2026-06-02days on market $269,000 Active 44 DOM
-
2026-06-01days on market $269,000 Active 43 DOM
-
2026-05-31days on market $269,000 Active 42 DOM
-
2026-04-21$2,800
-
2026-04-17$269,000 Active
-
2025-12-31historical
-
2025-11-12price $295,000
-
2025-04-19$305,000 Active
-
2024-10-31historical
-
2024-06-10price $325,000
-
2024-04-10$350,000 Active
-
2024-03-07historical
-
2024-01-23$350,000 Active
-
2020-05-05soldstatus $154,000
-
2012-01-12soldstatus $120,000
-
1994-06-14soldstatus $101,000
-
1993-10-27soldstatus $92,900
ⓘ Source: listings_history table (triggers on properties + properties_extension) + one-shot
backfill from property_details.listing_events for pre-trigger history.
Tax reassessment forecast FL · Resets to sale price
- Current annual tax
- $3,689 · $307/mo
- Projected year-2 tax
- $3,689 · $307/mo
- Expected delta
- $0/yr ($0/mo · 0.0%)
ⓘ Screening estimate from a state-policy table — verify with the county assessor before closing.
Climate risk First Street
- Flood 1/10 Low FEMA zone X (unshaded) · 0% chance over 30 yrs
- Wildfire 1/10 Low
- Heat 9/10 Extreme 7 d/yr ≥106°F today · 23 d/yr by 30 yrs out
- Wind 10/10 Extreme 99% chance of damaging wind over 30 yrs
- Air quality 2/10 Low 1 unhealthy d/yr today · 2 by 30 yrs out
Nearby sold comps map
Loading sold comps map…
Walkable amenities ~0.75 mi
Loading nearby amenities…
Taxation est. · year 1
- Rental income
- $33,339
- − Mortgage interest
- −$15,068
- − Property taxes
- −$3,689
- − Insurance
- −$1,345
- − Repairs & maintenance
- −$2,667
- − Management
- −$2,667
- − HOA
- −$12,840
- − Depreciation
- −$7,825
- Taxable loss
- −$12,763
- Est. tax savings @ 24.0%
- +$3,063
- After-tax cash flow
- $-5,401/yr
For passive investors: Depreciation is non-cash, so a rental often shows a tax loss while cash-flowing — sheltering income. Rental losses are passive: they offset passive income freely, and up to $25,000/yr can offset ordinary (W-2) income if you actively participate and your MAGI is under $100k (phasing out to $0 by $150k); unused losses carry forward. On sale, claimed depreciation is recaptured at up to 25%, and gains may owe capital-gains tax (a 1031 exchange can defer both). Figures are a year-1 estimate at your 24.0% rate — not tax advice; consult a CPA.
Schools (NCES district)
- District
- Palm Beach
- NCES district ID
- 1201500
- Math proficiency
- 46% ▼ -16.00%
- Reading proficiency
- 53% ▼ -4.00%
- Median HH income
- $53,943
- Composite
- 42.72/100
- National rank
- #3160
- State rank
- #34 of 73 in FL
Livability — Boynton Beach
- Score
- 72/100
- State rank
- #351
- US rank
- #6098
Category grades
Schools grade is shown separately in the Schools card above.
Census & demographics
- County
- Palm Beach County · 1,438,312 people
- City population
- 148,060
- Metro
- Miami-Fort Lauderdale-Pompano Beach, FL
- Population (ZIP)
- 37,229
- Household income
- $80,710
- Rent vs Own
- Severe rent burden
- 902.0
Population outlook (Palm Beach County) Hauer SSP2
- Today (2025)
- 1,637,487 people
- By 2030
- 1,743,255 · +6.5%
- By 2040
- 1,948,712 · +19.0%
- By 2050
- 2,132,979 · +30.3%
- By 2075
- 2,530,027 · +54.5%
- By 2100
- 2,706,979 · +65.3%
Race, ethnicity, and origin ACS 2023
- Neighborhood character
- Predominantly White (68%)
- Race & ethnicity
- White 68% Two or more races 13% Hispanic / Latino 12% Black 10% Asian 3%
- Hispanic origin (detail)
- Mexican 1% Puerto Rican 2% Cuban 1% Dominican 1%
- Common ancestry
- Scotch-Irish 8% Romanian 8% Hispanic 6%
- Foreign-born
- 18% · Canada, Jamaica, Vietnam
- Languages at home
- 78% English-only · Spanish 10% French/Haitian/Cajun 6% Other Indo-European 2%
Political lean MEDSL · Palm Beach
- 2024 margin
- Toss-up / Even · D 50.0% · R 49.2%
- 2008→2024 swing
- -22.1pp toward R · 2008: 22.9pp · 2024: 0.8pp
- All cycles
- 2024: D+0.8 2020: D+12.8 2016: D+15.3 2012: D+17.0 2008: D+22.9
Not yet ingested
- Civics
- —
Market trends
- HPI YoY
- ▼ -0.24%
- Current HPI
- 257.5891
- Rent YoY
- ▲ 1.28%
- Metro
- Miami-Fort Lauderdale-Pompano Beach, FL
- State GDP YoY
- ▲ 3.28%
- F500 in state
- 36
Industry mix (Fortune 500 HQ in FL)
| Industry | F500 HQs | Revenue |
|---|---|---|
| Industrial Technology | 2 | $29B |
|
||
| Insurance | 2 | $17B |
|
||
| Retail | 1 | $60B |
|
||
| Technology Distribution | 1 | $58B |
|
||
| Homebuilding | 1 | $35B |
|
||
| Technology Manufacturing | 1 | $35B |
|
||
Price history
-97.0% since first listed14 events — show timeline
- 2026-04-21 Listed for Rent $2,800 MARMLS
- 2026-04-17 Listed $269,000 MARMLS
- 2025-12-31 Listing Removed — Beaches MLS
- 2025-11-12 Price Changed $295,000 Beaches MLS
- 2025-04-19 Listed $305,000 Beaches MLS
- 2024-10-31 Listing Removed — Beaches MLS
- 2024-06-10 Price Changed $325,000 Beaches MLS
- 2024-04-10 Listed $350,000 Beaches MLS
- 2024-03-07 Listing Removed — Beaches MLS
- 2024-01-23 Listed $350,000 Beaches MLS
- 2020-05-05 Sold (Public Records) $154,000 Public Records
- 2012-01-12 Sold (Public Records) $120,000 Public Records
- 1994-06-14 Sold (Public Records) $101,000 Public Records
- 1993-10-27 Sold (Public Records) $92,900 Public Records
Property tax history
+7.7%/yrLatest (2025): $3,689 · +0.4% YoY. Source: county tax records.
Cash-flow waterfall
monthlySold comps — $/sqft
last 12 mo · ≤1 miLoading sold comps…