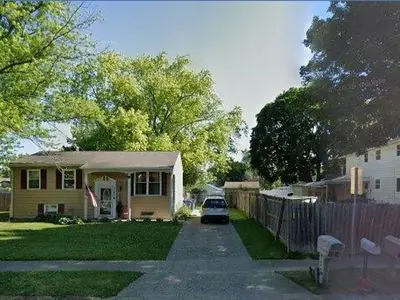
3505 Oakhurst Dr · Kokomo, IN
Flood risk 1/10 · Minimal
- FEMA flood zone
- X (unshaded)
- Chance of flooding over 30 yrs
- 0.0%
- Est. flood insurance / yr
- $507 – $1,088
Fire risk 1/10 · Minimal
- Est. fire insurance / yr
- $717 – $1,331
Heat risk 3/10 · Minor
- Hot days now (above 102°F)
- 7 days/yr
- Hot days in 30 yrs
- 17 days/yr
Wind risk 2/10 · Minimal
- Chance of severe wind over 30 yrs
- —
Air-quality risk 3/10 · Minor
- Unhealthy air days now
- 2 days/yr
- Unhealthy air days in 30 yrs
- 4 days/yr
Risk factors via First Street. Map © Google.
Why this score? — see what drove the D+ grade
The composite is a weighted blend of 9 inputs, each scored 0–100. Each bar is that input's sub-score; the figure is the points it added to the 100-point composite (weight × sub-score).
- ARV discount +15.0/15.0
- Cash flow +13.1/30.0
- Schools +4.4/10.0
- DSCR +3.9/10.0
- Livability +3.4/5.0
- Rent growth +3.0/5.0
- 1% rule +2.7/10.0
- Condition / age +2.5/5.0
- Appreciation +0.0/10.0
$198,393
🖨 Deal sheet 📄 Offer letter ✓ Due diligence
Listing remarks
Welcome to this spacious 4-bedroom home located in the established Vinton Woods neighborhood of Kokomo. Offering approximately 1,800 square feet of living space, this property combines classic charm with everyday functionality. Built in 1968, the home features 1.5 bathrooms, central air conditioning, a durable masonry exterior, and a practical layout designed for comfortable family living. Situated on a generously sized lot with mature surroundings, the property provides ample outdoor space for entertaining, relaxing, or future customization. Conveniently located near shopping, dining, parks, and major roadways, this home offers both comfort and accessibility in a desirable south Kokomo loc
Key facts
- Ample outdoor space
- Generously sized lot
- Masonry exterior
Tags
Neighborhood map
What this means for you Summary
Snapshot
- This is a 4-bed/1.5-bath single-family listed at $198k.
Deal economics
- At list price, monthly cash flow is $-7 ($-81/yr) — negative.
- To cash-flow at today's rent, offer at most $197k (0.6% below list).
- To meet the 1% rule (rent ≥ 1% of price), the offer needs to be $153k (22.7% below list).
- Recommended offer: $153k (22.7% below list) — sets the bar for 1% rule.
Location & tenants
- Location reads 68/100 on livability (#227 in IN) — a middle-class / working-renter tenant base. Strengths: cost of living A+, housing A+, health & safety A; Watch: crime D, schools F, amenities F.
- Western School Corporation (rural): math 48% / reading 52% proficiency, ranked #44 of 301 in IN (top 15%) — acceptable for families but not a draw, mixed tenant base, ~2y average lease.
- Market conditions: Rents rising (+1.8%/yr); 232 active listings in the ZIP; 2 comparable units currently listed for rent nearby; 194 units permitted in Howard County in 2024 (0 in 5+ unit buildings).
Forward outlook
- Local home prices are declining (-3.0%/yr); year-one equity from $1k of loan paydown is wiped out by about $6k of value loss. Plan a longer hold.
- Howard County population projected at -11% by 2050 — secular population decline; favor cash flow + early exit over multi-decade hold.
Negotiation context
- It's been on market 25 days — a 2% lower offer ($195k) is reasonable based on typical stale-listing flexibility.
Questions for the listing agent
- What do current leases actually rent for vs. the listed asking? Can we see a recent rent roll and the last 12 months of T-12 income?
- Built in 1968 — when were the roof, HVAC, electrical panel, plumbing, and water heater last replaced?
- Is there a deadline driving the sale (1031 exchange, divorce, estate, relocation)? That informs how much negotiation room exists.
- Schools are F-rated, which usually means shorter tenancies and higher turnover. Who's the typical renter profile here, and what's been the actual vacancy rate?
- Crime grade is D in this area — have there been break-ins, vandalism, or insurance claims at this property in the last 3 years? What carrier currently insures it and at what premium?
- The area grade is low — what's the realistic commute time and amenity access for the typical tenant pool here? Any planned neighborhood developments (good or bad) we should know about?
- What's the average days-on-market for RENTAL listings here right now (not sales)? A rising rental-DOM trend means longer vacancies and softer asking-rent achievability than the comps imply.
- What's the recent tenant-quality profile in this submarket — average credit score on applications, eviction rate, late-payment / NSF rate, and stable-employment percentage? A property-management company in the area should have these aggregated.
- How much new for-sale + rental construction is in the pipeline within 1–3 miles? Heavy new supply typically softens prices + rents 12–24 months out; constrained supply supports both.
Investment metrics
- 1% rule
- 0.77% ✗
- Cap rate
- 6.25%
- Cash-on-cash
- -0.15%
- DSCR
- 0.99
- GRM
- 10.8
CMA / ARV
- ARV (on-the-fly)
- $248,400
- Comps found
- 12
Show comp detail 12 sales within ~0.75 mi
| Address | Dist | Beds/Ba | Sqft | Sold | Price | $/sf | Match |
|---|---|---|---|---|---|---|---|
| 3277 Almquist Ln | 0.47mi | 3/2.0 (-1) | 1,680 (-7%) | 0mo | $275,000 | $164 | 60 |
| 3601 Canyon Dr | 0.56mi | 3/2.0 (-1) | 1,695 (-6%) | 4mo | $195,000 | $115 | 54 |
| 2829 Beachwalk Ln | 0.64mi | 3/2.5 (-1) | 1,728 (-4%) | 11mo | $263,500 | $152 | 45 |
| 904 Gulf Shore Blvd | 0.63mi | 4/2.5 | 1,992 (+11%) | 6mo | $250,000 | $126 | 44 |
| 707 E Alto Rd | 0.63mi | 3/2.0 (-1) | 1,672 (-7%) | 11mo | $236,000 | $141 | 42 |
| 3505 W Melody Ln | 0.59mi | 3/1.5 (-1) | 1,531 (-15%) | 2mo | $195,000 | $127 | 41 |
| 3801 E Melody Ln | 0.66mi | 3/2.0 (-1) | 1,580 (-12%) | 5mo | $214,900 | $136 | 38 |
| 911 Shore Bend Blvd | 0.66mi | 3/2.0 (-1) | 1,532 (-15%) | 1mo | $225,000 | $147 | 36 |
| 3812 Pamela Ct | 0.62mi | 3/2.0 (-1) | 1,560 (-13%) | 7mo | $95,000 | $61 | 36 |
| 3704 E Melody Ln | 0.73mi | 4/2.5 | 1,600 (-11%) | 10mo | $210,000 | $131 | 35 |
| 943 Gulf Shore Dr | 0.71mi | 3/2.5 (-1) | 2,044 (+14%) | 2mo | $282,500 | $138 | 33 |
| 3080 Morrow Dr | 0.67mi | 3/2.0 (-1) | 1,544 (-14%) | 12mo | $249,900 | $162 | 28 |
Match score weights: distance 35% · size 25% · config 20% · recency 20%. Top-matched comps best support the ARV.
Projected returns pro-forma
-3.0% appreciation · 1.8% rent growth · sell at horizon
- IRR
- -17.8%
- Equity multiple
- 0.38×
- Total profit
- $-34,479
- Equity at exit
- $29,581
- IRR
- -12.2%
- Equity multiple
- 0.31×
- Total profit
- $-38,194
- Equity at exit
- $17,153
Cash invested: $55,550 (down + closing). Projections, not guarantees.
Landlord ↔ Tenant lean methodology
- Overall (STATE)
- 90 Strongly Landlord-Friendly
- State Indiana
- 90 Strongly Landlord-Friendly · R+11
- County
- — inherits STATE
- City
- — inherits STATE
ZIP-level market 46902
- Home prices YoY
- -20.7%
- Rents YoY
- 1.8%
- Active inventory
- 232
- Price-to-rent
- 10.8×
Monthly cashflow live
- Estimated rent
- $1,534 medium interval (Pro) →
- Mortgage (P&I)
- −$1,040
- Tax from tax record
- −$95 /mo · $1,142/yr
- Insurance
- −$83
- HOA
- −$0
- Vacancy / Maint / Mgmt
- −$322
- Net cashflow
- $-7
Break-even live
UW: 25.0% down · 7.5% · 30yr · 1.5% tax · 5.0% vac · 8.0% maint · 8.0% mgmt
Financing live
Cash to close
- Down payment
- $49,598
- Closing costs
- $5,952
- Reserves months
- —
- Total cash needed
- —
Loan-product check · same deal, 3 products live
Conventional
25% down · 7.5% · 30yr
- Down + closing
- —
- Monthly P&I
- —
- Monthly cashflow
- —
- DSCR
- —
- Eligible?
- —
Personal DTI + credit; lowest rate.
DSCR
20% down · 8.5% · 30yr
- Down + closing
- —
- Monthly P&I
- —
- Monthly cashflow
- —
- DSCR
- —
- Eligible?
- —
No personal income docs; deal must DSCR.
Hard money
10% down · 12.0% · 12mo
- Down + closing
- —
- Monthly P&I
- —
- Monthly cashflow
- —
- DSCR
- —
- Eligible?
- —
Short-term bridge; refi at stabilization.
Rent comps 2 comps
| Address | Beds | Baths | Sqft | Rent | $/sqft | DOM | Units | Dist |
|---|---|---|---|---|---|---|---|---|
| 430 W Rainbow Cir Kokomo, IN | 3.0 | 1.0–2.5 | 966 | $1,345 | $1.39 | 1d | 6 | 0.25mi |
| 3515 Melody Ln E Kokomo, IN | 3.0 | 1.5 | 1736 | $1,650 | $0.95 | 43d | 1 | 0.71mi |
Listing history 16 events
-
2026-06-19days on market $198,393 Active 25 DOM
-
2026-06-18days on market $198,393 Active 24 DOM
-
2026-06-17days on market $198,393 Active 23 DOM
-
2026-06-16days on market $198,393 Active 22 DOM
-
2026-06-15days on market $198,393 Active 21 DOM
-
2026-06-14days on market $198,393 Active 19 DOM
-
2026-06-13days on market $198,393 Active 18 DOM
-
2026-06-10days on market $198,393 Active 16 DOM
-
2026-06-09days on market $198,393 Active 15 DOM
-
2026-06-08days on market $198,393 Active 14 DOM
-
2026-06-07days on market $198,393 Active 13 DOM
-
2026-06-02days on market $198,393 Active 8 DOM
-
2026-06-01days on market $198,393 Active 7 DOM
-
2026-05-31days on market $198,393 Active 6 DOM
-
2026-05-30days on market $198,393 Active 5 DOM
-
2026-05-26$198,393 Active
ⓘ Source: listings_history table (triggers on properties + properties_extension) + one-shot
backfill from property_details.listing_events for pre-trigger history.
Tax reassessment forecast IN · Partial reset (capped growth)
- Current annual tax
- $1,142 · $95/mo
- Projected year-2 tax
- $1,414 · $118/mo
- Expected delta
- +$272/yr (+$23/mo · 23.8%)
ⓘ Screening estimate from a state-policy table — verify with the county assessor before closing.
Climate risk First Street
- Flood 1/10 Low FEMA zone X (unshaded) · 0% chance over 30 yrs
- Wildfire 1/10 Low
- Heat 3/10 Moderate 7 d/yr ≥102°F today · 17 d/yr by 30 yrs out
- Wind 2/10 Low
- Air quality 3/10 Moderate 2 unhealthy d/yr today · 4 by 30 yrs out
Nearby sold comps map
Loading sold comps map…
Walkable amenities ~0.75 mi
Loading nearby amenities…
Taxation est. · year 1
- Rental income
- $18,402
- − Mortgage interest
- −$11,113
- − Property taxes
- −$1,142
- − Insurance
- −$992
- − Repairs & maintenance
- −$1,472
- − Management
- −$1,472
- − Depreciation
- −$5,771
- Taxable loss
- −$3,561
- Est. tax savings @ 24.0%
- +$855
- After-tax cash flow
- $774/yr
For passive investors: Depreciation is non-cash, so a rental often shows a tax loss while cash-flowing — sheltering income. Rental losses are passive: they offset passive income freely, and up to $25,000/yr can offset ordinary (W-2) income if you actively participate and your MAGI is under $100k (phasing out to $0 by $150k); unused losses carry forward. On sale, claimed depreciation is recaptured at up to 25%, and gains may owe capital-gains tax (a 1031 exchange can defer both). Figures are a year-1 estimate at your 24.0% rate — not tax advice; consult a CPA.
Schools (NCES district)
- District
- Western School Corporation
- NCES district ID
- 1804470
- Math proficiency
- 48% ▼ -12.00%
- Reading proficiency
- 52% ▼ -8.00%
- Median HH income
- $62,856
- Composite
- 44.0/100
- National rank
- #2891
- State rank
- #44 of 301 in IN
Livability — Kokomo
- Score
- 68/100
- State rank
- #227
- US rank
- #9912
Category grades
Schools grade is shown separately in the Schools card above.
Census & demographics
- Census place
- Kokomo, IN
- County
- Howard County · 75,099 people
- City population
- 75,099
- Metro
- Kokomo, IN
- Population (ZIP)
- 37,017
- Household income
- $62,126
- Rent vs Own
- Severe rent burden
- 1262.0
Population outlook (Howard County) Hauer SSP2
- Today (2025)
- 81,522 people
- By 2030
- 80,104 · -1.7%
- By 2040
- 76,708 · -5.9%
- By 2050
- 72,880 · -10.6%
- By 2075
- 64,016 · -21.5%
- By 2100
- 51,705 · -36.6%
Race, ethnicity, and origin ACS 2023
- Neighborhood character
- Predominantly White (81%)
- Race & ethnicity
- White 81% Black 9% Two or more races 5% Hispanic / Latino 4% Asian 3%
- Common ancestry
- Italian 2% Lithuanian 1% Slovak 1%
- Foreign-born
- 3% · Canada, Vietnam, China
- Languages at home
- 96% English-only · Vietnamese 1% Other Asian/Pacific 1% Spanish 1%
Political lean MEDSL · Howard
- 2024 margin
- Solid R (+35.3) · D 31.4% · R 66.7% · Other 1.8%
- 2008→2024 swing
- -29.1pp toward R · 2008: -6.2pp · 2024: -35.3pp
- All cycles
- 2024: R+35.3 2020: R+32.4 2016: R+33.9 2012: R+14.3 2008: R+6.2
Not yet ingested
- Civics
- —
Market trends
- HPI YoY
- ▼ -61.76%
- Current HPI
- 236.8237
- Rent YoY
- ▲ 1.80%
- Metro
- Kokomo, IN
- State GDP YoY
- ▲ 2.90%
- F500 in state
- 18
Industry mix (Fortune 500 HQ in IN)
| Industry | F500 HQs | Revenue |
|---|---|---|
| Industrial Machinery | 2 | $37B |
|
||
| Healthcare | 1 | $177B |
|
||
| Pharmaceuticals | 1 | $45B |
|
||
| Metals / Steel | 1 | $18B |
|
||
| Agriculture | 1 | $17B |
|
||
| Packaging | 1 | $12B |
|
||
Price history
1 event — show timeline
- 2026-05-26 Listed $198,393 FSBO.com
Property tax history
+10.4%/yrLatest (2024): $1,142 · +6.9% YoY. Source: county tax records.
Cash-flow waterfall
monthlySold comps — $/sqft
last 12 mo · ≤1 miLoading sold comps…