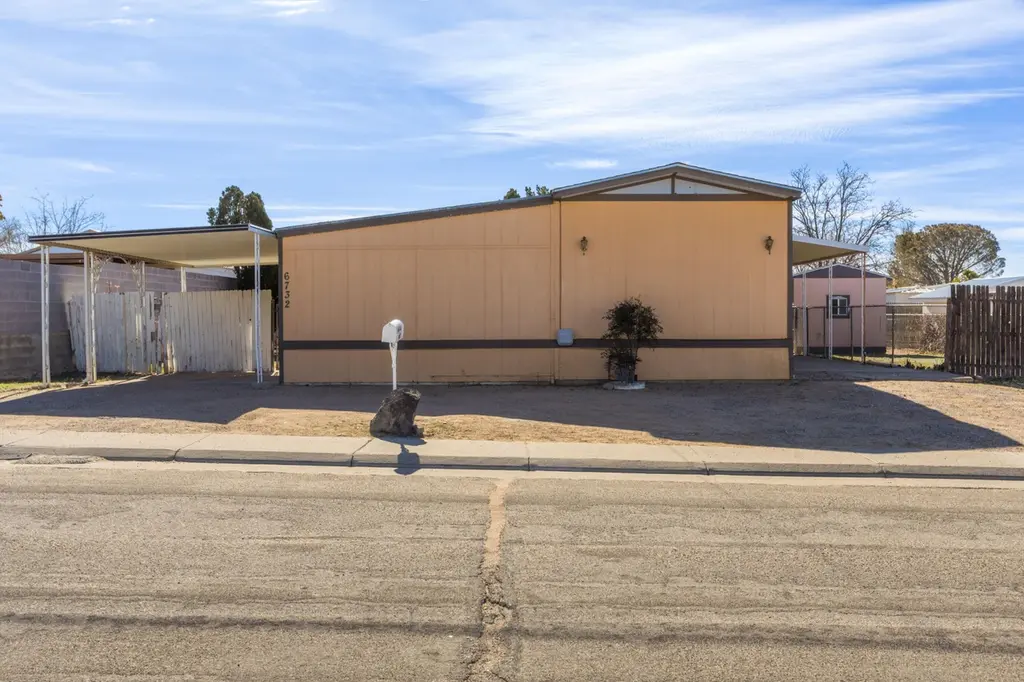
6732 San Bernardino Ave NE · Albuquerque, NM
Flood risk 1/10 · Minimal
- FEMA flood zone
- X (unshaded)
- Chance of flooding over 30 yrs
- 0.0%
- Est. flood insurance / yr
- $507 – $1,088
Fire risk 2/10 · Minimal
- Est. fire insurance / yr
- $706 – $1,312
Heat risk 4/10 · Minor
- Hot days now (above 95°F)
- 6 days/yr
- Hot days in 30 yrs
- 14 days/yr
Wind risk 1/10 · Minimal
- Chance of severe wind over 30 yrs
- —
Air-quality risk 3/10 · Minor
- Unhealthy air days now
- 3 days/yr
- Unhealthy air days in 30 yrs
- 3 days/yr
Risk factors via First Street. Map © Google.
Why this score? — see what drove the D+ grade
The composite is a weighted blend of 9 inputs, each scored 0–100. Each bar is that input's sub-score; the figure is the points it added to the 100-point composite (weight × sub-score).
- Cash flow +23.2/30.0
- DSCR +7.4/10.0
- 1% rule +5.3/10.0
- Schools +5.3/10.0
- Livability +3.6/5.0
- Condition / age +2.5/5.0
- Rent growth +2.3/5.0
- ARV discount +0.0/15.0
- Appreciation +0.0/10.0
$199,000
🖨 Deal sheet (PDF) 📄 Offer letter ✓ Due diligence
Listing remarks MLS
Beautifully maintained home with an additional, attached, 264 sqft multi-use room! This two bedroom (possible 3) and two bathroom home includes a large, fully-fenced outdoor space, sizeable kitchen, cozy wood burning fireplace and walk-in shed. The land is owned as well!!! Located in a convenient NE Heights neighborhood desirable to many! No owner financing will be offered. Make an appointment to see it in-person today!!!
Key facts
- Multi-use room
- Walk-in shed
- 7,841 sq ft lot
Tags
Neighborhood map
What this means for you Summary
Snapshot
- This is a 2-bed/2.0-bath manufactured listed at $199k.
Deal economics
- At list price, monthly cash flow is $359 ($4k/yr) — positive.
- The deal already cash-flows at list — no discount required.
- Meets the 1% rule at list price ($2k rent vs $199k).
- Recommended offer: $175k (12.0% below list) — sets the bar for market timing.
- Cap rate 8.5% vs local median 3.6% in Albuquerque — top-decile yield for the area; either an underpriced asset or a hidden risk that comps aren't pricing in. Stress-test before assuming the spread holds.
Location & tenants
- Location reads 72/100 on livability (#13 in NM) — a middle-class / working-renter tenant base. Strengths: amenities A+, commute A+, cost of living A+; Watch: crime F.
- Albuquerque Public Schools (urban): math 51% / reading 75% proficiency, ranked #3 of 29 in NM (top 10%) — acceptable for families but not a draw, mixed tenant base, ~2y average lease; 60% free/reduced lunch — lower-income household profile, screen leases tightly.
- Zoned schools: Edmund G Ross Elementary (405 students, 100% FRL); Mckinley Middle (486 students, 100% FRL); Del Norte High (1,070 students, 100% FRL) — zoned schools average 100% FRL vs 60% district-wide (40 pts higher); higher-poverty schools than district average — tighter screening recommended.
- Market conditions: Rents soft (-1.0%/yr); 158 active listings in the ZIP; 16 comparable units currently listed for rent nearby; rentals leasing fast (median 5d on market — plan ~1-2 weeks tenant-placement turnaround); 1,316 units permitted in Bernalillo County in 2024 (546 in 5+ unit buildings).
- This rent runs 42% of the median local income ($59k/yr) — at the standard rent-burdened threshold; future hikes will face affordability resistance.
Forward outlook
- Local home prices are declining (-3.0%/yr); year-one equity from $1k of loan paydown is wiped out by about $6k of value loss. Plan a longer hold.
Negotiation context
- It's been on market 133 days — a 12% lower offer ($175k) is reasonable based on typical stale-listing flexibility.
- 3 sale attempts since 9y ago; this cycle's ask has dropped $26k (12%) from the opening price — seller is motivated, your offer sets the floor, not the list.
Questions for the listing agent
- It's been on market 133 days. Have you received any prior offers? Is the seller open to a 12% concession, seller financing, or rate buy-down credit?
- Built in 1976 — when were the roof, HVAC, electrical panel, plumbing, and water heater last replaced?
- Why hasn't it sold? Are there any deal-killer items the seller is aware of (foundation, flood, title, zoning, code violations)?
- Is there a deadline driving the sale (1031 exchange, divorce, estate, relocation)? That informs how much negotiation room exists.
- Schools are D-rated, which usually means shorter tenancies and higher turnover. Who's the typical renter profile here, and what's been the actual vacancy rate?
- Crime grade is F in this area — have there been break-ins, vandalism, or insurance claims at this property in the last 3 years? What carrier currently insures it and at what premium?
- The area grade is low — what's the realistic commute time and amenity access for the typical tenant pool here? Any planned neighborhood developments (good or bad) we should know about?
- What's the average days-on-market for RENTAL listings here right now (not sales)? A rising rental-DOM trend means longer vacancies and softer asking-rent achievability than the comps imply.
- What's the recent tenant-quality profile in this submarket — average credit score on applications, eviction rate, late-payment / NSF rate, and stable-employment percentage? A property-management company in the area should have these aggregated.
- How much new for-sale + rental construction is in the pipeline within 1–3 miles? Heavy new supply typically softens prices + rents 12–24 months out; constrained supply supports both.
Investment metrics
- 1% rule
- 1.03% ✓
- Cap rate
- 8.46%
- Cash-on-cash
- 7.73%
- DSCR
- 1.34
- GRM
- 8.1
CMA / ARV
- ARV (median comp)
- $148,250
- List price
- $199,000
- Delta
- 34.23%
- Verdict
- OVERPRICED
- Comps
- 14 within 1.0 mi
Show comp detail 6 sales within ~0.75 mi
| Address | Dist | Beds/Ba | Sqft | Sold | Price | $/sf | Match |
|---|---|---|---|---|---|---|---|
| 6609 San Francisco Rd NE | 0.31mi | 3/2.0 (+1) | 1,500 (+1%) | 3mo | $265,000 | $177 | 77 |
| 7813 Spencer Rd NE | 0.22mi | 3/2.0 (+1) | 1,413 (-5%) | 7mo | $90,000 | $64 | 70 |
| 7141 Gatling Dr NE | 0.31mi | 3/2.0 (+1) | 1,400 (-6%) | 2mo | $99,000 | $71 | 69 |
| 7105 Springfield Dr NE | 0.25mi | 3/2.0 (+1) | 1,614 (+8%) | 2mo | $99,000 | $61 | 68 |
| 6840 San Francisco Rd NE | 0.36mi | 3/2.0 (+1) | 1,457 (-2%) | 8mo | $250,000 | $172 | 68 |
| 6831 Jade Park Ave NE | 0.42mi | 3/1.5 (+1) | 1,417 (-5%) | 6mo | $210,000 | $148 | 60 |
Match score weights: distance 35% · size 25% · config 20% · recency 20%. Top-matched comps best support the ARV.
Projected returns pro-forma
-3.0% appreciation · 0.0% rent growth · sell at horizon
- IRR
- -7.7%
- Equity multiple
- 0.72×
- Total profit
- $-15,422
- Equity at exit
- $29,672
- IRR
- -2.2%
- Equity multiple
- 0.87×
- Total profit
- $-7,329
- Equity at exit
- $17,206
Cash invested: $55,720 (down + closing). Projections, not guarantees.
Landlord ↔ Tenant lean methodology
- Overall (STATE)
- 55 Moderately Landlord-Leaning
- State New Mexico
- 55 Moderately Landlord-Leaning · D+3
- County
- — inherits STATE
- City
- — inherits STATE
ZIP-level market 87109
- Rents YoY
- -1.0%
- Active inventory
- 158
- Price-to-rent
- 8.1×
Monthly cashflow live
- Estimated rent
- $2,046 high interval (Pro) →
- Mortgage (P&I)
- −$1,044
- Tax from tax record
- −$131 /mo · $1,567/yr
- Insurance
- −$83
- HOA
- −$0
- Vacancy / Maint / Mgmt
- −$430
- Net cashflow
- $359
Break-even live
Sensitivity live
| Price | -10% $472 | -5% $415 | +0% $359 | +5% $303 | +10% $246 |
|---|---|---|---|---|---|
| Rent | -10% $197 | -5% $278 | +0% $359 | +5% $440 | +10% $521 |
| Rate | -1.0pp $459 | -0.5pp $410 | base $359 | +0.5pp $307 | +1.0pp $255 |
UW: 25.0% down · 7.5% · 30yr · 1.5% tax · 5.0% vac · 8.0% maint · 8.0% mgmt
Financing live
Cash to close
- Down payment
- $49,750
- Closing costs
- $5,970
- Reserves months
- —
- Total cash needed
- —
Loan-product check · same deal, 3 products live
Conventional
25% down · 7.5% · 30yr
- Down + closing
- —
- Monthly P&I
- —
- Monthly cashflow
- —
- DSCR
- —
- Eligible?
- —
Personal DTI + credit; lowest rate.
DSCR
20% down · 8.5% · 30yr
- Down + closing
- —
- Monthly P&I
- —
- Monthly cashflow
- —
- DSCR
- —
- Eligible?
- —
No personal income docs; deal must DSCR.
Hard money
10% down · 12.0% · 12mo
- Down + closing
- —
- Monthly P&I
- —
- Monthly cashflow
- —
- DSCR
- —
- Eligible?
- —
Short-term bridge; refi at stabilization.
Rent comps 16 comps
| Address | Beds | Baths | Sqft | Rent | $/sqft | DOM | Units | Dist |
|---|---|---|---|---|---|---|---|---|
| 8319 Santa Clarita St NE Albuquerque, NM | 3.0 | 2.0 | 1728 | $2,500 | $1.45 | 22d | 1 | 0.51mi |
| 6401 Santa Monica Ave NE Albuquerque, NM | 1.0–2.0 | 1.0–2.0 | 1068 | $2,151 | $2.01 | 4d | 26 | 0.70mi |
| 7100 Louisiana Blvd NE Albuquerque, NM | 1.0–2.0 | 1.0–2.0 | 763 | $1,790 | $2.35 | 4d | 15 | 0.72mi |
| 6501 San Antonio Dr NE Albuquerque, NM | 2.0 | 2.0–2.5 | 1075 | $1,875 | $1.74 | 16d | 2 | 0.74mi |
| 8015 Argyle Ave NE Albuquerque, NM | 3.0 | 2.5 | 1679 | $2,300 | $1.37 | 4d | 1 | 0.77mi |
| 8750 Sevano Cir NE Albuquerque, NM | 3.0 | 3.0 | 1757 | $2,950 | $1.68 | 45d | 1 | 0.87mi |
| 7000 Louisiana Blvd NE Albuquerque, NM | 1.0–2.0 | 1.0–2.0 | 840 | $1,709 | $2.03 | 4d | 25 | 0.89mi |
| 8601 Coppell Ct NE Albuquerque, NM | 3.0 | 2.0 | 1536 | $2,300 | $1.50 | 25d | 1 | 0.91mi |
| 8300 Wyoming Blvd NE Albuquerque, NM | 1.0–3.0 | 1.0–2.0 | 1095 | $1,822 | $1.66 | 3d | 18 | 0.95mi |
| 8129 Shannon St NE Albuquerque, NM | 3.0 | 2.0 | 1500 | $2,100 | $1.40 | 4d | 1 | 0.99mi |
| 7800 Headline Blvd NE Albuquerque, NM | 2.0 | 1.0–2.0 | 961 | $2,343 | $2.44 | 4d | 16 | 0.99mi |
| 6301 Alameda Blvd NE Albuquerque, NM | 3.0 | 1.0–2.5 | 903 | $2,072 | $2.29 | 3d | 23 | 0.99mi |
| 6925 Alameda Blvd NE Albuquerque, NM | 2.0 | 1.0–2.0 | 942 | $2,244 | $2.38 | 3d | 19 | 1.02mi |
| 6700 Modesto Ave NE Albuquerque, NM | 2.0 | 1.0–2.0 | 832 | $2,422 | $2.91 | 3d | 14 | 1.20mi |
| 7501 Jefferson St NE Albuquerque, NM | 2.0 | 1.0–2.0 | 887 | $2,291 | $2.58 | 4d | 38 | 1.28mi |
| 8100 Barstow St NE Albuquerque, NM | 1.0–3.0 | 1.0–2.0 | 1097 | $1,926 | $1.76 | 4d | 26 | 1.34mi |
Listing history 22 events
-
2026-06-22days on market $199,000 Active 133 DOM
-
2026-06-18days on market $199,000 Active 130 DOM
-
2026-06-17days on market $199,000 Active 129 DOM
-
2026-06-16days on market $199,000 Active 128 DOM
-
2026-06-15days on market $199,000 Active 127 DOM
-
2026-06-13days on market $199,000 Active 125 DOM
-
2026-06-10days on market $199,000 Active 122 DOM
-
2026-06-09days on market $199,000 Active 121 DOM
-
2026-06-08days on market $199,000 Active 120 DOM
-
2026-06-07days on market $199,000 Active 119 DOM
-
2026-06-05pricedays on market $199,000 Active 116 DOM
-
2026-06-03days on market $222,000 Active 115 DOM
-
2026-06-02days on market $222,000 Active 114 DOM
-
2026-06-01days on market $222,000 Active 113 DOM
-
2026-05-31days on market $222,000 Active 112 DOM
-
2026-04-02price $222,000 428-char remark
Show marketing remark (428 chars)
Beautifully maintained home with an additional, attached, 264 sqft multi-use room! This two bedroom (possible 3) and two bathroom home includes a large, fully-fenced outdoor space, sizeable kitchen, cozy wood burning fireplace and walk-in shed. The land is owned as well!!! Located in a convenient NE Heights neighborhood desirable to many! No owner financing will be offered. Make an appointment to see it in-person today!!!
-
2026-03-02status Active 428-char remark
Show marketing remark (428 chars)
Beautifully maintained home with an additional, attached, 264 sqft multi-use room! This two bedroom (possible 3) and two bathroom home includes a large, fully-fenced outdoor space, sizeable kitchen, cozy wood burning fireplace and walk-in shed. The land is owned as well!!! Located in a convenient NE Heights neighborhood desirable to many! No owner financing will be offered. Make an appointment to see it in-person today!!!
-
2026-02-15status Pending 428-char remark
Show marketing remark (428 chars)
Beautifully maintained home with an additional, attached, 264 sqft multi-use room! This two bedroom (possible 3) and two bathroom home includes a large, fully-fenced outdoor space, sizeable kitchen, cozy wood burning fireplace and walk-in shed. The land is owned as well!!! Located in a convenient NE Heights neighborhood desirable to many! No owner financing will be offered. Make an appointment to see it in-person today!!!
-
2026-01-19$225,000 Active 428-char remark
Show marketing remark (428 chars)
Beautifully maintained home with an additional, attached, 264 sqft multi-use room! This two bedroom (possible 3) and two bathroom home includes a large, fully-fenced outdoor space, sizeable kitchen, cozy wood burning fireplace and walk-in shed. The land is owned as well!!! Located in a convenient NE Heights neighborhood desirable to many! No owner financing will be offered. Make an appointment to see it in-person today!!!
-
2018-01-05historical
-
2017-11-15status Pending
-
2017-10-04$114,000 Active
ⓘ Source: listings_history table (triggers on properties + properties_extension) + one-shot
backfill from property_details.listing_events for pre-trigger history.
Tax reassessment forecast NM · Resets to sale price
- Current annual tax
- $1,567 · $131/mo
- Projected year-2 tax
- $1,592 · $133/mo
- Expected delta
- +$25/yr (+$2/mo · 1.6%)
ⓘ Screening estimate from a state-policy table — verify with the county assessor before closing.
Climate risk First Street
- Flood 1/10 Low FEMA zone X (unshaded) · 0% chance over 30 yrs
- Wildfire 2/10 Low
- Heat 4/10 Moderate 6 d/yr ≥95°F today · 14 d/yr by 30 yrs out
- Wind 1/10 Low
- Air quality 3/10 Moderate 3 unhealthy d/yr today · 3 by 30 yrs out
Nearby sold comps map
Loading sold comps map…
Walkable amenities ~0.75 mi
Loading nearby amenities…
Taxation est. · year 1
- Rental income
- $24,548
- − Mortgage interest
- −$11,147
- − Property taxes
- −$1,567
- − Insurance
- −$995
- − Repairs & maintenance
- −$1,964
- − Management
- −$1,964
- − Depreciation
- −$5,789
- Taxable income
- $1,121
- Est. tax owed @ 24.0%
- −$269
- After-tax cash flow
- $4,038/yr
For passive investors: Depreciation is non-cash, so a rental often shows a tax loss while cash-flowing — sheltering income. Rental losses are passive: they offset passive income freely, and up to $25,000/yr can offset ordinary (W-2) income if you actively participate and your MAGI is under $100k (phasing out to $0 by $150k); unused losses carry forward. On sale, claimed depreciation is recaptured at up to 25%, and gains may owe capital-gains tax (a 1031 exchange can defer both). Figures are a year-1 estimate at your 24.0% rate — not tax advice; consult a CPA.
Schools (NCES district)
- District
- Albuquerque Public Schools
- NCES district ID
- 3500060
- Math proficiency
- 51% ▲ 30.00%
- Reading proficiency
- 75% ▲ 45.00%
- Median HH income
- $48,151
- Composite
- 53.29/100
- National rank
- #1487
- State rank
- #3 of 29 in NM
Livability — Albuquerque
- Score
- 72/100
- State rank
- #13
- US rank
- #6219
Category grades
Schools grade is shown separately in the Schools card above.
Census & demographics
- Census place
- Albuquerque, NM
- County
- Bernalillo County · 647,165 people
- City population
- 647,165
- Metro
- Albuquerque, NM
- Population (ZIP)
- 39,324
- Household income
- $58,900
- Rent vs Own
- Severe rent burden
- 2187.0
Population outlook (Bernalillo County) Hauer SSP2
- Today (2025)
- 704,528 people
- By 2030
- 711,723 · +1.0%
- By 2040
- 714,522 · +1.4%
- By 2050
- 709,274 · +0.7%
- By 2075
- 680,015 · -3.5%
- By 2100
- 619,879 · -12.0%
Race, ethnicity, and origin ACS 2023
- Neighborhood character
- Diverse neighborhood (Simpson 0.64)
- Race & ethnicity
- White 47% Hispanic / Latino 36% Two or more races 17% Native American 9% Black 3% Asian 3%
- Hispanic origin (detail)
- Mexican 19%
- Common ancestry
- Lithuanian 2% Slovak 2% Portuguese 2%
- Foreign-born
- 7% · Canada, China
- Languages at home
- 84% English-only · Spanish 11% Other Indo-European 1%
Political lean MEDSL · Bernalillo
- 2024 margin
- Strong D (+21.0) · D 59.2% · R 38.2% · Other 2.6%
- 2008→2024 swing
- -0.3pp no change · 2008: 21.4pp · 2024: 21.0pp
- All cycles
- 2024: D+21.0 2020: D+24.4 2016: D+17.8 2012: D+16.2 2008: D+21.4
Not yet ingested
- Civics
- —
Market trends
- HPI YoY
- ▼ -303.11%
- Current HPI
- 250.5034
- Rent YoY
- ▼ -0.97%
- Metro
- Albuquerque, NM
- State GDP YoY
- —
- F500 in state
- 0
Price history
+94.7% since first listed7 events — show timeline
- 2026-04-02 Price Changed $222,000 Southwest MLS
- 2026-03-02 Relisted — Southwest MLS
- 2026-02-15 Pending — Southwest MLS
- 2026-01-19 Listed $225,000 Southwest MLS
- 2018-01-05 Delisted — Southwest MLS
- 2017-11-15 Pending — Southwest MLS
- 2017-10-04 Listed $114,000 Southwest MLS
Property tax history
+2.1%/yrLatest (2025): $1,567 · +3.2% YoY. Source: county tax records.
Cash-flow waterfall
monthlySold comps — $/sqft
last 12 mo · ≤1 miLoading sold comps…