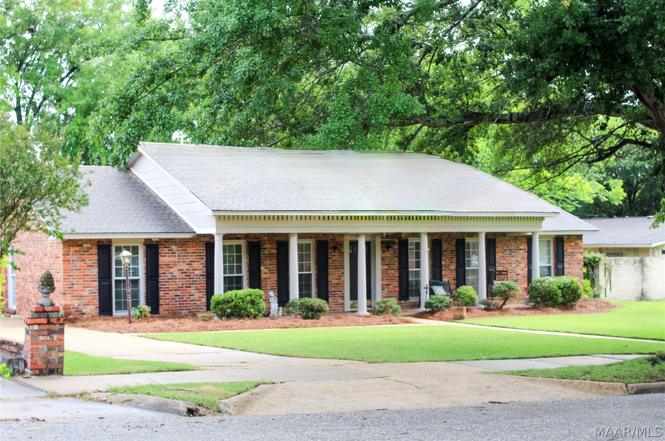
2932 Landsdowne Dr · Montgomery, AL
Flood risk 1/10 · Minimal
- FEMA flood zone
- X (unshaded)
- Chance of flooding over 30 yrs
- 0.0%
- Est. flood insurance / yr
- $507 – $1,088
Fire risk 1/10 · Minimal
- Est. fire insurance / yr
- $916 – $1,700
Heat risk 8/10 · Major
- Hot days now (above 108°F)
- 7 days/yr
- Hot days in 30 yrs
- 21 days/yr
Wind risk 8/10 · Major
- Chance of severe wind over 30 yrs
- 80.0%
Air-quality risk 2/10 · Minimal
- Unhealthy air days now
- 1 days/yr
- Unhealthy air days in 30 yrs
- 1 days/yr
Risk factors via First Street. Map © Google.
Why this score? — see what drove the D+ grade
The composite is a weighted blend of 9 inputs, each scored 0–100. Each bar is that input's sub-score; the figure is the points it added to the 100-point composite (weight × sub-score).
- Cash flow +16.4/30.0
- ARV discount +13.8/15.0
- DSCR +5.1/10.0
- 1% rule +3.4/10.0
- Livability +3.2/5.0
- Rent growth +2.5/5.0
- Condition / age +2.5/5.0
- Schools +1.7/10.0
- Appreciation +0.0/10.0
$199,999
🖨 Deal sheet (PDF) 📄 Offer letter ✓ Due diligence
Listing remarks MLS
GREAT HOME FOR FAMILY LIVING AS WELL AS GREAT ENTERTAINING! THIS FAMILY DREAM HAS A POOL AND HUGE COVERED PATIO (16 X 30). NEW CARPET! GREAT NEIGHBORHOOD. GREAT LOCATION!
Key facts
- 0.37 acre lot
- Parking
- Built 1970
Property features AI
Exterior
- Parking: Driveway with three parking pads
- Security: Fire alarm
- Utilities: Electricity available; Natural gas available; High-speed internet available; Public water; Public sewer
- Home design: Single-story home; Brick construction; Slab foundation
- Construction: Brick exterior; Built according to public records
- Exterior features: Covered patio; Covered porch; Porch; Fully fenced yard; Full perimeter fencing; Level lot; Mature trees; City lot in a subdivision; Public paved road frontage
Interior
- Kitchen: Dishwasher; Electric range; Plumbed for ice maker
- Bedrooms: Three bedrooms on the first floor
- Flooring: Carpet; Tile; Wood
- Bathrooms: Two full bathrooms
- Heating & cooling: Central heating (gas); Central air conditioning; Ceiling fans; Electric cooling components
- Interior features: Blinds and double-pane windows; Insulated doors; Pull-down attic stairs; Window treatments; Breakfast bar; Programmable thermostat
- Laundry & utility: Washer hookup; Dryer hookup; Gas water heater
Neighborhood map
What this means for you Summary
Snapshot
- This is a 4-bed/2.0-bath single-family listed at $200k.
Deal economics
- At list price, monthly cash flow is $113 ($1k/yr) — positive.
- The deal already cash-flows at list — no discount required.
- To meet the 1% rule (rent ≥ 1% of price), the offer needs to be $168k (16.2% below list).
- Recommended offer: $168k (16.2% below list) — sets the bar for 1% rule.
Location & tenants
- Location reads 65/100 on livability (#138 in AL) — a middle-class / working-renter tenant base. Strengths: cost of living A+, housing A+; Watch: employment D, crime F, amenities D-.
- Montgomery County (urban): math 9% / reading 31% proficiency, ranked #106 of 129 in AL (top 82%) — low school quality limits family demand, transient renter base, plan for 1-2y turnover; 70% free/reduced lunch — lower-income household profile, screen leases tightly.
- Zoned schools: Dannelly Elementary School (math 2% / reading 21%, grade F, #556 of 627 statewide, top 89%, 622 students, 88% FRL); Brewbaker Middle School (math 0% / reading 19%, grade F, #227 of 257 statewide, top 90%, 838 students, 91% FRL); Jefferson Davis High School (math 3% / reading 16%, grade F, #258 of 305 statewide, top 85%, 1,522 students, 83% FRL) — zoned schools average 87% FRL vs 70% district-wide (17 pts higher); higher-poverty schools than district average — tighter screening recommended.
- Market conditions: 114 active listings in the ZIP; 31 comparable units currently listed for rent nearby; rentals at typical pace (median 23d on market — plan ~3-4 weeks tenant-placement turnaround); 45% of comp listings sitting > 30 days — soft ceiling on asking rent; 460 units permitted in Montgomery County in 2024 (37 in 5+ unit buildings).
Forward outlook
- Local home prices are declining (-3.0%/yr); year-one equity from $1k of loan paydown is wiped out by about $6k of value loss. Plan a longer hold.
- Montgomery County population projected to shrink 8% by 2050 — rents likely to lag national; underwrite the cash flow, not the appreciation.
Negotiation context
- Only 6 days on market — expect competitive offers; lowballing is unlikely to land.
- 6 sale attempts since 27y ago with the ask held roughly flat each time — persistent listings suggest the price (not the market) is what's stuck; bring a comps-based counter.
- Current owner paid $73k; list at $200k implies a 173% gain — meaningful room to come down on a strong offer.
Risks & watch-outs
- Climate carrying-cost: severe wind risk, 80% chance of damaging wind over 30y; extreme-heat days projected 7→21/yr by 2055 (HVAC capex compounding) — expect insurance premiums to compound above CPI over the hold.
Questions for the listing agent
- Built in 1970 — when were the roof, HVAC, electrical panel, plumbing, and water heater last replaced?
- Is there a deadline driving the sale (1031 exchange, divorce, estate, relocation)? That informs how much negotiation room exists.
- Crime grade is F in this area — have there been break-ins, vandalism, or insurance claims at this property in the last 3 years? What carrier currently insures it and at what premium?
- The area grade is low — what's the realistic commute time and amenity access for the typical tenant pool here? Any planned neighborhood developments (good or bad) we should know about?
- What's the average days-on-market for RENTAL listings here right now (not sales)? A rising rental-DOM trend means longer vacancies and softer asking-rent achievability than the comps imply.
- What's the recent tenant-quality profile in this submarket — average credit score on applications, eviction rate, late-payment / NSF rate, and stable-employment percentage? A property-management company in the area should have these aggregated.
- How much new for-sale + rental construction is in the pipeline within 1–3 miles? Heavy new supply typically softens prices + rents 12–24 months out; constrained supply supports both.
Investment metrics
- 1% rule
- 0.84% ✗
- Cap rate
- 6.97%
- Cash-on-cash
- 2.41%
- DSCR
- 1.11
- GRM
- 9.9
CMA / ARV
- ARV (on-the-fly)
- $232,648
- Comps found
- 12
Show comp detail 12 sales within ~0.75 mi
| Address | Dist | Beds/Ba | Sqft | Sold | Price | $/sf | Match |
|---|---|---|---|---|---|---|---|
| 3383 Warrenton Rd | 0.24mi | 4/3.0 | 2,274 (+2%) | 6mo | $255,000 | $112 | 77 |
| 2445 Winchester Rd | 0.52mi | 4/2.0 | 2,183 (-2%) | 7mo | $230,000 | $105 | 66 |
| 2801 Crawford St | 0.26mi | 4/3.0 | 2,564 (+15%) | 1mo | $260,000 | $101 | 59 |
| 3326 Allendale Pl | 0.61mi | 3/2.5 (-1) | 2,316 (+4%) | 2mo | $240,000 | $104 | 57 |
| 2454 Hawthorn Dr | 0.64mi | 3/2.0 (-1) | 2,349 (+5%) | 3mo | $329,500 | $140 | 54 |
| 3138 Fernway Dr | 0.26mi | 3/2.0 (-1) | 1,914 (-14%) | 6mo | $150,000 | $78 | 54 |
| 3715 Dresden Ct | 0.57mi | 3/2.5 (-1) | 2,097 (-6%) | 4mo | $139,500 | $67 | 53 |
| 3254 Fieldcrest Dr | 0.74mi | 4/2.0 | 2,380 (+6%) | 3mo | $235,000 | $99 | 52 |
| 3020 Hill Hedge Dr | 0.74mi | 3/2.0 (-1) | 2,090 (-7%) | 0mo | $190,000 | $91 | 49 |
| 3469 Warrenton Rd | 0.47mi | 3/2.5 (-1) | 1,957 (-12%) | 3mo | $265,000 | $135 | 48 |
| 2484 Hawthorn Dr | 0.59mi | 3/2.5 (-1) | 2,495 (+12%) | 4mo | $325,000 | $130 | 43 |
| 2721 S Colonial Dr | 0.71mi | 3/3.0 (-1) | 2,464 (+10%) | 2mo | $185,000 | $75 | 39 |
Match score weights: distance 35% · size 25% · config 20% · recency 20%. Top-matched comps best support the ARV.
Projected returns pro-forma
-3.0% appreciation · 3.0% rent growth · sell at horizon
- IRR
- -12.5%
- Equity multiple
- 0.55×
- Total profit
- $-25,318
- Equity at exit
- $29,821
- IRR
- -3.5%
- Equity multiple
- 0.77×
- Total profit
- $-13,135
- Equity at exit
- $17,292
Cash invested: $56,000 (down + closing). Projections, not guarantees.
Landlord ↔ Tenant lean methodology
- Overall (STATE)
- 90 Strongly Landlord-Friendly
- State Alabama
- 90 Strongly Landlord-Friendly · R+15
- County
- — inherits STATE
- City
- — inherits STATE
ZIP-level market 36111
- Home prices YoY
- -6.9%
- Active inventory
- 114
- Price-to-rent
- 9.9×
Monthly cashflow live
- Estimated rent
- $1,677 high interval (Pro) →
- Mortgage (P&I)
- −$1,049
- Tax from tax record
- −$80 /mo · $961/yr
- Insurance
- −$83
- HOA
- −$0
- Vacancy / Maint / Mgmt
- −$352
- Net cashflow
- $113
Break-even live
Sensitivity live
| Price | -10% $226 | -5% $169 | +0% $113 | +5% $56 | +10% $-1 |
|---|---|---|---|---|---|
| Rent | -10% $-20 | -5% $46 | +0% $113 | +5% $179 | +10% $245 |
| Rate | -1.0pp $213 | -0.5pp $163 | base $113 | +0.5pp $61 | +1.0pp $8 |
UW: 25.0% down · 7.5% · 30yr · 1.5% tax · 5.0% vac · 8.0% maint · 8.0% mgmt
Financing live
Cash to close
- Down payment
- $50,000
- Closing costs
- $6,000
- Reserves months
- —
- Total cash needed
- —
Loan-product check · same deal, 3 products live
Conventional
25% down · 7.5% · 30yr
- Down + closing
- —
- Monthly P&I
- —
- Monthly cashflow
- —
- DSCR
- —
- Eligible?
- —
Personal DTI + credit; lowest rate.
DSCR
20% down · 8.5% · 30yr
- Down + closing
- —
- Monthly P&I
- —
- Monthly cashflow
- —
- DSCR
- —
- Eligible?
- —
No personal income docs; deal must DSCR.
Hard money
10% down · 12.0% · 12mo
- Down + closing
- —
- Monthly P&I
- —
- Monthly cashflow
- —
- DSCR
- —
- Eligible?
- —
Short-term bridge; refi at stabilization.
Rent comps 31 comps
| Address | Beds | Baths | Sqft | Rent | $/sqft | DOM | Units | Dist |
|---|---|---|---|---|---|---|---|---|
| 2440 Price St Unit C Montgomery, AL | 3.0 | 2.0 | 1800 | $1,050 | $0.58 | 46d | 1 | 0.37mi |
| 3543 Carter Hill Rd Montgomery, AL | 1.0–3.0 | 1.0–2.0 | 1120 | $925 | $0.83 | 15d | 16 | 0.44mi |
| 2983 Old Farm Rd Montgomery, AL | 3.0 | 2.0 | 2000 | $1,725 | $0.86 | 23d | 1 | 0.44mi |
| 2929 Canterbury Ct Unit 1043474P Montgomery, AL | 4.0 | 2.5 | 2464 | $2,667 | $1.08 | 23d | 1 | 0.45mi |
| 2988 Old Farm Rd Montgomery, AL | 3.0 | 2.5 | 2314 | $1,900 | $0.82 | 46d | 1 | 0.45mi |
| 3352 Ridgefield Dr Montgomery, AL | 3.0 | 2.0 | 1932 | $1,761 | $0.91 | 23d | 1 | 0.52mi |
| 3332 Allendale Pl Montgomery, AL | 3.0 | 2.0 | 2741 | $2,250 | $0.82 | 15d | 1 | 0.59mi |
| 1814 Sylvan Dr Montgomery, AL | 3.0 | 2.0 | 1785 | $1,400 | $0.78 | 23d | 1 | 0.65mi |
| 2633 Ashlawn Dr Montgomery, AL | 5.0 | 2.0 | 1681 | $1,600 | $0.95 | 46d | 1 | 0.72mi |
| 2656 Fisk Rd Montgomery, AL | 4.0 | 2.0 | 1584 | $1,400 | $0.88 | 46d | 1 | 0.78mi |
| 2651 Clement Curv Montgomery, AL | 3.0 | 2.0 | 1402 | $1,550 | $1.11 | 23d | 1 | 0.82mi |
| 3050 Bryn Mawr Rd Montgomery, AL | 3.0 | 2.0 | 2290 | $1,500 | $0.66 | 46d | 1 | 0.85mi |
| 1842 Gillespie Dr Montgomery, AL | 4.0 | 2.0 | 1620 | $1,650 | $1.02 | 46d | 1 | 0.90mi |
| 2716 Ashlawn Dr Montgomery, AL | 4.0 | 3.0 | 2829 | $1,600 | $0.57 | 23d | 1 | 0.90mi |
| 3120 Guymar Rd Montgomery, AL | 5.0 | 2.0 | 2088 | $1,750 | $0.84 | 23d | 1 | 0.92mi |
| 1827 Pinecrest Dr Montgomery, AL | 4.0 | 3.0 | 1893 | $1,550 | $0.82 | 15d | 1 | 0.94mi |
| 1738 Fairforest Dr Montgomery, AL | 3.0 | 2.0 | 2166 | $1,895 | $0.87 | 46d | 1 | 0.98mi |
| 3001 Sutton Dr Montgomery, AL | 3.0 | 3.0 | 2298 | $1,750 | $0.76 | 46d | 1 | 1.02mi |
| 2053 Gorgas St Montgomery, AL | 3.0 | 1.0 | 1955 | $1,200 | $0.61 | 23d | 1 | 1.14mi |
| 2014 Commodore St Montgomery, AL | 3.0 | 2.0 | 1613 | $1,450 | $0.90 | 15d | 1 | 1.17mi |
| 2045 Bullard St Unit 1043526P Montgomery, AL | 3.0 | 2.0 | 1797 | $2,198 | $1.22 | 46d | 1 | 1.21mi |
| 1216 Karen Rd Montgomery, AL | 3.0 | 2.0 | 1620 | $1,350 | $0.83 | 15d | 1 | 1.22mi |
| 2009 Bullard St Montgomery, AL | 5.0 | 2.0 | 1992 | $1,975 | $0.99 | 23d | 1 | 1.27mi |
| 2198 Beverly Dr Montgomery, AL | 4.0 | 2.5 | 2476 | $1,495 | $0.60 | 46d | 1 | 1.29mi |
| 1516 Charleton Dr Montgomery, AL | 3.0 | 2.0 | 1895 | $1,650 | $0.87 | 46d | 1 | 1.31mi |
| 1450 Crenshaw Pl S Montgomery, AL | 3.0 | 2.0 | 1641 | $1,775 | $1.08 | 46d | 1 | 1.33mi |
| 4285 Shamrock Ln Unit 1043850P Montgomery, AL | 5.0 | 2.0 | 1991 | $3,909 | $1.96 | 23d | 1 | 1.36mi |
| 1425 Blairwood Montgomery, AL | 3.0 | 2.0 | 1700 | $1,850 | $1.09 | 15d | 1 | 1.41mi |
| 1216 Beechdale Rd Montgomery, AL | 4.0 | 2.0 | 1495 | $1,325 | $0.89 | 46d | 1 | 1.41mi |
| 1437 Beaumont Dr Montgomery, AL | 4.0 | 2.0 | 2029 | $1,500 | $0.74 | 46d | 1 | 1.41mi |
| 3359 Bedford Ln Montgomery, AL | 4.0 | 2.0 | 1786 | $1,600 | $0.90 | 15d | 1 | 1.46mi |
Listing history 5 events
-
2026-06-21days on market $199,999 Active 6 DOM
-
2026-06-18days on market $199,999 Active 3 DOM
-
2026-06-17days on market $199,999 Active 2 DOM
-
2026-06-15remarks 699-char remark
-
2026-06-15$199,999 Active 1 DOM
ⓘ Source: listings_history table (triggers on properties + properties_extension) + one-shot
backfill from property_details.listing_events for pre-trigger history.
Tax reassessment forecast AL · Resets to sale price
- Current annual tax
- $961 · $80/mo
- Projected year-2 tax
- $961 · $80/mo
- Expected delta
- $0/yr ($0/mo · -0.0%)
ⓘ Screening estimate from a state-policy table — verify with the county assessor before closing.
Climate risk First Street
- Flood 1/10 Low FEMA zone X (unshaded) · 0% chance over 30 yrs
- Wildfire 1/10 Low
- Heat 8/10 Severe 7 d/yr ≥108°F today · 21 d/yr by 30 yrs out
- Wind 8/10 Severe 80% chance of damaging wind over 30 yrs
- Air quality 2/10 Low 1 unhealthy d/yr today · 1 by 30 yrs out
Nearby sold comps map
Loading sold comps map…
Walkable amenities ~0.75 mi
Loading nearby amenities…
Taxation est. · year 1
- Rental income
- $20,124
- − Mortgage interest
- −$11,203
- − Property taxes
- −$961
- − Insurance
- −$1,000
- − Repairs & maintenance
- −$1,610
- − Management
- −$1,610
- − Depreciation
- −$5,818
- Taxable loss
- −$2,078
- Est. tax savings @ 24.0%
- +$499
- After-tax cash flow
- $1,850/yr
For passive investors: Depreciation is non-cash, so a rental often shows a tax loss while cash-flowing — sheltering income. Rental losses are passive: they offset passive income freely, and up to $25,000/yr can offset ordinary (W-2) income if you actively participate and your MAGI is under $100k (phasing out to $0 by $150k); unused losses carry forward. On sale, claimed depreciation is recaptured at up to 25%, and gains may owe capital-gains tax (a 1031 exchange can defer both). Figures are a year-1 estimate at your 24.0% rate — not tax advice; consult a CPA.
Schools (NCES district)
- District
- Montgomery County
- NCES district ID
- 0102430
- Math proficiency
- 9% ▼ -21.00%
- Reading proficiency
- 31% ▼ -1.00%
- Median HH income
- $43,902
- Composite
- 17.24/100
- National rank
- #9093
- State rank
- #106 of 129 in AL
Livability — Montgomery
- Score
- 65/100
- State rank
- #138
- US rank
- #13416
Category grades
Schools grade is shown separately in the Schools card above.
Census & demographics
- Census place
- Montgomery, AL
- City population
- 175,913
- Population (ZIP)
- 12,196
Population outlook (Montgomery County) Hauer SSP2
- Today (2025)
- 224,008 people
- By 2030
- 221,460 · -1.1%
- By 2040
- 214,179 · -4.4%
- By 2050
- 204,912 · -8.5%
- By 2075
- 177,821 · -20.6%
- By 2100
- 145,134 · -35.2%
Race, ethnicity, and origin ACS 2023
- Neighborhood character
- Majority Black (60%)
- Race & ethnicity
- Black 60% White 34% Asian 3% Hispanic / Latino 2% Two or more races 2%
- Common ancestry
- Slovak 2% Serbian 2% Italian 1%
- Foreign-born
- 3% · China, Canada
- Languages at home
- 95% English-only · Other Indo-European 2% Spanish 1% Chinese 1%
Political lean MEDSL · Montgomery
- 2024 margin
- Solid D (+30.7) · D 64.8% · R 34.1% · Other 1.1%
- 2008→2024 swing
- +11.5pp toward D · 2008: 19.2pp · 2024: 30.7pp
- All cycles
- 2024: D+30.7 2020: D+31.5 2016: D+26.2 2012: D+24.3 2008: D+19.2
Not yet ingested
- Civics
- —
Market trends
- HPI YoY
- ▼ -11.63%
- Current HPI
- 156.4412
- Rent YoY
- —
- Metro
- —
- State GDP YoY
- ▲ 2.94%
- F500 in state
- 4
Industry mix (Fortune 500 HQ in AL)
| Industry | F500 HQs | Revenue |
|---|---|---|
| Financial Services | 1 | $8B |
|
||
| Healthcare | 1 | $5B |
|
||
Price history
+25.1% since first listed9 events — show timeline
- 2026-06-15 Listed $199,999 MAAR
- 2020-08-07 Sold (Public Records) $73,166 Public Records
- 2015-11-08 Listed $149,900 MAAR
- 2006-02-15 Sold (MLS) $165,900 MAAR
- 2005-05-03 Listed $168,900 MAAR
- 2001-05-29 Sold (MLS) $149,900 MAAR
- 2001-04-09 Listed $149,900 MAAR
- 2000-09-12 Listed $154,900 MAAR
- 1999-10-07 Listed $159,900 MAAR
Property tax history
+4.2%/yrLatest (2025): $961 · -6.6% YoY. Source: county tax records.
Cash-flow waterfall
monthlySold comps — $/sqft
last 12 mo · ≤1 miLoading sold comps…