630 S Maple Ave #18 · Montebello, CA
Flood risk 5/10 · Moderate
- FEMA flood zone
- X (unshaded)
- Chance of flooding over 30 yrs
- 0.27%
- Est. flood insurance / yr
- $507 – $1,088
Fire risk 1/10 · Minimal
- Est. fire insurance / yr
- $659 – $1,223
Heat risk 6/10 · Moderate
- Hot days now (above 95°F)
- 7 days/yr
- Hot days in 30 yrs
- 21 days/yr
Wind risk 1/10 · Minimal
- Chance of severe wind over 30 yrs
- —
Air-quality risk 6/10 · Moderate
- Unhealthy air days now
- 9 days/yr
- Unhealthy air days in 30 yrs
- 10 days/yr
Risk factors via First Street. Map © Google.
Why this score? — see what drove the B grade
The composite is a weighted blend of 9 inputs, each scored 0–100. Each bar is that input's sub-score; the figure is the points it added to the 100-point composite (weight × sub-score).
- Cash flow +30.0/30.0
- 1% rule +10.0/10.0
- DSCR +10.0/10.0
- ARV discount +9.5/15.0
- Condition / age +4.0/5.0
- Rent growth +3.7/5.0
- Livability +2.9/5.0
- Schools +2.1/10.0
- Appreciation +0.0/10.0
$99,900
🖨 Deal sheet (PDF) 📄 Offer letter ✓ Due diligence
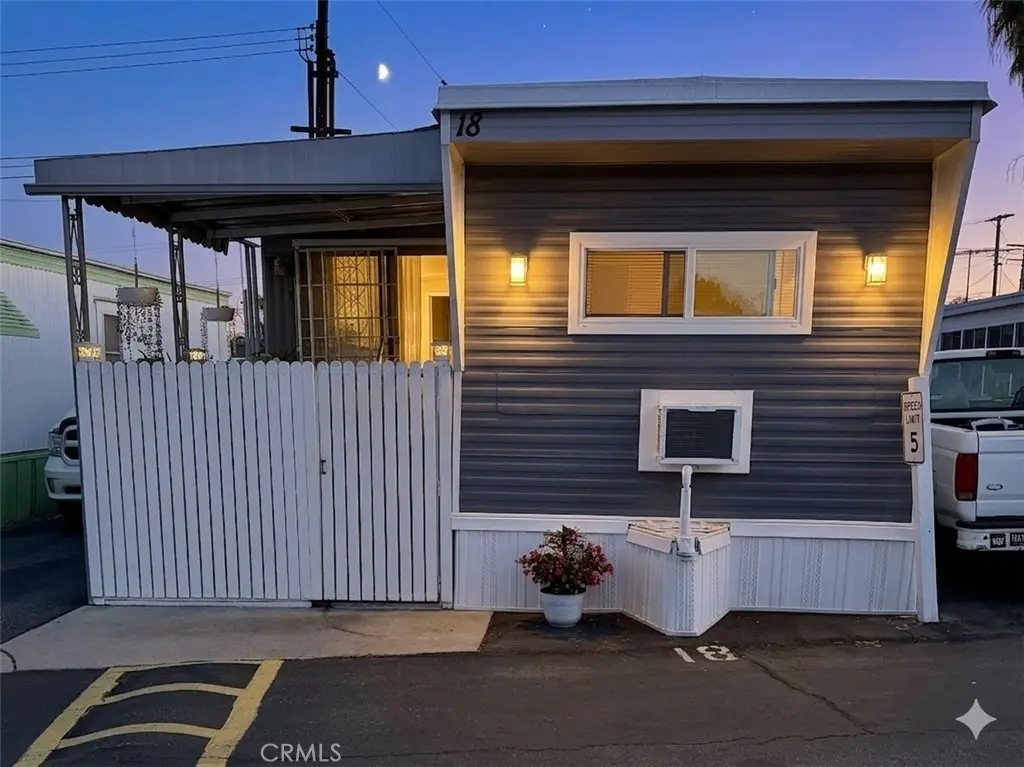
Listing remarks
Welcome to 630 S. Maple Ave. Space #18 in the City of Montebello. This beautifully maintained 2 bedroom, 1 bathroom mobile home offers approximately 612 square feet of comfortable living space and has been tastefully remodeled within the last two years. The home features laminate flooring throughout, fresh interior and exterior paint, an upgraded kitchen with granite countertops, dark wood cabinetry, and washer and dryer hookups for added convenience. The spacious living and dining areas create a warm and inviting atmosphere, while the bonus room provides additional storage or flexible use space. Enjoy your mornings or evenings on the private covered porch area, perfect for relaxing or ente
Key facts
- Remodeled
- Laminate flooring
- Upgraded kitchen
Tags
Property features AI
Finance
- Other: Lot density: 11–15 units per acre; Storm drains in community
- Financial info: Monthly land lease approximately $1,100 (seller provided)
- HOA & community: Senior community; Park: Welcome Gardens Mobile Home Park; Manager approval required; Pets: contact manager
Exterior
- Parking: Carport (2 parking spaces)
- Security: Gated community
- Utilities: Public sewer; District/public water (see remarks)
- Home design: Single-story; Entry level: ground; Mobile home remains on site; Mobile dimensions approximately 10' x 50'
- Construction: Raised/combination foundation; Year built: see remarks
- Exterior features: Vinyl fencing; Patio (wood/slab; see remarks); Two sheds; No pool
Interior
- Kitchen: Gas oven; Electric stove; Granite counters
- Bedrooms: Main floor primary bedroom; Main floor bedroom; Bonus room
- Flooring: Laminate; See remarks
- Bathrooms: One full bathroom with shower-in-tub
- Heating & cooling: Central furnace; Wall/window cooling (see remarks)
- Interior features: Ceiling fan; Granite counters; Gated community
- Laundry & utility: Laundry in kitchen
Neighborhood map
What this means for you Summary
Snapshot
- This is a 2-bed/1.0-bath manufactured listed at $100k. Condition is rated good.
Deal economics
- At list price, monthly cash flow is $870 ($10k/yr) — positive.
- The deal already cash-flows at list — no discount required.
- Meets the 1% rule at list price ($2k rent vs $100k).
- Recommended offer: $97k (3.0% below list) — sets the bar for market timing.
- Cap rate 16.7% vs local median 2.3% in Montebello — top-decile yield for the area; either an underpriced asset or a hidden risk that comps aren't pricing in. Stress-test before assuming the spread holds.
Location & tenants
- Location reads 58/100 on livability (#693 in CA) — a working-class tenant base; expect higher turnover. Strengths: employment B; Watch: schools D, amenities D, crime F.
- Montebello Unified (suburban): math 17% / reading 32% proficiency, ranked #419 of 517 in CA (top 81%) — low school quality limits family demand, transient renter base, plan for 1-2y turnover; 76% free/reduced lunch — lower-income household profile, screen leases tightly.
- Market conditions: Rents rising fast (+4.9%/yr); 167 active listings in the ZIP; 16 comparable units currently listed for rent nearby; rentals leasing fast (median 0d on market — plan ~1-2 weeks tenant-placement turnaround); solid renter incomes; 19,697 units permitted in Los Angeles County in 2024 (9,426 in 5+ unit buildings).
Forward outlook
- Local home prices are declining (-3.0%/yr); year-one equity from $691 of loan paydown is wiped out by about $3k of value loss. Plan a longer hold.
- Los Angeles County population projected at +9% by 2050 — modest demand growth; plan on rents tracking national, not racing it.
- At projected returns (-3.0% appreciation + 4.9% rent growth), your $28k cash investment doubles in ~4 years — after that, you're playing with house money.
Negotiation context
- It's been on market 41 days — a 3% lower offer ($97k) is reasonable based on typical stale-listing flexibility.
Risks & watch-outs
- Climate carrying-cost: moderate flood risk; extreme-heat days projected 7→21/yr by 2055 (HVAC capex compounding) — expect insurance premiums to compound above CPI over the hold.
Questions for the listing agent
- It's been on market 41 days. Have you received any prior offers? Is the seller open to a 3% concession, seller financing, or rate buy-down credit?
- Built in 1963 — when were the roof, HVAC, electrical panel, plumbing, and water heater last replaced?
- Is there a deadline driving the sale (1031 exchange, divorce, estate, relocation)? That informs how much negotiation room exists.
- Schools are D-rated, which usually means shorter tenancies and higher turnover. Who's the typical renter profile here, and what's been the actual vacancy rate?
- Crime grade is F in this area — have there been break-ins, vandalism, or insurance claims at this property in the last 3 years? What carrier currently insures it and at what premium?
- What's the average days-on-market for RENTAL listings here right now (not sales)? A rising rental-DOM trend means longer vacancies and softer asking-rent achievability than the comps imply.
- What's the recent tenant-quality profile in this submarket — average credit score on applications, eviction rate, late-payment / NSF rate, and stable-employment percentage? A property-management company in the area should have these aggregated.
- How much new for-sale + rental construction is in the pipeline within 1–3 miles? Heavy new supply typically softens prices + rents 12–24 months out; constrained supply supports both.
Investment metrics
- 1% rule
- 1.98% ✓
- Cap rate
- 16.74%
- Cash-on-cash
- 37.30%
- DSCR
- 2.66
- GRM
- 4.2
CMA / ARV
- ARV (median comp)
- $104,656
- List price
- $99,900
- Delta
- -4.54%
- Verdict
- FAIR
- Comps
- 2 within 1.0 mi
Show comp detail 1 sale within ~0.75 mi
| Address | Dist | Beds/Ba | Sqft | Sold | Price | $/sf | Match |
|---|---|---|---|---|---|---|---|
| 1428 Beach St | 0.19mi | 2/1.0 | 585 (-4%) | 22mo | $99,000 | $169 | 65 |
Match score weights: distance 35% · size 25% · config 20% · recency 20%. Top-matched comps best support the ARV.
Projected returns pro-forma
-3.0% appreciation · 4.94% rent growth · sell at horizon
- IRR
- 35.4%
- Equity multiple
- 2.54×
- Total profit
- $43,154
- Equity at exit
- $14,895
- IRR
- 43.2%
- Equity multiple
- 5.50×
- Total profit
- $125,789
- Equity at exit
- $8,638
Cash invested: $27,972 (down + closing). Projections, not guarantees.
Landlord ↔ Tenant lean methodology
- Overall (STATE)
- 18 Strongly Tenant-Friendly
- State California
- 18 Strongly Tenant-Friendly · D+13
- County
- — inherits STATE
- City
- — inherits STATE
ZIP-level market 90640
- Rents YoY
- 4.9%
- Active inventory
- 167
- Price-to-rent
- 4.2×
Monthly cashflow live
- Estimated rent
- $1,975 high interval (Pro) →
- Mortgage (P&I)
- −$524
- Tax est. 1.5%
- −$125 /mo · $1,498/yr
- Insurance
- −$42
- HOA
- −$0
- Vacancy / Maint / Mgmt
- −$415
- Net cashflow
- $870
Break-even live
Sensitivity live
| Price | -10% $939 | -5% $904 | +0% $870 | +5% $835 | +10% $801 |
|---|---|---|---|---|---|
| Rent | -10% $714 | -5% $792 | +0% $870 | +5% $948 | +10% $1,026 |
| Rate | -1.0pp $920 | -0.5pp $895 | base $870 | +0.5pp $844 | +1.0pp $817 |
UW: 25.0% down · 7.5% · 30yr · 1.5% tax · 5.0% vac · 8.0% maint · 8.0% mgmt
Financing live
Cash to close
- Down payment
- $24,975
- Closing costs
- $2,997
- Reserves months
- —
- Total cash needed
- —
Loan-product check · same deal, 3 products live
Conventional
25% down · 7.5% · 30yr
- Down + closing
- —
- Monthly P&I
- —
- Monthly cashflow
- —
- DSCR
- —
- Eligible?
- —
Personal DTI + credit; lowest rate.
DSCR
20% down · 8.5% · 30yr
- Down + closing
- —
- Monthly P&I
- —
- Monthly cashflow
- —
- DSCR
- —
- Eligible?
- —
No personal income docs; deal must DSCR.
Hard money
10% down · 12.0% · 12mo
- Down + closing
- —
- Monthly P&I
- —
- Monthly cashflow
- —
- DSCR
- —
- Eligible?
- —
Short-term bridge; refi at stabilization.
Rent comps 16 comps
| Address | Beds | Baths | Sqft | Rent | $/sqft | DOM | Units | Dist |
|---|---|---|---|---|---|---|---|---|
| 537 S 6th St Unit B Montebello, CA | 1.0 | 1.0 | 550 | $1,950 | $3.55 | 11d | 1 | 0.46mi |
| 1715 W Olympic Blvd Montebello, CA | 1.0 | 1.0 | 702 | $2,065 | $2.94 | 0d | 1 | 0.49mi |
| 113 California Ave Unit 3 Montebello, CA | 1.0 | 1.0 | 600 | $1,695 | $2.83 | 0d | 1 | 0.59mi |
| 112 N Spruce St Unit 12A Montebello, CA | 1.0 | 1.0 | 580 | $1,895 | $3.27 | 0d | 1 | 0.75mi |
| 2051 W Whittier Blvd Montebello, CA | 1.0 | 1.0 | 700 | $1,050 | $1.50 | 45d | 1 | 0.75mi |
| 1020 Carob Way Unit M Montebello, CA | 1.0 | 1.0 | 728 | $1,995 | $2.74 | 0d | 1 | 0.76mi |
| 145 N 18th St Montebello, CA | 1.0 | 1.0 | 750 | $2,000 | $2.67 | 21d | 1 | 0.79mi |
| 1204 S Spruce St Montebello, CA | 1.0 | 1.0 | 360 | $1,850 | $5.14 | 0d | 1 | 0.91mi |
| 213 N 7th St Unit 213 Montebello, CA | 1.0 | 1.0 | 690 | $1,800 | $2.61 | 45d | 1 | 0.91mi |
| 1235 S Spruce St Apt E Montebello, CA | 1.0 | 1.0 | 600 | $1,700 | $2.83 | 0d | 1 | 0.98mi |
| 336 N Garfield Ave Unit M-500 Montebello, CA | 1.0 | 1.0 | 675 | $2,350 | $3.48 | 11d | 1 | 1.14mi |
| 336 N Garfield Ave Unit M-509A Montebello, CA | 1.0 | 1.0 | 675 | $2,275 | $3.37 | 0d | 1 | 1.14mi |
| 241 E Fremont Sq Unit 11 Montebello, CA | 1.0 | 1.0 | 619 | $1,850 | $2.99 | 0d | 1 | 1.30mi |
| 2431 W Beverly Blvd Montebello, CA | 1.0 | 1.0 | 600 | $1,800 | $3.00 | 0d | 1 | 1.36mi |
| 2433 W Beverly Blvd Unit 1/2 Montebello, CA | 2.0 | 1.0 | 700 | $2,190 | $3.13 | 14d | 1 | 1.36mi |
| 2529 W Beverly Blvd Unit 6 Montebello, CA | 1.0 | 1.0 | 388 | $1,795 | $4.63 | 0d | 1 | 1.40mi |
Listing history 16 events
-
2026-06-21days on market $99,900 Active 41 DOM
-
2026-06-18days on market $99,900 Active 38 DOM
-
2026-06-17days on market $99,900 Active 37 DOM
-
2026-06-16days on market $99,900 Active 36 DOM
-
2026-06-15days on market $99,900 Active 35 DOM
-
2026-06-13days on market $99,900 Active 33 DOM
-
2026-06-13days on market $99,900 Active 32 DOM
-
2026-06-09days on market $99,900 Active 29 DOM
-
2026-06-08days on market $99,900 Active 28 DOM
-
2026-06-07days on market $99,900 Active 27 DOM
-
2026-06-04days on market $99,900 Active 24 DOM
-
2026-06-03days on market $99,900 Active 23 DOM
-
2026-06-02days on market $99,900 Active 22 DOM
-
2026-06-01days on market $99,900 Active 21 DOM
-
2026-05-31days on market $99,900 Active 20 DOM
-
2026-05-11$99,900 Active 961-char remark
ⓘ Source: listings_history table (triggers on properties + properties_extension) + one-shot
backfill from property_details.listing_events for pre-trigger history.
Climate risk First Street
- Flood 5/10 Major FEMA zone X (unshaded) · 27% chance over 30 yrs
- Wildfire 1/10 Low
- Heat 6/10 Major 7 d/yr ≥95°F today · 21 d/yr by 30 yrs out
- Wind 1/10 Low
- Air quality 6/10 Major 9 unhealthy d/yr today · 10 by 30 yrs out
Nearby sold comps map
Loading sold comps map…
Walkable amenities ~0.75 mi
Loading nearby amenities…
Taxation est. · year 1
- Rental income
- $23,696
- − Mortgage interest
- −$5,596
- − Property taxes
- −$1,498
- − Insurance
- −$500
- − Repairs & maintenance
- −$1,896
- − Management
- −$1,896
- − Depreciation
- −$2,906
- Taxable income
- $9,404
- Est. tax owed @ 24.0%
- −$2,257
- After-tax cash flow
- $8,178/yr
For passive investors: Depreciation is non-cash, so a rental often shows a tax loss while cash-flowing — sheltering income. Rental losses are passive: they offset passive income freely, and up to $25,000/yr can offset ordinary (W-2) income if you actively participate and your MAGI is under $100k (phasing out to $0 by $150k); unused losses carry forward. On sale, claimed depreciation is recaptured at up to 25%, and gains may owe capital-gains tax (a 1031 exchange can defer both). Figures are a year-1 estimate at your 24.0% rate — not tax advice; consult a CPA.
Condition & rehab AI · 21 photos
This beautifully maintained 2-bedroom mobile home has been tastefully remodeled within the last two years and offers a good condition with laminate flooring, fresh paint, and an upgraded kitchen. The home is move-in ready and has a good curb appeal with a private covered porch area. The property has a good condition score of 80 and a rehab level of cosmetic.
Value-add opportunities
- Both Paint exterior and interior walls — Fresh paint enhances curb appeal and interior aesthetics.
- Resale Replace countertops with quartz or granite — Quartz or granite countertops are more durable and aesthetically pleasing, increasing resale value.
- Both Install smart home devices — Smart home devices improve convenience and energy efficiency, enhancing both resale and rental value.
- Both Upgrade flooring to hardwood or tile — Hardwood or tile flooring is more durable and aesthetically pleasing, increasing both resale and rental value.
- Both Add a small outdoor patio or garden — An outdoor patio or garden can increase the home's appeal and value, especially for rental properties.
- Both Install a smart thermostat — A smart thermostat can improve energy efficiency and comfort, enhancing both resale and rental value.
- Both Add a small outdoor patio or garden — An outdoor patio or garden can increase the home's appeal and value, especially for rental properties.
Renovation cost estimate screening
Value-add ROI direction
- Both Paint exterior and interior walls — Fresh paint enhances curb appeal and interior aesthetics. ↑
- Resale Replace countertops with quartz or granite — Quartz or granite countertops are more durable and aesthetically pleasing, increasing resale value. ↑
- Both Install smart home devices — Smart home devices improve convenience and energy efficiency, enhancing both resale and rental value. ↑
- Both Upgrade flooring to hardwood or tile — Hardwood or tile flooring is more durable and aesthetically pleasing, increasing both resale and rental value. ↑
- Both Add a small outdoor patio or garden — An outdoor patio or garden can increase the home's appeal and value, especially for rental properties. ↑
- Both Install a smart thermostat — A smart thermostat can improve energy efficiency and comfort, enhancing both resale and rental value. ↑
- Both Add a small outdoor patio or garden — An outdoor patio or garden can increase the home's appeal and value, especially for rental properties. ↑
ⓘ Cost ranges are severity-bucket heuristics (US national rule-of-thumb). Get contractor quotes + a written scope before underwriting a rehab budget.
Schools (NCES district)
- District
- Montebello Unified
- NCES district ID
- 0625470
- Math proficiency
- 17% ▼ -7.00%
- Reading proficiency
- 32% ▼ -5.00%
- Median HH income
- $45,250
- Composite
- 21.13/100
- National rank
- #8433
- State rank
- #419 of 517 in CA
Livability — Montebello
- Score
- 58/100
- State rank
- #693
- US rank
- #21068
Category grades
Schools grade is shown separately in the Schools card above.
Census & demographics
- Census place
- Montebello, CA
- County
- Los Angeles County · 9,444,647 people
- City population
- 61,382
- Metro
- Los Angeles-Long Beach-Anaheim, CA
- Population (ZIP)
- 61,382
- Household income
- $79,625
- Rent vs Own
- Severe rent burden
- 3045.0
Population outlook (Los Angeles County) Hauer SSP2
- Today (2025)
- 10,940,515 people
- By 2030
- 11,256,481 · +2.9%
- By 2040
- 11,729,929 · +7.2%
- By 2050
- 11,948,407 · +9.2%
- By 2075
- 11,818,114 · +8.0%
- By 2100
- 10,842,928 · -0.9%
Race, ethnicity, and origin ACS 2023
- Neighborhood character
- Predominantly Hispanic (79%)
- Race & ethnicity
- Hispanic / Latino 79% Two or more races 19% Asian 13% White 6% Native American 3%
- Hispanic origin (detail)
- Mexican 68%
- Foreign-born
- 36% · Canada, China, Vietnam
- Languages at home
- 28% English-only · Spanish 58% Chinese 6% Other Indo-European 4%
Political lean MEDSL · Los Angeles
- 2024 margin
- Solid D (+32.9) · D 64.8% · R 31.9% · Other 3.3%
- 2008→2024 swing
- -7.4pp toward R · 2008: 40.4pp · 2024: 32.9pp
- All cycles
- 2024: D+32.9 2020: D+44.2 2016: D+48.0 2012: D+40.0 2008: D+40.4
Not yet ingested
- Civics
- —
Market trends
- HPI YoY
- ▼ -812.47%
- Current HPI
- 366.3118
- Rent YoY
- ▲ 4.94%
- Metro
- Los Angeles-Long Beach-Anaheim, CA
- State GDP YoY
- ▲ 3.21%
- F500 in state
- 116
Industry mix (Fortune 500 HQ in CA)
| Industry | F500 HQs | Revenue |
|---|---|---|
| Technology | 27 | $1,492B |
|
||
| Financial Services | 3 | $174B |
|
||
| Retail | 3 | $44B |
|
||
| Insurance | 3 | $26B |
|
||
| Media / Entertainment | 2 | $115B |
|
||
| Pharmaceuticals / Biotech | 2 | $62B |
|
||
Price history
1 event — show timeline
- 2026-05-11 Listed $99,900 CRMLS
Cash-flow waterfall
monthlySold comps — $/sqft
last 12 mo · ≤1 miLoading sold comps…