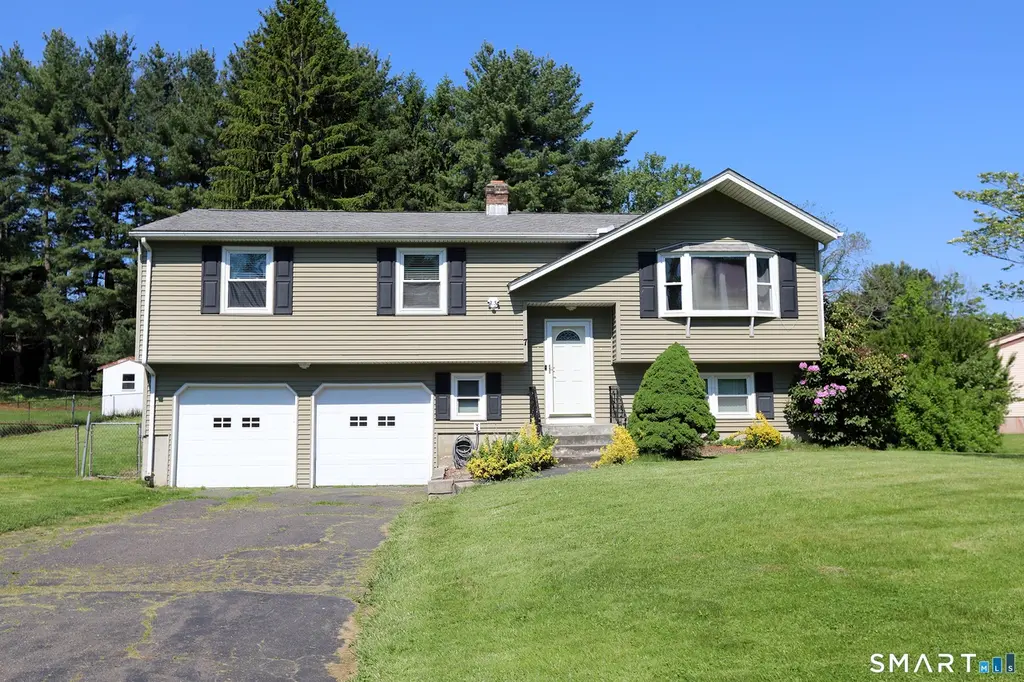
7 Jonathan Pl · Blue Hills, CT
Flood risk No data
- FEMA flood zone
- —
- Chance of flooding over 30 yrs
- —
- Est. flood insurance / yr
- —
Fire risk No data
- Est. fire insurance / yr
- —
Heat risk No data
- Hot days now (above threshold)
- —
- Hot days in 30 yrs
- —
Wind risk No data
- Chance of severe wind over 30 yrs
- —
Air-quality risk No data
- Unhealthy air days now
- —
- Unhealthy air days in 30 yrs
- —
Risk factors via First Street. Map © Google.
Why this score? — see what drove the D- grade
The composite is a weighted blend of 9 inputs, each scored 0–100. Each bar is that input's sub-score; the figure is the points it added to the 100-point composite (weight × sub-score).
- Cash flow +10.6/30.0
- ARV discount +8.7/15.0
- 1% rule +4.3/10.0
- Livability +4.0/5.0
- Rent growth +3.3/5.0
- DSCR +3.1/10.0
- Condition / age +2.5/5.0
- Schools +2.2/10.0
- Appreciation +0.0/10.0
$325,000
🖨 Deal sheet (PDF) 📄 Offer letter ✓ Due diligence
Listing remarks MLS
RECENTLY RENOVATED HOME IN A NICE NEIGHBORHOOD IS A MUST SEE. UP DATED KITCHEN WITH TILED FLOORING, BATHROOM, ROOF, WOOD BURNING STOVE IN FAMILY ROOM AND NICE BACK YARD.
Key facts
- 0.46 acre lot
- 2 garage spots
- Built 1977
Property features AI
Exterior
- Parking: Attached under-house garage (2-car); Driveway parking; Total parking for 6 vehicles
- Utilities: Public water connected; Public sewer connected; Electric hot water; Oil fuel for heating
- Home design: Single family home; White exterior
- Construction: Frame construction; Concrete foundation; Shingle roof
- Exterior features: Deck; Shed; Fully fenced yard; Level, cleared lot on a cul-de-sac; Private paved driveway
Interior
- Kitchen: Oven/Range; Microwave; Refrigerator; Dishwasher
- Bedrooms: 3 bedrooms
- Bathrooms: 2 full bathrooms; 1 half bathroom
- Heating & cooling: Hot water heating (oil-fired) ; Central air conditioning; Oil tank located in garage
- Interior features: Auto garage door opener; Cable available; Open floor plan; Finished, heated full basement with walk-out and interior and garage access; Has attic (crawl space with access via hatch); One fireplace; Seven total rooms
- Laundry & utility: Laundry located in downstairs half bath (lower level); 50-gallon electric hot water tank
Neighborhood map
What this means for you Summary
Snapshot
- This is a 3-bed/2.0-bath single-family listed at $325k.
Deal economics
- At list price, monthly cash flow is $-161 ($-2k/yr) — negative.
- To cash-flow at today's rent, offer at most $297k (8.7% below list).
- To meet the 1% rule (rent ≥ 1% of price), the offer needs to be $304k (6.6% below list).
- Recommended offer: $297k (8.7% below list) — sets the bar for cash-flow.
- Cap rate 5.7% vs local median 4.7% in Blue Hills — meaningfully above typical; check what's discounted (condition, days-on-market, listing class) to confirm the premium yield is real.
Location & tenants
- Location reads 81/100 on livability (#14 in CT, #1,343 nationally) — a professional / high-income tenant draw. Strengths: crime A+, commute A+, housing A+; Watch: amenities F.
- Bloomfield School District (suburban): math 16% / reading 30% proficiency, ranked #137 of 153 in CT (top 90%) — low school quality limits family demand, transient renter base, plan for 1-2y turnover.
- Zoned schools: Laurel School (307 students, 67% FRL); Carmen Arace Middle School (math 19% / reading 30%, grade F, #153 of 175 statewide, top 88%, 246 students, 61% FRL); Bloomfield High School (math 17% / reading 47%, grade F, #129 of 194 statewide, top 69%, 525 students, 58% FRL) — zoned schools average 62% FRL vs 44% district-wide (17 pts higher); higher-poverty schools than district average — tighter screening recommended.
- Market conditions: Rents rising (+3.1%/yr); 67 active listings in the ZIP; 4 comparable units currently listed for rent nearby; rentals leasing fast (median 4d on market — plan ~1-2 weeks tenant-placement turnaround); solid renter incomes; 1,867 units permitted in Capitol Planning Region in 2024 (1,399 in 5+ unit buildings).
- This rent runs 37% of the median local income ($98k/yr) — at the standard rent-burdened threshold; future hikes will face affordability resistance.
Forward outlook
- Local home prices are declining (-3.0%/yr); year-one equity from $2k of loan paydown is wiped out by about $10k of value loss. Plan a longer hold.
Negotiation context
- Only 5 days on market — expect competitive offers; lowballing is unlikely to land.
- 2 sale attempts since 11y ago with the ask held roughly flat each time — persistent listings suggest the price (not the market) is what's stuck; bring a comps-based counter.
- Current owner paid $200k; list at $325k implies a 62% gain — meaningful room to come down on a strong offer.
Risks & watch-outs
- Watch-outs: property tax is 2.7% of price.
Questions for the listing agent
- What do current leases actually rent for vs. the listed asking? Can we see a recent rent roll and the last 12 months of T-12 income?
- Built in 1977 — when were the roof, HVAC, electrical panel, plumbing, and water heater last replaced?
- Property tax is high relative to price — has the assessment been appealed recently, and will the sale trigger a re-assessment?
- Is there a deadline driving the sale (1031 exchange, divorce, estate, relocation)? That informs how much negotiation room exists.
- Schools are F-rated, which usually means shorter tenancies and higher turnover. Who's the typical renter profile here, and what's been the actual vacancy rate?
- The area grade is low — what's the realistic commute time and amenity access for the typical tenant pool here? Any planned neighborhood developments (good or bad) we should know about?
- What's the average days-on-market for RENTAL listings here right now (not sales)? A rising rental-DOM trend means longer vacancies and softer asking-rent achievability than the comps imply.
- What's the recent tenant-quality profile in this submarket — average credit score on applications, eviction rate, late-payment / NSF rate, and stable-employment percentage? A property-management company in the area should have these aggregated.
- How much new for-sale + rental construction is in the pipeline within 1–3 miles? Heavy new supply typically softens prices + rents 12–24 months out; constrained supply supports both.
Investment metrics
- 1% rule
- 0.93% ✗
- Cap rate
- 5.70%
- Cash-on-cash
- -2.12%
- DSCR
- 0.91
- GRM
- 8.9
CMA / ARV
- ARV (on-the-fly)
- $333,592
- Comps found
- 6
Show comp detail 6 sales within ~0.75 mi
| Address | Dist | Beds/Ba | Sqft | Sold | Price | $/sf | Match |
|---|---|---|---|---|---|---|---|
| 28 Carpenter Ln | 0.53mi | 3/2.5 | 1,220 (-5%) | 6mo | $350,000 | $287 | 60 |
| 216 Woodland Ave | 0.38mi | 3/1.5 | 1,234 (-4%) | 21mo | $320,000 | $259 | 55 |
| 35 Mills Ln | 0.64mi | 3/1.0 | 1,205 (-6%) | 10mo | $285,000 | $237 | 47 |
| 11 Longview Dr | 0.70mi | 4/2.5 (+1) | 1,220 (-5%) | 12mo | $410,000 | $336 | 42 |
| 141 Tunxis Ave | 0.62mi | 3/2.0 | 1,459 (+13%) | 13mo | $240,000 | $164 | 38 |
| 102 Woodland Ave | 0.45mi | 3/1.0 | 1,442 (+12%) | 22mo | $247,268 | $171 | 37 |
Match score weights: distance 35% · size 25% · config 20% · recency 20%. Top-matched comps best support the ARV.
Projected returns pro-forma
-3.0% appreciation · 3.11% rent growth · sell at horizon
- IRR
- -19.6%
- Equity multiple
- 0.32×
- Total profit
- $-62,331
- Equity at exit
- $48,459
- IRR
- -11.9%
- Equity multiple
- 0.28×
- Total profit
- $-65,113
- Equity at exit
- $28,100
Cash invested: $91,000 (down + closing). Projections, not guarantees.
Landlord ↔ Tenant lean methodology
- Overall (STATE)
- 27 Tenant-Leaning
- State Connecticut
- 27 Tenant-Leaning · D+7
- County
- — inherits STATE
- City
- — inherits STATE
ZIP-level market 06002
- Rents YoY
- 3.1%
- Active inventory
- 67
- Price-to-rent
- 8.9×
Monthly cashflow live
- Estimated rent
- $3,036 medium interval (Pro) →
- Mortgage (P&I)
- −$1,704
- Tax from tax record
- −$720 /mo · $8,634/yr
- Insurance
- −$135
- HOA
- −$0
- Vacancy / Maint / Mgmt
- −$638
- Net cashflow
- $-161
Break-even live
Sensitivity live
| Price | -10% $23 | -5% $-69 | +0% $-161 | +5% $-253 | +10% $-345 |
|---|---|---|---|---|---|
| Rent | -10% $-401 | -5% $-281 | +0% $-161 | +5% $-41 | +10% $79 |
| Rate | -1.0pp $3 | -0.5pp $-78 | base $-161 | +0.5pp $-245 | +1.0pp $-331 |
UW: 25.0% down · 7.5% · 30yr · 1.5% tax · 5.0% vac · 8.0% maint · 8.0% mgmt
Financing live
Cash to close
- Down payment
- $81,250
- Closing costs
- $9,750
- Reserves months
- —
- Total cash needed
- —
Loan-product check · same deal, 3 products live
Conventional
25% down · 7.5% · 30yr
- Down + closing
- —
- Monthly P&I
- —
- Monthly cashflow
- —
- DSCR
- —
- Eligible?
- —
Personal DTI + credit; lowest rate.
DSCR
20% down · 8.5% · 30yr
- Down + closing
- —
- Monthly P&I
- —
- Monthly cashflow
- —
- DSCR
- —
- Eligible?
- —
No personal income docs; deal must DSCR.
Hard money
10% down · 12.0% · 12mo
- Down + closing
- —
- Monthly P&I
- —
- Monthly cashflow
- —
- DSCR
- —
- Eligible?
- —
Short-term bridge; refi at stabilization.
Rent comps 4 comps
| Address | Beds | Baths | Sqft | Rent | $/sqft | DOM | Units | Dist |
|---|---|---|---|---|---|---|---|---|
| 627 Brighton Park Way Bloomfield, CT | 1.0–2.0 | 1.0–2.0 | 883 | $2,757 | $3.12 | 3d | 10 | 0.64mi |
| 55 Tunxis Ave Bloomfield, CT | 1.0–3.0 | 1.0–2.0 | 1003 | $2,850 | $2.84 | 45d | 1 | 0.86mi |
| 95 Filley St Bloomfield, CT | 1.0–2.0 | 1.0–2.0 | 1020 | $2,660 | $2.61 | 3d | 7 | 0.87mi |
| 100 Ryefield Village Dr Bloomfield, CT | 2.0–4.0 | 2.5 | 1692 | $4,046 | $2.39 | 3d | 9 | 1.13mi |
Listing history 6 events
-
2026-05-19historical $325,000
-
2016-02-26soldstatus $200,000
-
2016-02-25soldstatus $199,900 169-char remark
Show marketing remark (169 chars)
RECENTLY RENOVATED HOME IN A NICE NEIGHBORHOOD IS A MUST SEE. UP DATED KITCHEN WITH TILED FLOORING, BATHROOM, ROOF, WOOD BURNING STOVE IN FAMILY ROOM AND NICE BACK YARD.
-
2015-09-10$200,000 169-char remark
Show marketing remark (169 chars)
RECENTLY RENOVATED HOME IN A NICE NEIGHBORHOOD IS A MUST SEE. UP DATED KITCHEN WITH TILED FLOORING, BATHROOM, ROOF, WOOD BURNING STOVE IN FAMILY ROOM AND NICE BACK YARD.
-
1998-01-26soldstatus $108,000
-
1994-05-19soldstatus $131,000
ⓘ Source: listings_history table (triggers on properties + properties_extension) + one-shot
backfill from property_details.listing_events for pre-trigger history.
Tax reassessment forecast CT · Partial reset (capped growth)
- Current annual tax
- $8,634 · $720/mo
- Projected year-2 tax
- $8,634 · $720/mo
- Expected delta
- $0/yr ($0/mo · 0.0%)
ⓘ Screening estimate from a state-policy table — verify with the county assessor before closing.
Nearby sold comps map
Loading sold comps map…
Walkable amenities ~0.75 mi
Loading nearby amenities…
Taxation est. · year 1
- Rental income
- $36,432
- − Mortgage interest
- −$18,205
- − Property taxes
- −$8,634
- − Insurance
- −$1,625
- − Repairs & maintenance
- −$2,915
- − Management
- −$2,915
- − Depreciation
- −$9,455
- Taxable loss
- −$7,316
- Est. tax savings @ 24.0%
- +$1,756
- After-tax cash flow
- $-174/yr
For passive investors: Depreciation is non-cash, so a rental often shows a tax loss while cash-flowing — sheltering income. Rental losses are passive: they offset passive income freely, and up to $25,000/yr can offset ordinary (W-2) income if you actively participate and your MAGI is under $100k (phasing out to $0 by $150k); unused losses carry forward. On sale, claimed depreciation is recaptured at up to 25%, and gains may owe capital-gains tax (a 1031 exchange can defer both). Figures are a year-1 estimate at your 24.0% rate — not tax advice; consult a CPA.
Schools (NCES district)
- District
- Bloomfield School District
- NCES district ID
- 0900330
- Math proficiency
- 16% ▼ -13.00%
- Reading proficiency
- 30% ▼ -12.00%
- Median HH income
- $71,180
- Composite
- 22.37/100
- National rank
- #8120
- State rank
- #137 of 153 in CT
Livability — Blue Hills
- Score
- 81/100
- State rank
- #14
- US rank
- #1343
Category grades
Schools grade is shown separately in the Schools card above.
Census & demographics
- County
- Hartford County · 754,208 people
- Metro
- Hartford-East Hartford-Middletown, CT
- Population (ZIP)
- 21,865
- Household income
- $98,162
- Rent vs Own
- Severe rent burden
- 692.0
Population outlook (Capitol County) Hauer SSP2
- By 2040
- 1,063,519
Race, ethnicity, and origin ACS 2023
- Neighborhood character
- Diverse neighborhood (Simpson 0.61)
- Race & ethnicity
- Black 54% White 30% Hispanic / Latino 8% Two or more races 6% Asian 4%
- Hispanic origin (detail)
- Puerto Rican 4%
- Common ancestry
- Romanian 2% Lithuanian 2% Scotch-Irish 2%
- Foreign-born
- 25% · Canada, Vietnam, China
- Languages at home
- 82% English-only · Spanish 6% Other Indo-European 2% French/Haitian/Cajun 2%
Political lean MEDSL · Capitol
- 2024 margin
- Strong D (+21.9) · D 60.1% · R 38.2% · Other 1.7%
- All cycles
- 2024: D+21.9
Not yet ingested
- Civics
- —
Market trends
- HPI YoY
- ▼ -175.76%
- Current HPI
- 198.4604
- Rent YoY
- ▲ 3.11%
- Metro
- Hartford-East Hartford-Middletown, CT
- State GDP YoY
- ▲ 1.06%
- F500 in state
- 38
Industry mix (Fortune 500 HQ in CT)
| Industry | F500 HQs | Revenue |
|---|---|---|
| Industrial Machinery | 4 | $38B |
|
||
| Insurance | 3 | $71B |
|
||
| Financial Services | 2 | $25B |
|
||
| Transportation / Logistics | 2 | $18B |
|
||
| Healthcare | 1 | $247B |
|
||
| Telecommunications | 1 | $55B |
|
||
Price history
+148.1% since first listed8 events — show timeline
- 2026-05-28 Pending — Smart MLS
- 2026-05-23 Listed $325,000 Smart MLS
- 2026-05-19 Coming Soon $325,000 Smart MLS
- 2016-02-26 Sold (Public Records) $200,000 Public Records
- 2016-02-25 Sold (MLS) $199,900 Smart MLS
- 2015-09-10 Listed $200,000 Smart MLS
- 1998-01-26 Sold (Public Records) $108,000 Public Records
- 1994-05-19 Sold (Public Records) $131,000 Public Records
Property tax history
+4.5%/yrLatest (2025): $8,634 · +52.4% YoY. Source: county tax records.
Cash-flow waterfall
monthlySold comps — $/sqft
last 12 mo · ≤1 miLoading sold comps…