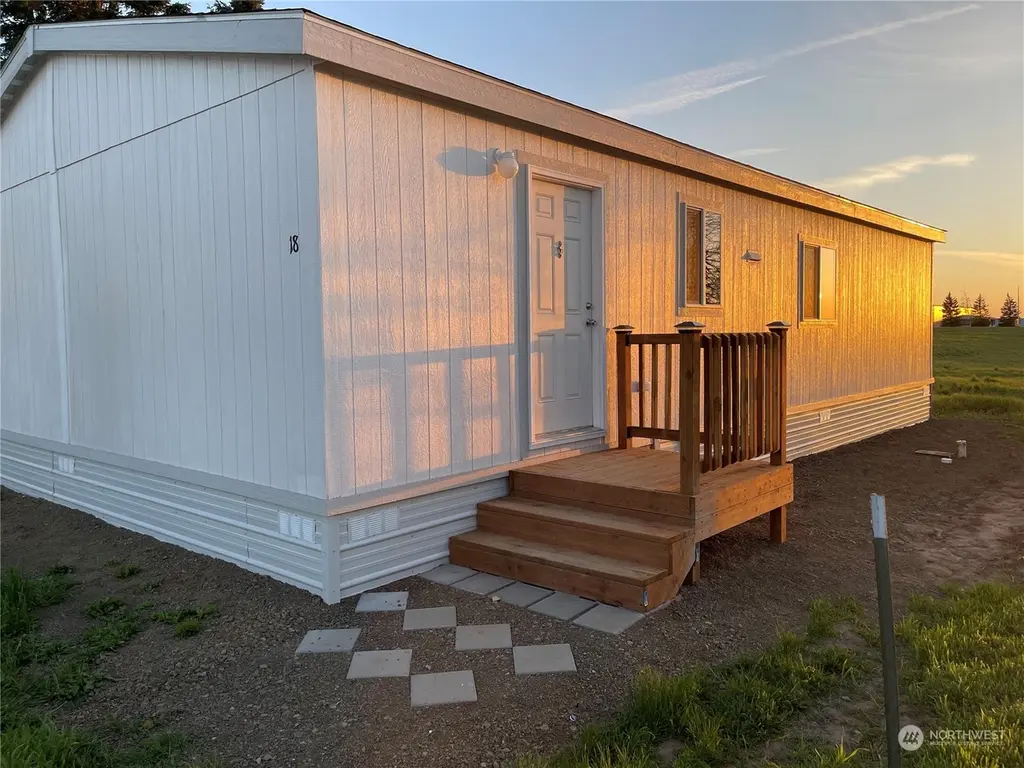
1500 S Columbus Ave #18 · Goldendale, WA
Flood risk 1/10 · Minimal
- FEMA flood zone
- X
- Chance of flooding over 30 yrs
- 0.0%
- Est. flood insurance / yr
- $507 – $1,088
Fire risk 8/10 · Major
- Est. fire insurance / yr
- $604 – $1,122
Heat risk 3/10 · Minor
- Hot days now (above 93°F)
- 7 days/yr
- Hot days in 30 yrs
- 14 days/yr
Wind risk 1/10 · Minimal
- Chance of severe wind over 30 yrs
- —
Air-quality risk 8/10 · Major
- Unhealthy air days now
- 10 days/yr
- Unhealthy air days in 30 yrs
- 10 days/yr
Risk factors via First Street. Map © Google.
Why this score? — see what drove the B- grade
The composite is a weighted blend of 9 inputs, each scored 0–100. Each bar is that input's sub-score; the figure is the points it added to the 100-point composite (weight × sub-score).
- Cash flow +28.4/30.0
- DSCR +10.0/10.0
- 1% rule +7.8/10.0
- ARV discount +7.5/15.0
- Condition / age +4.0/5.0
- Schools +3.7/10.0
- Livability +3.4/5.0
- Rent growth +2.5/5.0
- Appreciation +0.0/10.0
$89,999
🖨 Deal sheet 📄 Offer letter ✓ Due diligence
Listing remarks
Take advantage of 2 months free lot rent with purchase!! This BRAND NEW home is located in an all-ages park and welcomes you and up to 2 pets under 40 lbs. Featuring 3 bedrooms, 2 bathrooms and all new appliances and carpet, this home offers a convenient location with all the comforts of home. Outside, enjoy the stunning views of the surrounding landscape, with opportunities for outdoor recreation at your doorstep. Whether you are hiking through the nearby Columbia River Gorge, exploring local wineries, or simply enjoying a picnic in the park, there's something for everyone to enjoy!
Key facts
- Parking
- Built 2023
- Listed 677 days
Neighborhood map
What this means for you Summary
Snapshot
- This is a 3-bed/2.0-bath manufactured listed at $90k. Condition is rated good.
Deal economics
- At list price, monthly cash flow is $291 ($3k/yr) — positive.
- The deal already cash-flows at list — no discount required.
- Meets the 1% rule at list price ($1k rent vs $90k).
- Recommended offer: $79k (12.0% below list) — sets the bar for market timing.
- Cap rate 10.2% vs local median 2.4% in Goldendale — top-decile yield for the area; either an underpriced asset or a hidden risk that comps aren't pricing in. Stress-test before assuming the spread holds.
Location & tenants
- Location reads 67/100 on livability (#295 in WA) — a middle-class / working-renter tenant base. Strengths: cost of living A+, housing A+, health & safety A+; Watch: amenities F, commute F, employment F.
- Goldendale School District (town): math 35% / reading 49% proficiency, ranked #213 of 291 in WA (top 73%) — families likely to look elsewhere, expect single-tenant / working-renter base with shorter leases.
- Market conditions: 251 active listings in the ZIP; 2 comparable units currently listed for rent nearby; 80 units permitted in Klickitat County in 2024 (0 in 5+ unit buildings).
Forward outlook
- Local home prices are declining (-3.0%/yr); year-one equity from $622 of loan paydown is wiped out by about $3k of value loss. Plan a longer hold.
- Klickitat County population projected at +6% by 2050 — modest demand growth; plan on rents tracking national, not racing it.
- At projected returns (-3.0% appreciation + 3.0% rent growth), your $25k cash investment doubles in ~9 years — after that, you're playing with house money.
Negotiation context
- It's been on market 677 days — a 12% lower offer ($79k) is reasonable based on typical stale-listing flexibility.
- 7 sale attempts since 2y ago; this cycle's ask is 5525% above the opening price — seller raised mid-cycle; expect resistance to lowballs.
Risks & watch-outs
- Climate carrying-cost: severe wildfire risk — expect insurance premiums to compound above CPI over the hold.
Questions for the listing agent
- It's been on market 677 days. Have you received any prior offers? Is the seller open to a 12% concession, seller financing, or rate buy-down credit?
- Why hasn't it sold? Are there any deal-killer items the seller is aware of (foundation, flood, title, zoning, code violations)?
- Is there a deadline driving the sale (1031 exchange, divorce, estate, relocation)? That informs how much negotiation room exists.
- What's the average days-on-market for RENTAL listings here right now (not sales)? A rising rental-DOM trend means longer vacancies and softer asking-rent achievability than the comps imply.
- What's the recent tenant-quality profile in this submarket — average credit score on applications, eviction rate, late-payment / NSF rate, and stable-employment percentage? A property-management company in the area should have these aggregated.
- How much new for-sale + rental construction is in the pipeline within 1–3 miles? Heavy new supply typically softens prices + rents 12–24 months out; constrained supply supports both.
Investment metrics
- 1% rule
- 1.28% ✓
- Cap rate
- 10.18%
- Cash-on-cash
- 13.88%
- DSCR
- 1.62
- GRM
- 6.5
CMA / ARV
- ARV (median comp)
- $297,969
- List price
- $89,999
- Delta
- -69.80%
- Verdict
- UNDERPRICED
- Comps
- 2 within 1.0 mi
Show comp detail 3 sales within ~0.75 mi
| Address | Dist | Beds/Ba | Sqft | Sold | Price | $/sf | Match |
|---|---|---|---|---|---|---|---|
| 1500 S Columbus Ave #21 | 0.00mi | 3/2.0 | 1,173 (0%) | 23mo | $105,000 | $90 | 81 |
| 1924 Jaxon St | 0.33mi | 3/2.0 | 1,188 (+1%) | 6mo | $254,999 | $215 | 78 |
| 512 W Railroad Ave | 0.71mi | 3/2.0 | 1,290 (+10%) | 21mo | $257,000 | $199 | 33 |
Match score weights: distance 35% · size 25% · config 20% · recency 20%. Top-matched comps best support the ARV.
Projected returns pro-forma
-3.0% appreciation · 3.0% rent growth · sell at horizon
- IRR
- 4.1%
- Equity multiple
- 1.16×
- Total profit
- $3,998
- Equity at exit
- $13,419
- IRR
- 13.6%
- Equity multiple
- 2.09×
- Total profit
- $27,458
- Equity at exit
- $7,781
Cash invested: $25,200 (down + closing). Projections, not guarantees.
Landlord ↔ Tenant lean methodology
- Overall (STATE)
- 28 Tenant-Leaning
- State Washington
- 28 Tenant-Leaning · D+8
- County
- — inherits STATE
- City
- — inherits STATE
ZIP-level market 98620
- Active inventory
- 251
- Price-to-rent
- 6.5×
Monthly cashflow live
- Estimated rent
- $1,156 medium interval (Pro) →
- Mortgage (P&I)
- −$472
- Tax est. 1.5%
- −$112 /mo · $1,350/yr
- Insurance
- −$37
- HOA
- −$0
- Vacancy / Maint / Mgmt
- −$243
- Net cashflow
- $291
Break-even live
UW: 25.0% down · 7.5% · 30yr · 1.5% tax · 5.0% vac · 8.0% maint · 8.0% mgmt
Financing live
Cash to close
- Down payment
- $22,500
- Closing costs
- $2,700
- Reserves months
- —
- Total cash needed
- —
Loan-product check · same deal, 3 products live
Conventional
25% down · 7.5% · 30yr
- Down + closing
- —
- Monthly P&I
- —
- Monthly cashflow
- —
- DSCR
- —
- Eligible?
- —
Personal DTI + credit; lowest rate.
DSCR
20% down · 8.5% · 30yr
- Down + closing
- —
- Monthly P&I
- —
- Monthly cashflow
- —
- DSCR
- —
- Eligible?
- —
No personal income docs; deal must DSCR.
Hard money
10% down · 12.0% · 12mo
- Down + closing
- —
- Monthly P&I
- —
- Monthly cashflow
- —
- DSCR
- —
- Eligible?
- —
Short-term bridge; refi at stabilization.
Rent comps 2 comps
| Address | Beds | Baths | Sqft | Rent | $/sqft | DOM | Units | Dist |
|---|---|---|---|---|---|---|---|---|
| 230 W Broadway St Apt 3 Goldendale, WA | 2.0 | 1.0 | 720 | $1,200 | $1.67 | 43d | 1 | 0.88mi |
| 123 NW High St Unit C-3 Goldendale, WA | 2.0 | 1.0 | 775 | $1,100 | $1.42 | 43d | 1 | 1.22mi |
Listing history 28 events
-
2026-06-18days on market $89,999 Active 677 DOM
-
2026-06-17days on market $89,999 Active 676 DOM
-
2026-06-16days on market $89,999 Active 675 DOM
-
2026-06-15days on market $89,999 Active 674 DOM
-
2026-06-15days on market $89,999 Active 673 DOM
-
2026-06-13days on market $89,999 Active 672 DOM
-
2026-06-12days on market $89,999 Active 671 DOM
-
2026-06-09days on market $89,999 Active 668 DOM
-
2026-06-08days on market $89,999 Active 667 DOM
-
2026-06-08days on market $89,999 Active 666 DOM
-
2026-06-07days on market $89,999 Active 665 DOM
-
2026-06-03days on market $89,999 Active 662 DOM
-
2026-06-02days on market $89,999 Active 661 DOM
-
2026-06-01days on market $89,999 Active 660 DOM
-
2026-05-31days on market $89,999 Active 659 DOM
-
2026-01-20status Active
-
2025-12-12historical $1,600
-
2025-07-31$1,600
-
2025-06-26historical $1,600
-
2025-02-05status Active
-
2025-02-01historical
-
2024-11-09status Active
-
2024-11-03$1,600
-
2024-11-03historical $1,600
-
2024-10-03price $97,999
-
2024-08-31price $102,999
-
2024-08-28$1,600
-
2024-07-10$104,999 Active
ⓘ Source: listings_history table (triggers on properties + properties_extension) + one-shot
backfill from property_details.listing_events for pre-trigger history.
Climate risk First Street
- Flood 1/10 Low FEMA zone X · 0% chance over 30 yrs
- Wildfire 8/10 Severe
- Heat 3/10 Moderate 7 d/yr ≥93°F today · 14 d/yr by 30 yrs out
- Wind 1/10 Low
- Air quality 8/10 Severe 10 unhealthy d/yr today · 10 by 30 yrs out
Nearby sold comps map
Loading sold comps map…
Walkable amenities ~0.75 mi
Loading nearby amenities…
Taxation est. · year 1
- Rental income
- $13,875
- − Mortgage interest
- −$5,041
- − Property taxes
- −$1,350
- − Insurance
- −$450
- − Repairs & maintenance
- −$1,110
- − Management
- −$1,110
- − Depreciation
- −$2,618
- Taxable income
- $2,196
- Est. tax owed @ 24.0%
- −$527
- After-tax cash flow
- $2,971/yr
For passive investors: Depreciation is non-cash, so a rental often shows a tax loss while cash-flowing — sheltering income. Rental losses are passive: they offset passive income freely, and up to $25,000/yr can offset ordinary (W-2) income if you actively participate and your MAGI is under $100k (phasing out to $0 by $150k); unused losses carry forward. On sale, claimed depreciation is recaptured at up to 25%, and gains may owe capital-gains tax (a 1031 exchange can defer both). Figures are a year-1 estimate at your 24.0% rate — not tax advice; consult a CPA.
Condition & rehab AI · 8 photos
This move-in-ready manufactured home offers a good condition with modern finishes and a clean exterior. Minor updates to the exterior and interior can significantly enhance its value and appeal.
Value-add opportunities
- Both Paint exterior siding — Enhances curb appeal and value
- Both Replace carpet in bedrooms — Improves comfort and appearance
- Both Install new flooring in bathrooms — Modernizes and increases value
- Both Install new kitchen appliances — Enhances functionality and appeal
Renovation cost estimate screening
Value-add ROI direction
- Both Paint exterior siding — Enhances curb appeal and value ↑
- Both Replace carpet in bedrooms — Improves comfort and appearance ↑
- Both Install new flooring in bathrooms — Modernizes and increases value ↑
- Both Install new kitchen appliances — Enhances functionality and appeal ↑
ⓘ Cost ranges are severity-bucket heuristics (US national rule-of-thumb). Get contractor quotes + a written scope before underwriting a rehab budget.
Schools (NCES district)
- District
- Goldendale School District
- NCES district ID
- 5303090
- Math proficiency
- 35% ▼ -1.00%
- Reading proficiency
- 49% ▼ -1.00%
- Median HH income
- $37,859
- Composite
- 37.31/100
- National rank
- #8952
- State rank
- #213 of 291 in WA
Livability — Goldendale
- Score
- 67/100
- State rank
- #295
- US rank
- #10293
Category grades
Schools grade is shown separately in the Schools card above.
Census & demographics
- Census place
- Goldendale, WA
- Population (ZIP)
- 7,617
Population outlook (Klickitat County) Hauer SSP2
- Today (2025)
- 22,337 people
- By 2030
- 22,829 · +2.2%
- By 2040
- 23,382 · +4.7%
- By 2050
- 23,654 · +5.9%
- By 2075
- 24,266 · +8.6%
- By 2100
- 23,782 · +6.5%
Race, ethnicity, and origin ACS 2023
- Neighborhood character
- Predominantly White (86%)
- Race & ethnicity
- White 86% Hispanic / Latino 6% Two or more races 4% Native American 3%
- Hispanic origin (detail)
- Mexican 2%
- Common ancestry
- Portuguese 4% Italian 4% Lithuanian 4%
- Foreign-born
- 4% · Canada
- Languages at home
- 97% English-only · Spanish 2%
Political lean MEDSL · Klickitat
- 2024 margin
- Lean R (+9.3) · D 43.7% · R 53.1% · Other 3.2%
- 2008→2024 swing
- -9.5pp toward R · 2008: 0.2pp · 2024: -9.3pp
- All cycles
- 2024: R+9.3 2020: R+9.4 2016: R+16.3 2012: R+7.8 2008: D+0.2
Not yet ingested
- Civics
- —
Market trends
- HPI YoY
- ▼ -164.36%
- Current HPI
- 210.0159
- Rent YoY
- —
- Metro
- —
- State GDP YoY
- ▲ 4.65%
- F500 in state
- 22
Industry mix (Fortune 500 HQ in WA)
| Industry | F500 HQs | Revenue |
|---|---|---|
| Retail | 2 | $269B |
|
||
| Technology / Retail | 1 | $638B |
|
||
| Technology | 1 | $245B |
|
||
| Telecommunications | 1 | $38B |
|
||
| Food / Beverage | 1 | $36B |
|
||
| Automotive / Trucks | 1 | $34B |
|
||
Price history
-98.5% since first listed13 events — show timeline
- 2026-01-20 Relisted — NWMLS as Distributed by MLS Grid
- 2025-12-12 Rental Removed $1,600 NWMLS
- 2025-07-31 Listed for Rent $1,600 NWMLS
- 2025-06-26 Rental Removed $1,600 NWMLS
- 2025-02-05 Relisted — NWMLS as Distributed by MLS Grid
- 2025-02-01 Delisted — NWMLS as Distributed by MLS Grid
- 2024-11-09 Relisted — NWMLS as Distributed by MLS Grid
- 2024-11-03 Listed for Rent $1,600 NWMLS
- 2024-11-03 Rental Removed $1,600 NWMLS
- 2024-10-03 Price Changed $97,999 NWMLS as Distributed by MLS Grid
- 2024-08-31 Price Changed $102,999 NWMLS as Distributed by MLS Grid
- 2024-08-28 Listed for Rent $1,600 NWMLS
- 2024-07-10 Listed $104,999 NWMLS as Distributed by MLS Grid
Cash-flow waterfall
monthlySold comps — $/sqft
last 12 mo · ≤1 miLoading sold comps…