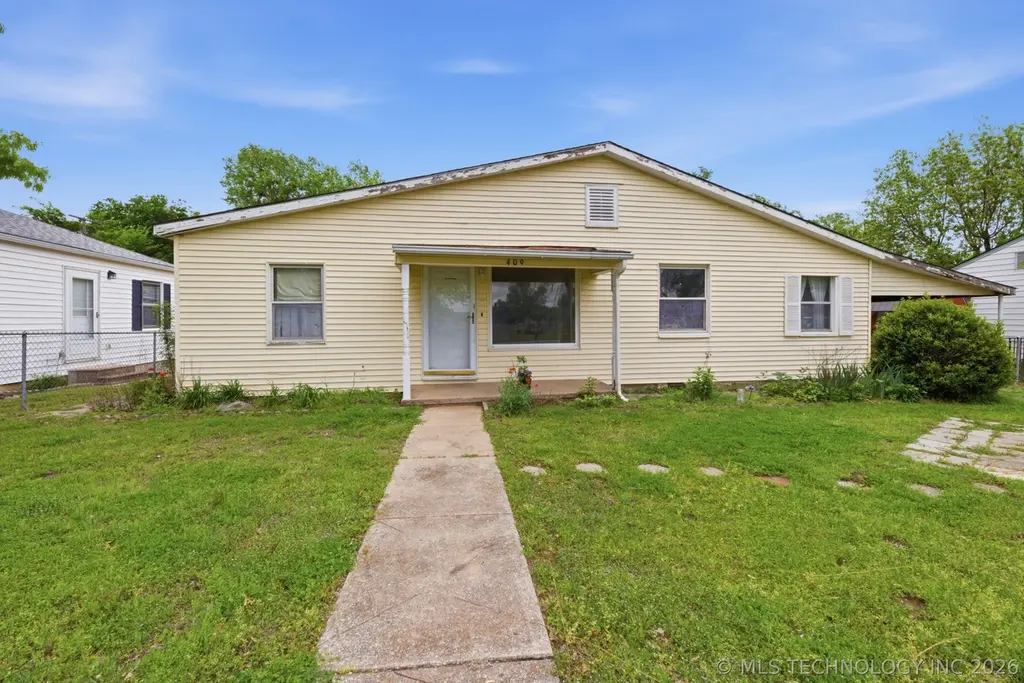
409 N Ridgeway St · Sapulpa, OK
Flood risk 1/10 · Minimal
- FEMA flood zone
- X (unshaded)
- Chance of flooding over 30 yrs
- 0.0%
- Est. flood insurance / yr
- $507 – $1,088
Fire risk 5/10 · Moderate
- Est. fire insurance / yr
- $2,463 – $4,575
Heat risk 6/10 · Moderate
- Hot days now (above 110°F)
- 7 days/yr
- Hot days in 30 yrs
- 18 days/yr
Wind risk 3/10 · Minor
- Chance of severe wind over 30 yrs
- 4.0%
Air-quality risk 2/10 · Minimal
- Unhealthy air days now
- 0 days/yr
- Unhealthy air days in 30 yrs
- 1 days/yr
Risk factors via First Street. Map © Google.
Why this score? — see what drove the C+ grade
The composite is a weighted blend of 9 inputs, each scored 0–100. Each bar is that input's sub-score; the figure is the points it added to the 100-point composite (weight × sub-score).
- Cash flow +25.2/30.0
- ARV discount +15.0/15.0
- DSCR +8.3/10.0
- 1% rule +6.0/10.0
- Livability +3.4/5.0
- Rent growth +2.5/5.0
- Condition / age +2.5/5.0
- Schools +2.0/10.0
- Appreciation +0.0/10.0
$110,000
🖨 Deal sheet 📄 Offer letter ✓ Due diligence
Listing remarks MLS
Must See! At this price won't last long, has a deck out the back door, a workshop, and a small storage building in back, attached carport with entry to home, and a large yard.
Key facts
- Close to schools
- Dining area
- Close to highway
Tags
Property features AI
Finance
- Financial info: Pets allowed
- HOA & community: Sidewalks in the community; Senior community
Exterior
- Parking: One-car garage; Carport
- Security: No safety shelter
- Utilities: Cable available; Electricity available; Fiber optic available; Natural gas available; High-speed internet available; Public water; Public sewer
- Home design: Single-story property; Faces west; Crawlspace foundation
- Construction: Vinyl siding with wood frame construction; Asphalt/fiberglass roof
- Exterior features: Gravel driveway; Deck; Shed(s); Chain link fencing; No safety shelter
Interior
- Kitchen: Convection oven; Cooktop; Oven; Range; Refrigerator; Pantry
- Bedrooms: Master bedroom on first floor with separate closets; Bedroom on first floor with walk-in closet
- Flooring: Wood floors
- Bathrooms: One full bathroom (first floor) with shower and ventilation; Master bath described with heater and shower
- Heating & cooling: Central heating (electric); Central air conditioning
- Interior features: Vinyl, insulated, storm windows; Storm doors; Accessible full bathroom; High-speed internet; Laminate countertops; Wired for data; Gas range and gas oven connections
- Laundry & utility: Washer hookup; Electric dryer hookup; Gas dryer hookup; Dryer; Washer; Gas water heater; Inside utility room
Neighborhood map
What this means for you Summary
Snapshot
- This is a 2-bed/1.0-bath single-family listed at $110k.
Deal economics
- At list price, monthly cash flow is $246 ($3k/yr) — positive.
- The deal already cash-flows at list — no discount required.
- Meets the 1% rule at list price ($1k rent vs $110k).
- Recommended offer: $108k (1.5% below list) — sets the bar for market timing.
- Cap rate 9.0% vs local median 2.8% in Sapulpa — top-decile yield for the area; either an underpriced asset or a hidden risk that comps aren't pricing in. Stress-test before assuming the spread holds.
Location & tenants
- Location reads 67/100 on livability (#88 in OK) — a middle-class / working-renter tenant base. Strengths: cost of living A+, housing A+, crime B+; Watch: schools F, amenities F, commute F.
- Sapulpa (suburban): math 23% / reading 24% proficiency, ranked #129 of 270 in OK (top 48%) — low school quality limits family demand, transient renter base, plan for 1-2y turnover.
- Market conditions: 196 active listings in the ZIP; 9 comparable units currently listed for rent nearby; rentals leasing fast (median 2d on market — plan ~1-2 weeks tenant-placement turnaround); 193 units permitted in Creek County in 2024 (76 in 5+ unit buildings).
Forward outlook
- Local home prices are declining (-3.0%/yr); year-one equity from $761 of loan paydown is wiped out by about $3k of value loss. Plan a longer hold.
Negotiation context
- It's been on market 28 days — a 2% lower offer ($108k) is reasonable based on typical stale-listing flexibility.
- 2 sale attempts since 12y ago; this cycle's ask has dropped $20k (15%) from the opening price — seller is motivated, your offer sets the floor, not the list.
- Current owner paid $68k; list at $110k implies a 62% gain — meaningful room to come down on a strong offer.
Risks & watch-outs
- Watch-outs: built in 1939 — expect roof / HVAC / electrical / plumbing capex.
- Climate carrying-cost: moderate wildfire risk; extreme-heat days projected 7→18/yr by 2055 (HVAC capex compounding) — expect insurance premiums to compound above CPI over the hold.
Questions for the listing agent
- Built in 1939 — when were the roof, HVAC, electrical panel, plumbing, and water heater last replaced?
- Is there a deadline driving the sale (1031 exchange, divorce, estate, relocation)? That informs how much negotiation room exists.
- Schools are F-rated, which usually means shorter tenancies and higher turnover. Who's the typical renter profile here, and what's been the actual vacancy rate?
- What's the average days-on-market for RENTAL listings here right now (not sales)? A rising rental-DOM trend means longer vacancies and softer asking-rent achievability than the comps imply.
- What's the recent tenant-quality profile in this submarket — average credit score on applications, eviction rate, late-payment / NSF rate, and stable-employment percentage? A property-management company in the area should have these aggregated.
- How much new for-sale + rental construction is in the pipeline within 1–3 miles? Heavy new supply typically softens prices + rents 12–24 months out; constrained supply supports both.
Investment metrics
- 1% rule
- 1.10% ✓
- Cap rate
- 8.98%
- Cash-on-cash
- 9.58%
- DSCR
- 1.43
- GRM
- 7.6
CMA / ARV
- ARV (on-the-fly)
- $173,460
- Comps found
- 12
Show comp detail 12 sales within ~0.75 mi
| Address | Dist | Beds/Ba | Sqft | Sold | Price | $/sf | Match |
|---|---|---|---|---|---|---|---|
| 409 N Ridgeway St | 0.00mi | 2/1.0 | 1,239 (0%) | 0mo | $110,000 | $89 | 100 |
| 505 N Ross St | 0.16mi | 3/1.0 (+1) | 1,120 (-10%) | 4mo | $90,000 | $80 | 68 |
| 1344 E Lincoln Ave | 0.61mi | 2/1.0 | 1,260 (+2%) | 3mo | $106,500 | $85 | 66 |
| 112 N Linden St | 0.41mi | 2/1.0 | 1,333 (+8%) | 4mo | $168,500 | $126 | 65 |
| 1136 E Watchorn Ave | 0.25mi | 3/2.0 (+1) | 1,316 (+6%) | 6mo | $188,000 | $143 | 64 |
| 1002 E Line Ave | 0.27mi | 2/1.0 | 1,420 (+15%) | 1mo | $85,000 | $60 | 62 |
| 1618 E Denton Ave | 0.54mi | 3/2.0 (+1) | 1,271 (+3%) | 1mo | $205,000 | $161 | 61 |
| 1411 E Denton Ave | 0.27mi | 3/1.0 (+1) | 1,080 (-13%) | 3mo | $151,000 | $140 | 58 |
| 733 N Moccasin St | 0.50mi | 3/1.0 (+1) | 1,120 (-10%) | 1mo | $185,500 | $166 | 55 |
| 1432 E Denton Ave | 0.31mi | 3/1.0 (+1) | 1,080 (-13%) | 5mo | $175,000 | $162 | 55 |
| 209 N Leahy St | 0.54mi | 3/2.0 (+1) | 1,375 (+11%) | 3mo | $260,000 | $189 | 45 |
| 784 N Moccasin Pl | 0.60mi | 3/2.0 (+1) | 1,412 (+14%) | 3mo | $120,000 | $85 | 37 |
Match score weights: distance 35% · size 25% · config 20% · recency 20%. Top-matched comps best support the ARV.
Projected returns pro-forma
-3.0% appreciation · 3.0% rent growth · sell at horizon
- IRR
- -1.9%
- Equity multiple
- 0.93×
- Total profit
- $-2,173
- Equity at exit
- $16,401
- IRR
- 7.8%
- Equity multiple
- 1.59×
- Total profit
- $18,221
- Equity at exit
- $9,511
Cash invested: $30,800 (down + closing). Projections, not guarantees.
Landlord ↔ Tenant lean methodology
- Overall (STATE)
- 83 Strongly Landlord-Friendly
- State Oklahoma
- 83 Strongly Landlord-Friendly · R+20
- County
- — inherits STATE
- City
- — inherits STATE
ZIP-level market 74066
- Home prices YoY
- -26.3%
- Active inventory
- 196
- Price-to-rent
- 7.6×
Monthly cashflow live
- Estimated rent
- $1,206 high interval (Pro) →
- Mortgage (P&I)
- −$577
- Tax from tax record
- −$84 /mo · $1,011/yr
- Insurance
- −$46
- HOA
- −$0
- Vacancy / Maint / Mgmt
- −$253
- Net cashflow
- $246
Break-even live
UW: 25.0% down · 7.5% · 30yr · 1.5% tax · 5.0% vac · 8.0% maint · 8.0% mgmt
Financing live
Cash to close
- Down payment
- $27,500
- Closing costs
- $3,300
- Reserves months
- —
- Total cash needed
- —
Loan-product check · same deal, 3 products live
Conventional
25% down · 7.5% · 30yr
- Down + closing
- —
- Monthly P&I
- —
- Monthly cashflow
- —
- DSCR
- —
- Eligible?
- —
Personal DTI + credit; lowest rate.
DSCR
20% down · 8.5% · 30yr
- Down + closing
- —
- Monthly P&I
- —
- Monthly cashflow
- —
- DSCR
- —
- Eligible?
- —
No personal income docs; deal must DSCR.
Hard money
10% down · 12.0% · 12mo
- Down + closing
- —
- Monthly P&I
- —
- Monthly cashflow
- —
- DSCR
- —
- Eligible?
- —
Short-term bridge; refi at stabilization.
Rent comps 9 comps
| Address | Beds | Baths | Sqft | Rent | $/sqft | DOM | Units | Dist |
|---|---|---|---|---|---|---|---|---|
| 310 N Division St Sapulpa, OK | 3.0 | 2.0 | 1237 | $1,300 | $1.05 | 16d | 1 | 0.30mi |
| 925 E Thompson Ave Sapulpa, OK | 3.0 | 1.0 | 1416 | $1,450 | $1.02 | 1d | 1 | 0.57mi |
| 925 E Thompson Ave Sapulpa, OK | 3.0 | 1.0 | 1416 | $1,450 | $1.02 | 10d | 1 | 0.57mi |
| 405 S Maple St Unit F Sapulpa, OK | 2.0 | 1.0 | 1280 | $955 | $0.75 | 1d | 1 | 0.86mi |
| 405 S Maple St Unit F Sapulpa, OK | 2.0 | 1.0 | 1280 | $955 | $0.75 | 16d | 1 | 0.86mi |
| 322 S Park St Unit 07 Sapulpa, OK | 1.0 | 1.0 | 750 | $975 | $1.30 | 1d | 1 | 1.09mi |
| 322 S Park St Unit 6 Sapulpa, OK | 1.0 | 1.0 | 750 | $925 | $1.23 | 1d | 1 | 1.09mi |
| 919 S Mission St Sapulpa, OK | 2.0–3.0 | 1.0–2.0 | 950 | $995 | $1.05 | 1d | 2 | 1.15mi |
| 418 S Water St Sapulpa, OK | 3.0 | 1.0 | 1166 | $1,300 | $1.11 | 10d | 1 | 1.19mi |
Listing history 7 events
-
2026-05-18status Pending
-
2026-05-15price $110,000
-
2026-04-20$130,000 Active
-
2014-08-13soldstatus $68,000
-
2014-08-08soldstatus $68,000 175-char remark
Show marketing remark (175 chars)
Must See! At this price won't last long, has a deck out the back door, a workshop, and a small storage building in back, attached carport with entry to home, and a large yard.
-
2014-07-21historical 175-char remark
Show marketing remark (175 chars)
Must See! At this price won't last long, has a deck out the back door, a workshop, and a small storage building in back, attached carport with entry to home, and a large yard.
-
2014-06-26$72,500 175-char remark
Show marketing remark (175 chars)
Must See! At this price won't last long, has a deck out the back door, a workshop, and a small storage building in back, attached carport with entry to home, and a large yard.
ⓘ Source: listings_history table (triggers on properties + properties_extension) + one-shot
backfill from property_details.listing_events for pre-trigger history.
Tax reassessment forecast OK · Resets to sale price
- Current annual tax
- $1,011 · $84/mo
- Projected year-2 tax
- $1,011 · $84/mo
- Expected delta
- $0/yr ($0/mo · 0.0%)
ⓘ Screening estimate from a state-policy table — verify with the county assessor before closing.
Climate risk First Street
- Flood 1/10 Low FEMA zone X (unshaded) · 0% chance over 30 yrs
- Wildfire 5/10 Major
- Heat 6/10 Major 7 d/yr ≥110°F today · 18 d/yr by 30 yrs out
- Wind 3/10 Moderate 4% chance of damaging wind over 30 yrs
- Air quality 2/10 Low 0 unhealthy d/yr today · 1 by 30 yrs out
Nearby sold comps map
Loading sold comps map…
Walkable amenities ~0.75 mi
Loading nearby amenities…
Taxation est. · year 1
- Rental income
- $14,475
- − Mortgage interest
- −$6,162
- − Property taxes
- −$1,011
- − Insurance
- −$550
- − Repairs & maintenance
- −$1,158
- − Management
- −$1,158
- − Depreciation
- −$3,200
- Taxable income
- $1,236
- Est. tax owed @ 24.0%
- −$297
- After-tax cash flow
- $2,655/yr
For passive investors: Depreciation is non-cash, so a rental often shows a tax loss while cash-flowing — sheltering income. Rental losses are passive: they offset passive income freely, and up to $25,000/yr can offset ordinary (W-2) income if you actively participate and your MAGI is under $100k (phasing out to $0 by $150k); unused losses carry forward. On sale, claimed depreciation is recaptured at up to 25%, and gains may owe capital-gains tax (a 1031 exchange can defer both). Figures are a year-1 estimate at your 24.0% rate — not tax advice; consult a CPA.
Schools (NCES district)
- District
- Sapulpa
- NCES district ID
- 4026910
- Math proficiency
- 23% ▼ -12.00%
- Reading proficiency
- 24% ▼ -12.00%
- Median HH income
- $44,536
- Composite
- 20.29/100
- National rank
- #8616
- State rank
- #129 of 270 in OK
Livability — Sapulpa
- Score
- 67/100
- State rank
- #88
- US rank
- #10676
Category grades
Schools grade is shown separately in the Schools card above.
Census & demographics
- Census place
- Sapulpa, OK
- County
- Creek County · 32,292 people
- City population
- 32,292
- Metro
- Tulsa, OK
- Population (ZIP)
- 32,292
- Household income
- $64,698
- Rent vs Own
- Severe rent burden
- 716.0
Population outlook (Creek County) Hauer SSP2
- Today (2025)
- 72,706 people
- By 2030
- 73,032 · +0.4%
- By 2040
- 72,788 · +0.1%
- By 2050
- 71,558 · -1.6%
- By 2075
- 69,248 · -4.8%
- By 2100
- 62,722 · -13.7%
Race, ethnicity, and origin ACS 2023
- Neighborhood character
- Predominantly White (71%)
- Race & ethnicity
- White 71% Native American 12% Two or more races 9% Hispanic / Latino 6% Black 3%
- Hispanic origin (detail)
- Mexican 4%
- Common ancestry
- Slovak 2% Lithuanian 2% Italian 2%
- Foreign-born
- 2% · Canada
- Languages at home
- 96% English-only · Spanish 3%
Political lean MEDSL · Creek
- 2024 margin
- Solid R (+55.7) · D 21.2% · R 77.0% · Other 1.8%
- 2008→2024 swing
- -14.1pp toward R · 2008: -41.6pp · 2024: -55.7pp
- All cycles
- 2024: R+55.7 2020: R+54.8 2016: R+54.5 2012: R+45.4 2008: R+41.6
Not yet ingested
- Civics
- —
Market trends
- HPI YoY
- ▼ -89.18%
- Current HPI
- 250.2859
- Rent YoY
- —
- Metro
- Tulsa, OK
- State GDP YoY
- ▲ 1.55%
- F500 in state
- 6
Industry mix (Fortune 500 HQ in OK)
| Industry | F500 HQs | Revenue |
|---|---|---|
| Energy | 3 | $48B |
|
||
Price history
+51.7% since first listed7 events — show timeline
- 2026-05-18 Pending — MLS Technology, Inc.
- 2026-05-15 Price Changed $110,000 MLS Technology, Inc.
- 2026-04-20 Listed $130,000 MLS Technology, Inc.
- 2014-08-13 Sold (Public Records) $68,000 Public Records
- 2014-08-08 Sold (MLS) $68,000 MLS Technology, Inc.
- 2014-07-21 Listing Removed — MLS Technology, Inc.
- 2014-06-26 Listed $72,500 MLS Technology, Inc.
Property tax history
+8.2%/yrLatest (2025): $1,011 · +17.3% YoY. Source: county tax records.
Cash-flow waterfall
monthlySold comps — $/sqft
last 12 mo · ≤1 miLoading sold comps…