12333 Reid St · Spillertown, IL
Flood risk 1/10 · Minimal
- FEMA flood zone
- X (unshaded)
- Chance of flooding over 30 yrs
- 0.0%
- Est. flood insurance / yr
- $507 – $1,088
Fire risk 2/10 · Minimal
- Est. fire insurance / yr
- $804 – $1,492
Heat risk 5/10 · Moderate
- Hot days now (above 107°F)
- 7 days/yr
- Hot days in 30 yrs
- 20 days/yr
Wind risk 2/10 · Minimal
- Chance of severe wind over 30 yrs
- 3.0%
Air-quality risk 2/10 · Minimal
- Unhealthy air days now
- 0 days/yr
- Unhealthy air days in 30 yrs
- 2 days/yr
Risk factors via First Street. Map © Google.
Why this score? — see what drove the B- grade
The composite is a weighted blend of 9 inputs, each scored 0–100. Each bar is that input's sub-score; the figure is the points it added to the 100-point composite (weight × sub-score).
- Cash flow +28.0/30.0
- DSCR +10.0/10.0
- 1% rule +8.4/10.0
- ARV discount +7.5/15.0
- Rent growth +4.6/5.0
- Livability +3.2/5.0
- Condition / age +2.5/5.0
- Schools +2.2/10.0
- Appreciation +0.0/10.0
$75,000
🖨 Deal sheet 📄 Offer letter ✓ Due diligence
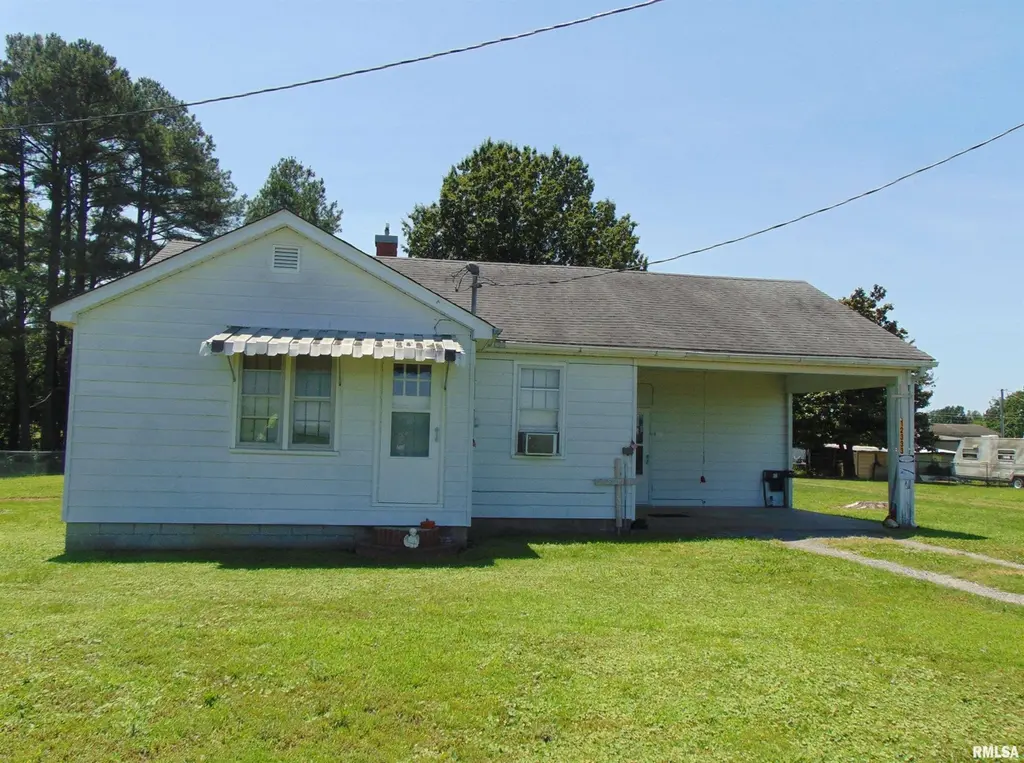
Listing remarks
2-bedroom, 1-bath home set on a 0.6-acre lot just outside in between Marion and Johnston City—close to town, yet with the breathing room you’ve been looking for. The layout is simple, practical, and easy to maintain. Out back, the property has a pole barn that offers excellent storage for vehicles, tools, or hobbies, and a separate shed provides extra space for yard gear or a small workshop. The deep yard offers space for a garden, play area, or future projects, with mature trees providing shade and privacy.
Key facts
- Separate shed
- Pole barn
- 0.6-acre lot
Tags
Property features AI
Exterior
- Parking: Carport
- Utilities: Public water; Septic system
- Home design: Single family residence; Single-story main living with upper/lower/additional levels and finished basement (rooms on multiple levels)
- Construction: Shingle roof; Built in 1950
- Exterior features: Level lot; Shed(s); Pole barn; Paved road access
Interior
- Kitchen: Kitchen included (appliances: refrigerator)
- Bedrooms: 2 bedrooms (sizes noted in room details)
- Flooring: Hardwood in bedrooms; Carpet in living room; Vinyl in kitchen
- Bathrooms: 1 full bathroom
- Heating & cooling: Central air; Forced air heating
- Interior features: Dryer; Refrigerator; Washer
- Laundry & utility: Washer and dryer included
Neighborhood map
What this means for you Summary
Snapshot
- This is a 2-bed/1.0-bath other listed at $75k.
Deal economics
- At list price, monthly cash flow is $234 ($3k/yr) — positive.
- The deal already cash-flows at list — no discount required.
- Meets the 1% rule at list price ($1k rent vs $75k).
Location & tenants
- Location reads 64/100 on livability (#725 in IL) — a middle-class / working-renter tenant base. Strengths: cost of living A+, housing A+, crime B; Watch: amenities F, commute F, health & safety F.
- Marion CUSD 2 (urban): math 20% / reading 31% proficiency, ranked #317 of 620 in IL (top 51%) — low school quality limits family demand, transient renter base, plan for 1-2y turnover.
- Zoned schools: Marion Jr High School (math 16% / reading 31%, grade F, #371 of 665 statewide, top 56%, 726 students, 0% FRL); Marion High School (math 14% / reading 18%, grade F, #457 of 693 statewide, top 66%, 1,159 students, 0% FRL) — zoned schools average 0% FRL vs 47% district-wide (47 pts lower); this property's tenant base skews higher-income than the district average.
- Market conditions: Rents rising fast (+8.4%/yr); 226 active listings in the ZIP; 130 units permitted in Williamson County in 2024 (5 in 5+ unit buildings).
- This rent is only 17% of the median local income ($71k/yr) — well below the 30% rent-burden line; pricing power to push rent on renewal without tenant pushback.
Forward outlook
- Local home prices are declining (-3.0%/yr); year-one equity from $519 of loan paydown is wiped out by about $2k of value loss. Plan a longer hold.
- At projected returns (-3.0% appreciation + 8.0% rent growth), your $21k cash investment doubles in ~7 years — after that, you're playing with house money.
Negotiation context
- Only 11 days on market — expect competitive offers; lowballing is unlikely to land.
- 2 sale attempts since 2y ago with the ask held roughly flat each time — persistent listings suggest the price (not the market) is what's stuck; bring a comps-based counter.
Risks & watch-outs
- Watch-outs: built in 1950 — expect roof / HVAC / electrical / plumbing capex.
- Climate carrying-cost: extreme-heat days projected 7→20/yr by 2055 (HVAC capex compounding) — expect insurance premiums to compound above CPI over the hold.
Questions for the listing agent
- Built in 1950 — when were the roof, HVAC, electrical panel, plumbing, and water heater last replaced?
- Is there a deadline driving the sale (1031 exchange, divorce, estate, relocation)? That informs how much negotiation room exists.
- Schools are F-rated, which usually means shorter tenancies and higher turnover. Who's the typical renter profile here, and what's been the actual vacancy rate?
- What's the average days-on-market for RENTAL listings here right now (not sales)? A rising rental-DOM trend means longer vacancies and softer asking-rent achievability than the comps imply.
- What's the recent tenant-quality profile in this submarket — average credit score on applications, eviction rate, late-payment / NSF rate, and stable-employment percentage? A property-management company in the area should have these aggregated.
- How much new for-sale + rental construction is in the pipeline within 1–3 miles? Heavy new supply typically softens prices + rents 12–24 months out; constrained supply supports both.
Investment metrics
- 1% rule
- 1.34% ✓
- Cap rate
- 10.04%
- Cash-on-cash
- 13.39%
- DSCR
- 1.60
- GRM
- 6.2
CMA / ARV
No comps found within radius.
Projected returns pro-forma
-3.0% appreciation · 8.0% rent growth · sell at horizon
- IRR
- 9.3%
- Equity multiple
- 1.39×
- Total profit
- $8,137
- Equity at exit
- $11,183
- IRR
- 22.5%
- Equity multiple
- 3.41×
- Total profit
- $50,703
- Equity at exit
- $6,485
Cash invested: $21,000 (down + closing). Projections, not guarantees.
Landlord ↔ Tenant lean methodology
- Overall (STATE)
- 43 Moderately Tenant-Leaning
- State Illinois
- 43 Moderately Tenant-Leaning · D+7
- County
- — inherits STATE
- City
- — inherits STATE
ZIP-level market 62959
- Rents YoY
- 8.4%
- Active inventory
- 226
- Price-to-rent
- 6.2×
Monthly cashflow live
- Estimated rent
- $1,007 medium interval (Pro) →
- Mortgage (P&I)
- −$393
- Tax from tax record
- −$137 /mo · $1,643/yr
- Insurance
- −$31
- HOA
- −$0
- Vacancy / Maint / Mgmt
- −$212
- Net cashflow
- $234
Break-even live
UW: 25.0% down · 7.5% · 30yr · 1.5% tax · 5.0% vac · 8.0% maint · 8.0% mgmt
Financing live
Cash to close
- Down payment
- $18,750
- Closing costs
- $2,250
- Reserves months
- —
- Total cash needed
- —
Loan-product check · same deal, 3 products live
Conventional
25% down · 7.5% · 30yr
- Down + closing
- —
- Monthly P&I
- —
- Monthly cashflow
- —
- DSCR
- —
- Eligible?
- —
Personal DTI + credit; lowest rate.
DSCR
20% down · 8.5% · 30yr
- Down + closing
- —
- Monthly P&I
- —
- Monthly cashflow
- —
- DSCR
- —
- Eligible?
- —
No personal income docs; deal must DSCR.
Hard money
10% down · 12.0% · 12mo
- Down + closing
- —
- Monthly P&I
- —
- Monthly cashflow
- —
- DSCR
- —
- Eligible?
- —
Short-term bridge; refi at stabilization.
Listing history 10 events
-
2026-06-19days on market $75,000 Active 11 DOM
-
2026-06-18days on market $75,000 Active 10 DOM
-
2026-06-17days on market $75,000 Active 9 DOM
-
2026-06-16days on market $75,000 Active 8 DOM
-
2026-06-15days on market $75,000 Active 7 DOM
-
2026-06-14days on market $75,000 Active 5 DOM
-
2026-06-13days on market $75,000 Active 4 DOM
-
2026-06-10days on market $75,000 Active 2 DOM
-
2026-06-09remarks 513-char remark
-
2026-06-09$75,000 Active 1 DOM
ⓘ Source: listings_history table (triggers on properties + properties_extension) + one-shot
backfill from property_details.listing_events for pre-trigger history.
Tax reassessment forecast IL · Partial reset (capped growth)
- Current annual tax
- $1,643 · $137/mo
- Projected year-2 tax
- $1,673 · $139/mo
- Expected delta
- +$30/yr (+$2/mo · 1.8%)
ⓘ Screening estimate from a state-policy table — verify with the county assessor before closing.
Climate risk First Street
- Flood 1/10 Low FEMA zone X (unshaded) · 0% chance over 30 yrs
- Wildfire 2/10 Low
- Heat 5/10 Major 7 d/yr ≥107°F today · 20 d/yr by 30 yrs out
- Wind 2/10 Low 3% chance of damaging wind over 30 yrs
- Air quality 2/10 Low 0 unhealthy d/yr today · 2 by 30 yrs out
Nearby sold comps map
Loading sold comps map…
Walkable amenities ~0.75 mi
Loading nearby amenities…
Taxation est. · year 1
- Rental income
- $12,089
- − Mortgage interest
- −$4,201
- − Property taxes
- −$1,643
- − Insurance
- −$375
- − Repairs & maintenance
- −$967
- − Management
- −$967
- − Depreciation
- −$2,182
- Taxable income
- $1,753
- Est. tax owed @ 24.0%
- −$421
- After-tax cash flow
- $2,391/yr
For passive investors: Depreciation is non-cash, so a rental often shows a tax loss while cash-flowing — sheltering income. Rental losses are passive: they offset passive income freely, and up to $25,000/yr can offset ordinary (W-2) income if you actively participate and your MAGI is under $100k (phasing out to $0 by $150k); unused losses carry forward. On sale, claimed depreciation is recaptured at up to 25%, and gains may owe capital-gains tax (a 1031 exchange can defer both). Figures are a year-1 estimate at your 24.0% rate — not tax advice; consult a CPA.
Schools (NCES district)
- District
- Marion CUSD 2
- NCES district ID
- 1724600
- Math proficiency
- 20% ▼ -11.00%
- Reading proficiency
- 31% ▼ -11.00%
- Median HH income
- $46,221
- Composite
- 22.07/100
- National rank
- #8189
- State rank
- #317 of 620 in IL
Livability — Spillertown
- Score
- 64/100
- State rank
- #725
- US rank
- #14740
Category grades
Schools grade is shown separately in the Schools card above.
Census & demographics
- County
- Williamson County · 38,451 people
- Metro
- Carbondale-Marion, IL
- Population (ZIP)
- 27,793
- Household income
- $71,063
- Rent vs Own
- Severe rent burden
- 763.0
Population outlook (Williamson County) Hauer SSP2
- Today (2025)
- 69,553 people
- By 2030
- 70,090 · +0.8%
- By 2040
- 70,345 · +1.1%
- By 2050
- 69,394 · -0.2%
- By 2075
- 63,590 · -8.6%
- By 2100
- 51,154 · -26.5%
Race, ethnicity, and origin ACS 2023
- Neighborhood character
- Predominantly White (87%)
- Race & ethnicity
- White 87% Black 5% Two or more races 4% Hispanic / Latino 3% Asian 2%
- Common ancestry
- Lithuanian 2% Italian 2% Slovak 1%
- Foreign-born
- 2% · Canada
- Languages at home
- 97% English-only · Spanish 1% Other Asian/Pacific 1% Other Indo-European 1%
Political lean MEDSL · Williamson
- 2024 margin
- Solid R (+38.8) · D 30.0% · R 68.8% · Other 1.3%
- 2008→2024 swing
- -24.0pp toward R · 2008: -14.8pp · 2024: -38.8pp
- All cycles
- 2024: R+38.8 2020: R+37.3 2016: R+41.2 2012: R+25.0 2008: R+14.8
Not yet ingested
- Civics
- —
Market trends
- HPI YoY
- ▼ -76.41%
- Current HPI
- 137.5955
- Rent YoY
- ▲ 8.40%
- Metro
- Carbondale-Marion, IL
- State GDP YoY
- ▲ 1.59%
- F500 in state
- 60
Industry mix (Fortune 500 HQ in IL)
| Industry | F500 HQs | Revenue |
|---|---|---|
| Insurance | 4 | $201B |
|
||
| Consumer Goods | 4 | $87B |
|
||
| Industrial Machinery | 3 | $64B |
|
||
| Healthcare | 2 | $55B |
|
||
| Retail / Pharmacy | 1 | $148B |
|
||
| Agriculture / Food | 1 | $86B |
|
||
Price history
4 events — show timeline
- 2026-06-08 Listed $75,000 RMLSA as Distributed by MLS Grid
- 2024-08-22 Listing Removed — RMLSA as Distributed by MLS Grid
- 2024-08-22 Listing Removed — MRED as Distributed by MLS Grid
- 2024-08-16 Listed — RMLSA as Distributed by MLS Grid
Property tax history
+12.0%/yrLatest (2025): $1,643 · +13.0% YoY. Source: county tax records.
Cash-flow waterfall
monthlySold comps — $/sqft
last 12 mo · ≤1 miLoading sold comps…