 Triplex
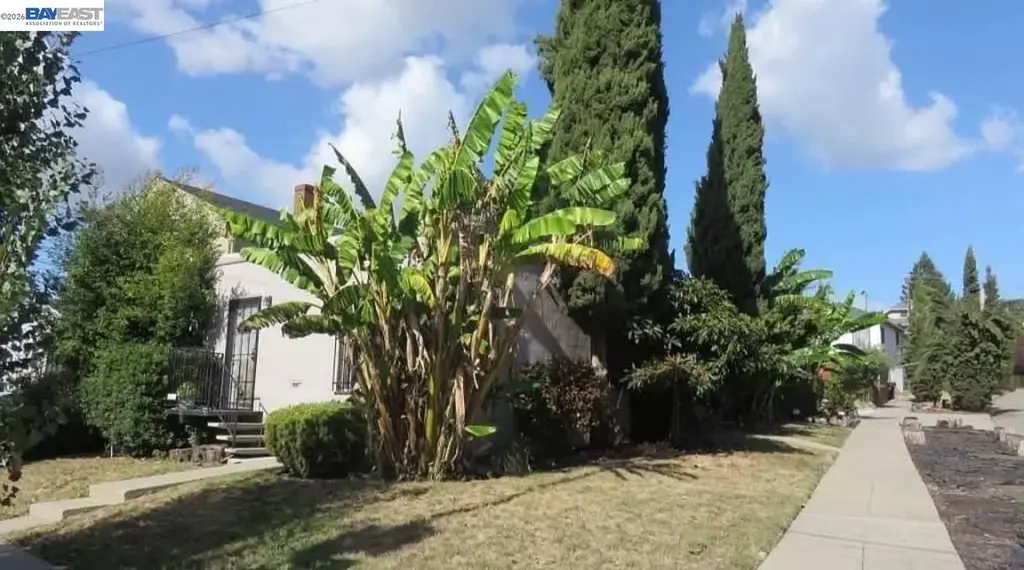
3309 64th Ave · Oakland, CA
Flood risk 1/10 · Minimal
- FEMA flood zone
- X (unshaded)
- Chance of flooding over 30 yrs
- 0.0%
- Est. flood insurance / yr
- $507 – $1,088
Fire risk 2/10 · Minimal
- Est. fire insurance / yr
- $659 – $1,223
Heat risk 3/10 · Minor
- Hot days now (above 84°F)
- 7 days/yr
- Hot days in 30 yrs
- 15 days/yr
Wind risk 1/10 · Minimal
- Chance of severe wind over 30 yrs
- —
Air-quality risk 8/10 · Major
- Unhealthy air days now
- 14 days/yr
- Unhealthy air days in 30 yrs
- 14 days/yr
Risk factors via First Street. Map © Google.
Why this score? — see what drove the B grade
The composite is a weighted blend of 9 inputs, each scored 0–100. Each bar is that input's sub-score; the figure is the points it added to the 100-point composite (weight × sub-score).
- Cash flow +29.1/30.0
- ARV discount +13.5/15.0
- DSCR +10.0/10.0
- 1% rule +8.5/10.0
- Livability +3.6/5.0
- Schools +3.0/10.0
- Rent growth +2.7/5.0
- Condition / age +2.5/5.0
- Appreciation +0.0/10.0
$599,888
🖨 Deal sheet (PDF) 📄 Offer letter ✓ Due diligence
Multi-family units
County records classify this as Multi-Family (2-4 Unit). Listing-text estimate: 3 units. confirmed
Listing remarks
Great opportunity to own a well-located triplex in the heart of East Oakland! Oakland 3309 64th Ave offers strong income potential with three separate units, making it ideal for investors or owner-occupants seeking rental income. This versatile multi-unit property features spacious living areas, functional layouts, and private entrances for each unit. Conveniently located near schools, shopping, restaurants, public transportation, and easy freeway access, providing excellent commuter convenience throughout the Bay Area. The property sits in an established neighborhood with continued growth and development opportunities nearby. Whether you are looking to expand your investment portfolio or l
Key facts
- Private entrances
- Triplex
- Three separate units
Tags
Property features AI
Finance
- Financial info: 3 total units (triplex)
Exterior
- Parking: Total of 3 parking spaces; Parking lot; Uncovered parking spaces; Street parking; No garage
- Utilities: Public water
- Home design: Residential income property (triplex); Built in 1939
- Construction: Stucco construction
- Exterior features: Front yard; Side yard; Terraced back yard; Corner lot; Rectangular lot; Street lights nearby
Interior
- Flooring: Hardwood; Laminate; Tile; Unfinished
- Bathrooms: Unit 1: 1 bathroom; Unit 2: 1 bathroom; Unit 3: 2 bathrooms
- Heating & cooling: Natural gas heating; Wall furnace; No air conditioning
- Interior features: Hardwood, laminate, tile, and unfinished flooring
Neighborhood map
What this means for you Summary
Snapshot
- This is a 3 × 4-bed/4.0-bath units multifamily listed at $600k.
Deal economics
- At list price, monthly cash flow is $2k ($25k/yr) — positive. Per door: $691/mo.
- The deal already cash-flows at list — no discount required.
- Meets the 1% rule at list price ($8k rent vs $600k).
- Recommended offer: $582k (3.0% below list) — sets the bar for market timing.
- Cap rate 10.4% vs local median 2.4% in Oakland — top-decile yield for the area; either an underpriced asset or a hidden risk that comps aren't pricing in. Stress-test before assuming the spread holds.
Location & tenants
- Location reads 71/100 on livability (#224 in CA) — a middle-class / working-renter tenant base. Strengths: amenities A+, commute A+, employment A+; Watch: schools C-, crime F, cost of living F.
- Oakland Unified (urban): math 27% / reading 33% proficiency, ranked #1,007 of 1,400 in CA (top 72%) — families likely to look elsewhere, expect single-tenant / working-renter base with shorter leases; 68% free/reduced lunch — lower-income household profile, screen leases tightly.
- Market conditions: Rents flat; 186 active listings in the ZIP; 17 comparable units currently listed for rent nearby; rentals lingering (median 45d on market — plan ~5-8 weeks vacancy on turnover, expect pricing pressure); 65% of comp listings sitting > 30 days — soft ceiling on asking rent; solid renter incomes; 1,742 units permitted in Alameda County in 2024 (856 in 5+ unit buildings).
- At $8,085/mo this rent would consume 91% of the median local household income ($106k/yr) (locally 2086% of renters already pay >50% of income on rent) — very limited rent-growth headroom before tenants either downsize or default.
Forward outlook
- Local home prices are declining (-3.0%/yr); year-one equity from $4k of loan paydown is wiped out by about $18k of value loss. Plan a longer hold.
- Alameda County population projected at +34% by 2050 — long-run rental-demand tailwind backs the buy-and-hold thesis.
Negotiation context
- It's been on market 35 days — a 3% lower offer ($582k) is reasonable based on typical stale-listing flexibility.
- 10 sale attempts since 21y ago with the ask held roughly flat each time — persistent listings suggest the price (not the market) is what's stuck; bring a comps-based counter.
- Current owner paid $520k; 15% above their basis — modest negotiation headroom, anchor on the comps not their cost.
Risks & watch-outs
- Watch-outs: built in 1939 — expect roof / HVAC / electrical / plumbing capex.
Questions for the listing agent
- It's been on market 35 days. Have you received any prior offers? Is the seller open to a 3% concession, seller financing, or rate buy-down credit?
- Can we see the unit-by-unit rent roll, current vacancy, and any below-market leases? What's the average tenancy length?
- What capital expenditures (roof, boiler, parking lot, exteriors) have been made in the last 5 years, and what's planned in the next 2?
- Built in 1939 — when were the roof, HVAC, electrical panel, plumbing, and water heater last replaced?
- Is there a deadline driving the sale (1031 exchange, divorce, estate, relocation)? That informs how much negotiation room exists.
- Crime grade is F in this area — have there been break-ins, vandalism, or insurance claims at this property in the last 3 years? What carrier currently insures it and at what premium?
- What's the average days-on-market for RENTAL listings here right now (not sales)? A rising rental-DOM trend means longer vacancies and softer asking-rent achievability than the comps imply.
- What's the recent tenant-quality profile in this submarket — average credit score on applications, eviction rate, late-payment / NSF rate, and stable-employment percentage? A property-management company in the area should have these aggregated.
- How much new apartment / multifamily construction is in the pipeline within 1–3 miles? Heavy new supply (>2% of stock underway) typically softens rents 12–24 months out; light construction supports rent growth.
Investment metrics
- 1% rule
- 1.35% ✓
- Cap rate
- 10.44%
- Cash-on-cash
- 14.82%
- DSCR
- 1.66
- GRM
- 6.2
CMA / ARV
- ARV (median comp)
- $692,788
- List price
- $599,888
- Delta
- -13.41%
- Verdict
- UNDERPRICED
- Comps
- 20 within 1.0 mi
Show comp detail 6 sales within ~0.75 mi
| Address | Dist | Beds/Ba | Sqft | Sold | Price | $/sf | Match |
|---|---|---|---|---|---|---|---|
| 6610-6612 Bancroft Ave | 0.34mi | 5/2.0 (+1) | 1,750 (+7%) | 8mo | $699,000 | $399 | 53 |
| 3137 60th Ave | 0.25mi | 4/2.0 | 1,513 (-8%) | 18mo | $550,000 | $364 | 52 |
| 2825 67th Ave | 0.31mi | 3/3.0 (-1) | 1,717 (+5%) | 23mo | $585,000 | $341 | 50 |
| 6133 Seminary Ave | 0.44mi | 4/2.0 | 1,831 (+12%) | 9mo | $660,000 | $360 | 44 |
| 5981 Majestic Ave | 0.28mi | 4/2.0 | 1,869 (+14%) | 20mo | $765,000 | $409 | 39 |
| 6932 Macarthur Blvd | 0.39mi | 3/2.0 (-1) | 1,476 (-10%) | 16mo | $650,000 | $440 | 38 |
Match score weights: distance 35% · size 25% · config 20% · recency 20%. Top-matched comps best support the ARV.
Projected returns pro-forma
-3.0% appreciation · 0.65% rent growth · sell at horizon
- IRR
- 2.6%
- Equity multiple
- 1.10×
- Total profit
- $16,430
- Equity at exit
- $89,445
- IRR
- 9.7%
- Equity multiple
- 1.67×
- Total profit
- $112,188
- Equity at exit
- $51,867
Cash invested: $167,969 (down + closing). Projections, not guarantees.
Landlord ↔ Tenant lean methodology
- Overall (CITY)
- 0 Strongly Tenant-Friendly
- State California
- 18 Strongly Tenant-Friendly · D+13
- County
- — inherits STATE
- City Oakland
- 0 Strongly Tenant-Friendly · D+62
ZIP-level market 94605
- Rents YoY
- 0.7%
- Active inventory
- 186
- Price-to-rent
- 18.5×
Monthly cashflow live
- Estimated rent
- $8,085 medium interval (Pro) →
- Mortgage (P&I)
- −$3,146
- Tax from tax record
- −$917 /mo · $11,008/yr
- Insurance
- −$250
- HOA
- −$0
- Vacancy / Maint / Mgmt
- −$1,698
- Net cashflow
- $2,074
Break-even live
Sensitivity live
| Price | -10% $2,414 | -5% $2,244 | +0% $2,074 | +5% $1,904 | +10% $1,734 |
|---|---|---|---|---|---|
| Rent | -10% $1,435 | -5% $1,755 | +0% $2,074 | +5% $2,393 | +10% $2,713 |
| Rate | -1.0pp $2,376 | -0.5pp $2,227 | base $2,074 | +0.5pp $1,919 | +1.0pp $1,760 |
3-unit breakdown (identical units grouped — click to expand)
| Units | Beds | Baths | Est. rent |
|---|---|---|---|
| 3× units | 4 | 4 | $8,085 |
| #1 | 4 | 4 | $2,695 |
| #2 | 4 | 4 | $2,695 |
| #3 | 4 | 4 | $2,695 |
| Total (3 units) | $8,085 | ||
UW: 25.0% down · 7.5% · 30yr · 1.5% tax · 5.0% vac · 8.0% maint · 8.0% mgmt
Financing live
Cash to close
- Down payment
- $149,972
- Closing costs
- $17,997
- Reserves months
- —
- Total cash needed
- —
Loan-product check · same deal, 3 products live
Conventional
25% down · 7.5% · 30yr
- Down + closing
- —
- Monthly P&I
- —
- Monthly cashflow
- —
- DSCR
- —
- Eligible?
- —
Personal DTI + credit; lowest rate.
DSCR
20% down · 8.5% · 30yr
- Down + closing
- —
- Monthly P&I
- —
- Monthly cashflow
- —
- DSCR
- —
- Eligible?
- —
No personal income docs; deal must DSCR.
Hard money
10% down · 12.0% · 12mo
- Down + closing
- —
- Monthly P&I
- —
- Monthly cashflow
- —
- DSCR
- —
- Eligible?
- —
Short-term bridge; refi at stabilization.
Rent comps 17 comps
| Address | Beds | Baths | Sqft | Rent | $/sqft | DOM | Units | Dist |
|---|---|---|---|---|---|---|---|---|
| 3337 64th Avenue Pl Oakland, CA | 3.0 | 2.0 | 1410 | $3,800 | $2.70 | 11d | 1 | 0.07mi |
| 3849 Delmont Ave Oakland, CA | 3.0 | 2.0 | 1496 | $3,950 | $2.64 | 44d | 1 | 0.47mi |
| 5875 Picardy Dr Oakland, CA | 4.0 | 2.5 | 1906 | $5,200 | $2.73 | 44d | 1 | 0.47mi |
| 5307 Hillen Dr Oakland, CA | 3.0 | 2.0 | 1831 | $3,895 | $2.13 | 5d | 1 | 0.80mi |
| 5834 Elizabeth St Oakland, CA | 3.0 | 1.0 | 1050 | $3,724 | $3.55 | 44d | 1 | 0.83mi |
| 6088 Old Quarry Loop #5207 Oakland, CA | 4.0 | 3.0 | 1687 | $4,250 | $2.52 | 3d | 1 | 0.83mi |
| 7625 Lockwood St Oakland, CA | 5.0 | 3.0 | 2115 | $1,199 | $0.57 | 44d | 1 | 0.89mi |
| 7724 Crest Ave Oakland, CA | 3.0 | 1.0 | 1500 | $3,300 | $2.20 | 44d | 1 | 0.96mi |
| 6252 Ridgemont Dr Oakland, CA | 3.0 | 2.5 | 1885 | $5,495 | $2.92 | 0d | 1 | 0.97mi |
| 8109 Hillside St Oakland, CA | 3.0 | 1.0 | 1182 | $3,300 | $2.79 | 44d | 1 | 1.06mi |
| 8027 Ney Ave Unit 1 Oakland, CA | 4.0 | 2.0 | 1300 | $4,413 | $3.39 | 0d | 1 | 1.08mi |
| 1715 82nd Ave Oakland, CA | 3.0 | 2.0 | 1290 | $3,000 | $2.33 | 44d | 1 | 1.14mi |
| 3210 82nd Ave Oakland, CA | 3.0 | 2.0 | 1462 | $4,300 | $2.94 | 21d | 1 | 1.25mi |
| 4254 Gregory St Oakland, CA | 3.0 | 3.0 | 1949 | $4,500 | $2.31 | 44d | 1 | 1.34mi |
| 1924 51st Ave Unit 3 Oakland, CA | 3.0 | 2.0 | 1100 | $6,800 | $6.18 | 44d | 1 | 1.34mi |
| 8600 MacArthur Blvd Apt C Oakland, CA | 3.0 | 1.0 | 1200 | $2,600 | $2.17 | 44d | 1 | 1.39mi |
| 2169 48th Ave Unit A Oakland, CA | 3.0 | 1.0 | 1145 | $2,995 | $2.62 | 44d | 1 | 1.42mi |
Listing history 50 events
-
2026-06-18days on market $599,888 Active 35 DOM
-
2026-06-17days on market $599,888 Active 34 DOM
-
2026-06-16days on market $599,888 Active 33 DOM
-
2026-06-15days on market $599,888 Active 32 DOM
-
2026-06-13days on market $599,888 Active 30 DOM
-
2026-06-13days on market $599,888 Active 29 DOM
-
2026-06-09days on market $599,888 Active 26 DOM
-
2026-06-08days on market $599,888 Active 25 DOM
-
2026-06-07days on market $599,888 Active 24 DOM
-
2026-06-04days on market $599,888 Active 21 DOM
-
2026-06-03days on market $599,888 Active 20 DOM
-
2026-06-02days on market $599,888 Active 19 DOM
-
2026-06-01days on market $599,888 Active 18 DOM
-
2026-05-31days on market $599,888 Active 17 DOM
-
2026-05-14$599,888 Active 831-char remark
-
2021-01-31historical
-
2020-12-18price
-
2020-12-13New
-
2018-09-24historical
-
2016-12-22soldstatus $520,000 Sold
-
2016-12-22soldstatus $520,000
-
2016-12-06soldstatus $520,000
-
2016-11-01status Pending
-
2016-10-19price $479,000
-
2016-10-18$439,000 New
-
2016-10-18$479,000
-
2014-07-02historical
-
2014-07-01soldstatus $355,000 Sold
-
2014-07-01soldstatus $355,000 Sold
-
2014-06-30soldstatus $355,000
-
2014-05-11status Pending - Show for Backups
-
2014-05-11status Pending - Show for Backups
-
2014-04-22price $359,000 Price Change
-
2014-04-19price $359,000 Price Change
-
2014-03-20$389,000 New
-
2014-03-19$389,000 New
-
2014-03-19historical
-
2014-02-16status Pending - Show for Backups
-
2013-12-29price Price Change
-
2013-12-19New
-
2011-07-06soldstatus $215,000 Sold
-
2011-06-01soldstatus $215,000
-
2011-04-19status Pending
-
2011-03-22price $219,500 Price Change
-
2011-02-17price $229,500 Price Change
-
2011-01-31$249,950 New
-
2009-03-27soldstatus $117,500 Sold
-
2009-01-19historical
-
2008-12-24price $140,025
-
2008-12-09price $144,900
ⓘ Source: listings_history table (triggers on properties + properties_extension) + one-shot
backfill from property_details.listing_events for pre-trigger history.
Tax reassessment forecast CA · Resets to sale price
- Current annual tax
- $11,008 · $917/mo
- Projected year-2 tax
- $11,008 · $917/mo
- Expected delta
- $0/yr ($0/mo · 0.0%)
ⓘ Screening estimate from a state-policy table — verify with the county assessor before closing.
Climate risk First Street
- Flood 1/10 Low FEMA zone X (unshaded) · 0% chance over 30 yrs
- Wildfire 2/10 Low
- Heat 3/10 Moderate 7 d/yr ≥84°F today · 15 d/yr by 30 yrs out
- Wind 1/10 Low
- Air quality 8/10 Severe 14 unhealthy d/yr today · 14 by 30 yrs out
Nearby sold comps map
Loading sold comps map…
Walkable amenities ~0.75 mi
Loading nearby amenities…
Taxation est. · year 1
- Rental income
- $97,020
- − Mortgage interest
- −$33,603
- − Property taxes
- −$11,008
- − Insurance
- −$2,999
- − Repairs & maintenance
- −$7,762
- − Management
- −$7,762
- − Depreciation
- −$17,451
- Taxable income
- $16,435
- Est. tax owed @ 24.0%
- −$3,944
- After-tax cash flow
- $20,943/yr
For passive investors: Depreciation is non-cash, so a rental often shows a tax loss while cash-flowing — sheltering income. Rental losses are passive: they offset passive income freely, and up to $25,000/yr can offset ordinary (W-2) income if you actively participate and your MAGI is under $100k (phasing out to $0 by $150k); unused losses carry forward. On sale, claimed depreciation is recaptured at up to 25%, and gains may owe capital-gains tax (a 1031 exchange can defer both). Figures are a year-1 estimate at your 24.0% rate — not tax advice; consult a CPA.
Schools (NCES district)
- District
- Oakland Unified
- NCES district ID
- 0628050
- Math proficiency
- 27% ▬ 0.00%
- Reading proficiency
- 33% ▬ 0.00%
- Median HH income
- $55,194
- Composite
- 29.52/100
- National rank
- #11769
- State rank
- #1007 of 1400 in CA
Livability — Oakland
- Score
- 71/100
- State rank
- #224
- US rank
- #7245
Category grades
Schools grade is shown separately in the Schools card above.
Census & demographics
- Census place
- Oakland, CA
- County
- Alameda County · 1,614,355 people
- City population
- 385,993
- Metro
- San Francisco-Oakland-Berkeley, CA
- Population (ZIP)
- 44,103
- Household income
- $106,068
- Rent vs Own
- Severe rent burden
- 2086.0
Population outlook (Alameda County) Hauer SSP2
- Today (2025)
- 1,928,884 people
- By 2030
- 2,069,146 · +7.3%
- By 2040
- 2,338,405 · +21.2%
- By 2050
- 2,586,608 · +34.1%
- By 2075
- 3,061,911 · +58.7%
- By 2100
- 3,234,133 · +67.7%
Race, ethnicity, and origin ACS 2023
- Neighborhood character
- Highly diverse neighborhood (Simpson 0.73)
- Race & ethnicity
- Black 40% Hispanic / Latino 27% White 17% Two or more races 11% Asian 9%
- Hispanic origin (detail)
- Mexican 18% Puerto Rican 1%
- Common ancestry
- Italian 2% Lithuanian 1% Romanian 1%
- Foreign-born
- 20% · Canada, China, Vietnam
- Languages at home
- 70% English-only · Spanish 21% Chinese 2% Other Asian/Pacific 2%
Political lean MEDSL · Alameda
- 2024 margin
- Solid D (+53.6) · D 74.6% · R 21.0% · Other 4.4%
- 2008→2024 swing
- -5.9pp toward R · 2008: 59.5pp · 2024: 53.6pp
- All cycles
- 2024: D+53.6 2020: D+62.5 2016: D+64.4 2012: D+59.8 2008: D+59.5
Not yet ingested
- Civics
- —
Market trends
- HPI YoY
- ▼ -793.09%
- Current HPI
- 294.5467
- Rent YoY
- ▲ 0.65%
- Metro
- San Francisco-Oakland-Berkeley, CA
- State GDP YoY
- ▲ 3.21%
- F500 in state
- 116
Industry mix (Fortune 500 HQ in CA)
| Industry | F500 HQs | Revenue |
|---|---|---|
| Technology | 27 | $1,492B |
|
||
| Financial Services | 3 | $174B |
|
||
| Retail | 3 | $44B |
|
||
| Insurance | 3 | $26B |
|
||
| Media / Entertainment | 2 | $115B |
|
||
| Pharmaceuticals / Biotech | 2 | $62B |
|
||
Price history
+50.0% since first listed46 events — show timeline
- 2026-05-14 Listed $599,888 bridgeMLS, Bay East AOR, or Contra Costa AOR
- 2021-01-31 Listing Removed — bridgeMLS, Bay East AOR, or Contra Costa AOR
- 2020-12-18 Price Changed — bridgeMLS, Bay East AOR, or Contra Costa AOR
- 2020-12-13 Listed — bridgeMLS, Bay East AOR, or Contra Costa AOR
- 2018-09-24 Listing Removed — bridgeMLS, Bay East AOR, or Contra Costa AOR
- 2016-12-22 Sold (MLS) $520,000 SDMLS
- 2016-12-22 Sold (MLS) $520,000 bridgeMLS, Bay East AOR, or Contra Costa AOR
- 2016-12-06 Sold (Public Records) $520,000 Public Records
- 2016-11-01 Pending — bridgeMLS, Bay East AOR, or Contra Costa AOR
- 2016-10-19 Price Changed $479,000 bridgeMLS, Bay East AOR, or Contra Costa AOR
- 2016-10-18 Listed $439,000 bridgeMLS, Bay East AOR, or Contra Costa AOR
- 2016-10-18 Listed $479,000 SDMLS
- 2014-07-02 Listing Removed — bridgeMLS, Bay East AOR, or Contra Costa AOR
- 2014-07-01 Sold (MLS) $355,000 bridgeMLS, Bay East AOR, or Contra Costa AOR
- 2014-07-01 Sold (MLS) $355,000 bridgeMLS, Bay East AOR, or Contra Costa AOR
- 2014-06-30 Sold (Public Records) $355,000 Public Records
- 2014-05-11 Pending — bridgeMLS, Bay East AOR, or Contra Costa AOR
- 2014-05-11 Pending — bridgeMLS, Bay East AOR, or Contra Costa AOR
- 2014-04-22 Price Changed $359,000 bridgeMLS, Bay East AOR, or Contra Costa AOR
- 2014-04-19 Price Changed $359,000 bridgeMLS, Bay East AOR, or Contra Costa AOR
- 2014-03-20 Listed $389,000 bridgeMLS, Bay East AOR, or Contra Costa AOR
- 2014-03-19 Listed $389,000 bridgeMLS, Bay East AOR, or Contra Costa AOR
- 2014-03-19 Listing Removed — bridgeMLS, Bay East AOR, or Contra Costa AOR
- 2014-02-16 Pending — bridgeMLS, Bay East AOR, or Contra Costa AOR
- 2013-12-29 Price Changed — bridgeMLS, Bay East AOR, or Contra Costa AOR
- 2013-12-19 Listed — bridgeMLS, Bay East AOR, or Contra Costa AOR
- 2011-07-06 Sold (MLS) $215,000 bridgeMLS, Bay East AOR, or Contra Costa AOR
- 2011-06-01 Sold (Public Records) $215,000 Public Records
- 2011-04-19 Pending — bridgeMLS, Bay East AOR, or Contra Costa AOR
- 2011-03-22 Price Changed $219,500 bridgeMLS, Bay East AOR, or Contra Costa AOR
- 2011-02-17 Price Changed $229,500 bridgeMLS, Bay East AOR, or Contra Costa AOR
- 2011-01-31 Listed $249,950 bridgeMLS, Bay East AOR, or Contra Costa AOR
- 2009-03-27 Sold (MLS) $117,500 bridgeMLS, Bay East AOR, or Contra Costa AOR
- 2009-01-19 Listing Removed — bridgeMLS, Bay East AOR, or Contra Costa AOR
- 2008-12-24 Price Changed $140,025 bridgeMLS, Bay East AOR, or Contra Costa AOR
- 2008-12-09 Price Changed $144,900 bridgeMLS, Bay East AOR, or Contra Costa AOR
- 2008-12-04 Price Changed $160,050 bridgeMLS, Bay East AOR, or Contra Costa AOR
- 2008-11-21 Listed $163,200 bridgeMLS, Bay East AOR, or Contra Costa AOR
- 2007-11-09 Listing Removed — bridgeMLS, Bay East AOR, or Contra Costa AOR
- 2006-11-01 Sold (Public Records) $629,000 Public Records
- 2006-09-11 Listing Removed — bridgeMLS, Bay East AOR, or Contra Costa AOR
- 2006-04-12 Listing Removed — bridgeMLS, Bay East AOR, or Contra Costa AOR
- 2005-07-29 Sold (Public Records) $400,000 Public Records
- 2005-07-29 Sold (MLS) $400,000 bridgeMLS, Bay East AOR, or Contra Costa AOR
- 2005-07-01 Listing Removed — bridgeMLS, Bay East AOR, or Contra Costa AOR
- 2005-06-17 Listed $399,950 bridgeMLS, Bay East AOR, or Contra Costa AOR
Property tax history
-1.8%/yrLatest (2025): $11,008 · +4.3% YoY. Source: county tax records.
Cash-flow waterfall
monthlySold comps — $/sqft
last 12 mo · ≤1 miLoading sold comps…