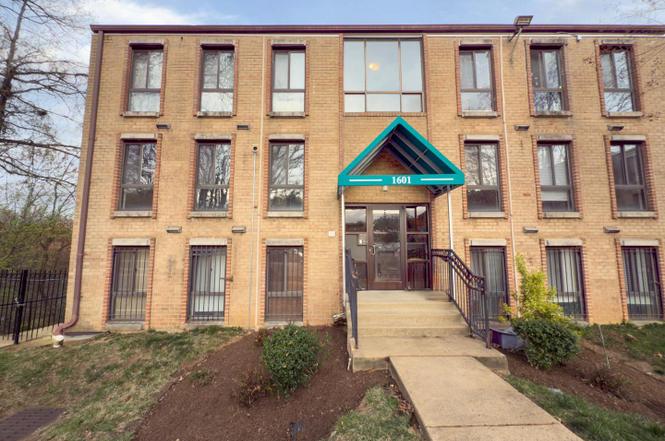
1601 Gainesville St SE #201 · Washington, DC
Flood risk No data
- FEMA flood zone
- —
- Chance of flooding over 30 yrs
- —
- Est. flood insurance / yr
- —
Fire risk No data
- Est. fire insurance / yr
- —
Heat risk No data
- Hot days now (above threshold)
- —
- Hot days in 30 yrs
- —
Wind risk No data
- Chance of severe wind over 30 yrs
- —
Air-quality risk No data
- Unhealthy air days now
- —
- Unhealthy air days in 30 yrs
- —
Risk factors via First Street. Map © Google.
Why this score? — see what drove the C grade
The composite is a weighted blend of 9 inputs, each scored 0–100. Each bar is that input's sub-score; the figure is the points it added to the 100-point composite (weight × sub-score).
- Cash flow +20.3/30.0
- 1% rule +8.3/10.0
- ARV discount +7.5/15.0
- DSCR +6.4/10.0
- Livability +3.7/5.0
- Schools +3.6/10.0
- Rent growth +3.5/5.0
- Condition / age +2.5/5.0
- Appreciation +0.0/10.0
$219,950
🖨 Deal sheet 📄 Offer letter ✓ Due diligence
Listing remarks
ASK YOUR AGENT TODAY ABOUT 6 MONTHS FREE CONDO FEES! Welcome to 1601 Gainesville Street SE – a spacious and move-in ready 3-bedroom, 2.5-bath unit located on the second level. This well-maintained home features freshly and professionally painted interiors, offering a clean, modern feel throughout. With a functional layout, generous bedroom sizes, and two full bathrooms plus a convenient half bath, this unit is perfect for comfortable everyday living or entertaining. Conveniently located near public transportation, shopping, and commuter routes, this is a fantastic opportunity to own in the heart of DC. Property is being sold strictly as-is. Schedule your showing today!
Key facts
- $586 HOA
- Built 1965
- Listed 74 days
Property features AI
Finance
- Other: Pets allowed with size/weight restrictions
- HOA & community: Monthly condo fee of $586.45; Condo fee covers exterior building maintenance, water, sewer, trash, and snow removal
Exterior
- Parking: Parking lot
- Utilities: Public water; Public sewer
- Home design: Condominium unit / flat; Building name: RANDLE HEIGHTS; Entry on level 2
- Construction: Brick construction
- Exterior features: Garden-style building (1–4 floors); Above grade and below grade structures present; Located within city limits
Interior
- Bedrooms: Three bedrooms on the main level
- Bathrooms: Two full bathrooms; One half bathroom
- Heating & cooling: Central heating (natural gas); Central air conditioning (electric); Electric hot water
- Interior features: No basement; Living area reported by assessor
- Laundry & utility: No in-unit washer/dryer hookup
Neighborhood map
What this means for you Summary
Snapshot
- This is a 3-bed/2.5-bath condo listed at $220k.
Deal economics
- At list price, monthly cash flow is $282 ($3k/yr) — positive.
- The deal already cash-flows at list — no discount required.
- Meets the 1% rule at list price ($3k rent vs $220k).
- Recommended offer: $207k (6.0% below list) — sets the bar for market timing.
- Cap rate 7.8% vs local median 2.5% in Washington — top-decile yield for the area; either an underpriced asset or a hidden risk that comps aren't pricing in. Stress-test before assuming the spread holds.
Location & tenants
- Location reads 73/100 on livability (#1 in DC) — a middle-class / working-renter tenant base. Strengths: amenities A+, commute A+, employment A+; Watch: crime F, cost of living F.
- District Of Columbia Public Schools (urban): math 33% / reading 40% proficiency, ranked #8 of 32 in DC (top 25%) — families likely to look elsewhere, expect single-tenant / working-renter base with shorter leases; 65% free/reduced lunch — lower-income household profile, screen leases tightly.
- Market conditions: Rents rising (+3.9%/yr); 296 active listings in the ZIP; 40 comparable units currently listed for rent nearby; rentals at typical pace (median 24d on market — plan ~3-4 weeks tenant-placement turnaround); 1,737 units permitted in District of Columbia in 2024 (1,506 in 5+ unit buildings).
- At $2,923/mo this rent would consume 65% of the median local household income ($54k/yr) (locally 5148% of renters already pay >50% of income on rent) — very limited rent-growth headroom before tenants either downsize or default.
Forward outlook
- Local home prices are declining (-3.0%/yr); year-one equity from $2k of loan paydown is wiped out by about $7k of value loss. Plan a longer hold.
- District of Columbia County population projected at +50% by 2050 — long-run rental-demand tailwind backs the buy-and-hold thesis.
Negotiation context
- It's been on market 74 days — a 6% lower offer ($207k) is reasonable based on typical stale-listing flexibility.
- 4 sale attempts with the ask held roughly flat each time — persistent listings suggest the price (not the market) is what's stuck; bring a comps-based counter.
- Current owner paid $120k; list at $220k implies a 83% gain — meaningful room to come down on a strong offer.
Risks & watch-outs
- Watch-outs: HOA is 20% of rent.
Questions for the listing agent
- It's been on market 74 days. Have you received any prior offers? Is the seller open to a 6% concession, seller financing, or rate buy-down credit?
- Built in 1965 — when were the roof, HVAC, electrical panel, plumbing, and water heater last replaced?
- What does the HOA fee cover, when was the last increase, and are there any pending special assessments or reserve-fund shortfalls?
- Any open or pending special assessments — roof, HVAC, plumbing, elevator, façade? What's the per-unit balance and payoff schedule, and is the seller paying it off at close or rolling it to the buyer?
- Why hasn't it sold? Are there any deal-killer items the seller is aware of (foundation, flood, title, zoning, code violations)?
- Is there a deadline driving the sale (1031 exchange, divorce, estate, relocation)? That informs how much negotiation room exists.
- Crime grade is F in this area — have there been break-ins, vandalism, or insurance claims at this property in the last 3 years? What carrier currently insures it and at what premium?
- What's the average days-on-market for RENTAL listings here right now (not sales)? A rising rental-DOM trend means longer vacancies and softer asking-rent achievability than the comps imply.
- What's the recent tenant-quality profile in this submarket — average credit score on applications, eviction rate, late-payment / NSF rate, and stable-employment percentage? A property-management company in the area should have these aggregated.
- How much new apartment / multifamily construction is in the pipeline within 1–3 miles? Heavy new supply (>2% of stock underway) typically softens rents 12–24 months out; light construction supports rent growth.
Investment metrics
- 1% rule
- 1.33% ✓
- Cap rate
- 7.83%
- Cash-on-cash
- 5.49%
- DSCR
- 1.24
- GRM
- 6.3
CMA / ARV
No comps found within radius.
Projected returns pro-forma
-3.0% appreciation · 3.86% rent growth · sell at horizon
- IRR
- -6.4%
- Equity multiple
- 0.76×
- Total profit
- $-14,793
- Equity at exit
- $32,795
- IRR
- 4.7%
- Equity multiple
- 1.36×
- Total profit
- $22,320
- Equity at exit
- $19,017
Cash invested: $61,586 (down + closing). Projections, not guarantees.
Landlord ↔ Tenant lean methodology
- Overall (CITY)
- 0 Strongly Tenant-Friendly
- State District of Columbia
- 12 Strongly Tenant-Friendly · D+43
- County
- — inherits STATE
- City Washington
- 0 Strongly Tenant-Friendly · D+43
ZIP-level market 20020
- Rents YoY
- 3.9%
- Active inventory
- 296
- Price-to-rent
- 6.3×
Monthly cashflow live
- Estimated rent
- $2,923 high interval (Pro) →
- Mortgage (P&I)
- −$1,153
- Tax from tax record
- −$197 /mo · $2,358/yr
- Insurance
- −$92
- HOA
- −$586
- Vacancy / Maint / Mgmt
- −$614
- Net cashflow
- $282
Break-even live
UW: 25.0% down · 7.5% · 30yr · 1.5% tax · 5.0% vac · 8.0% maint · 8.0% mgmt
Financing live
Cash to close
- Down payment
- $54,988
- Closing costs
- $6,598
- Reserves months
- —
- Total cash needed
- —
Loan-product check · same deal, 3 products live
Conventional
25% down · 7.5% · 30yr
- Down + closing
- —
- Monthly P&I
- —
- Monthly cashflow
- —
- DSCR
- —
- Eligible?
- —
Personal DTI + credit; lowest rate.
DSCR
20% down · 8.5% · 30yr
- Down + closing
- —
- Monthly P&I
- —
- Monthly cashflow
- —
- DSCR
- —
- Eligible?
- —
No personal income docs; deal must DSCR.
Hard money
10% down · 12.0% · 12mo
- Down + closing
- —
- Monthly P&I
- —
- Monthly cashflow
- —
- DSCR
- —
- Eligible?
- —
Short-term bridge; refi at stabilization.
Rent comps 40 comps
| Address | Beds | Baths | Sqft | Rent | $/sqft | DOM | Units | Dist |
|---|---|---|---|---|---|---|---|---|
| 1722 Gainesville St SE Washington, DC | 4.0 | 2.5 | 2000 | $3,490 | $1.75 | 24d | 1 | 0.07mi |
| 2390 Elvans Rd SE Washington, DC | 3.0 | 2.5 | 2176 | $3,190 | $1.47 | 7d | 1 | 0.21mi |
| 2460 James Bank Rd SE Washington, DC | 3.0 | 3.5 | 1687 | $3,190 | $1.89 | 14d | 1 | 0.28mi |
| 1527 Morris Rd SE Washington, DC | 3.0 | 2.5 | 1508 | $2,700 | $1.79 | 7d | 1 | 0.31mi |
| 1851 Tubman Rd SE Washington, DC | 3.0 | 2.0 | 1689 | $3,200 | $1.89 | 24d | 1 | 0.41mi |
| 1750 Galen St SE Washington, DC | 3.0 | 3.0 | 1138 | $2,300 | $2.02 | 3d | 1 | 0.47mi |
| 3243 15th Pl SE Washington, DC | 2.0 | 2.0 | 1248 | $2,500 | $2.00 | 24d | 1 | 0.49mi |
| 1705 W St SE Washington, DC | 4.0 | 2.0 | 1550 | $2,500 | $1.61 | 2d | 1 | 0.53mi |
| 1505 West St SE Unit 1 Washington, DC | 3.0 | 2.5 | 2100 | $3,300 | $1.57 | 1d | 1 | 0.61mi |
| 1351 Morris Rd SE Unit Upstairs Washington, DC | 3.0 | 2.0 | 1522 | $2,700 | $1.77 | 4d | 1 | 0.64mi |
| 2227 14th St SE Washington, DC | 3.0 | 1.0 | 1222 | $2,495 | $2.04 | 24d | 1 | 0.65mi |
| 1328 Morris Rd SE Washington, DC | 3.0 | 2.5 | 1372 | $3,250 | $2.37 | 17d | 1 | 0.66mi |
| 1308 Talbert Ct SE Washington, DC | 3.0 | 2.5 | 1446 | $2,995 | $2.07 | 5d | 1 | 0.67mi |
| 2648 Bowen Rd SE Washington, DC | 3.0 | 1.5 | 1220 | $2,500 | $2.05 | 24d | 1 | 0.67mi |
| 1325 Valley Pl SE Washington, DC | 4.0 | 2.0 | 2138 | $6,500 | $3.04 | 24d | 1 | 0.68mi |
| 1300 Dexter Ter SE Washington, DC | 2.0 | 1.5 | 1100 | $2,600 | $2.36 | 24d | 1 | 0.68mi |
| 1430 V St SE Washington, DC | 3.0 | 2.0 | 1680 | $3,100 | $1.85 | 24d | 1 | 0.72mi |
| 2501 Sayles Pl SE #9 Washington, DC | 2.0 | 2.0 | 1157 | $2,500 | $2.16 | 24d | 1 | 0.75mi |
| 2501 Sayles Pl SE #9 Washington, DC | 2.0 | 2.0 | 1157 | $2,500 | $2.16 | 10d | 1 | 0.75mi |
| 2300 Good Hope Rd SE Washington, DC | 2.0 | 1.0–2.0 | 1020 | $1,913 | $1.88 | 24d | 6 | 0.76mi |
| 2202 U Pl SE Washington, DC | 2.0 | 1.5 | 1232 | $3,500 | $2.84 | 24d | 1 | 0.78mi |
| 3459 23rd St SE Washington, DC | 2.0 | 1.0 | 1200 | $2,100 | $1.75 | 5d | 1 | 0.79mi |
| 1919 16th St SE Washington, DC | 3.0 | 1.5 | 1920 | $2,100 | $1.09 | 24d | 1 | 0.81mi |
| 1516 Marion Barry Ave SE Unit 301 Washington, DC | 3.0 | 2.0 | 1100 | $1,795 | $1.63 | 7d | 1 | 0.81mi |
| 1201 Oak Dr SE Washington, DC | 3.0 | 1.0–2.0 | 853 | $2,220 | $2.60 | 1d | 19 | 0.83mi |
| 2322 Shannon Pl SE Washington, DC | 3.0 | 3.5 | 1800 | $2,800 | $1.56 | 24d | 1 | 0.86mi |
| 1214 U St SE Washington, DC | 3.0 | 2.5 | 1350 | $3,375 | $2.50 | 24d | 1 | 0.90mi |
| 3150 Buena Vista Ter SE Apt 6 Washington, DC | 4.0 | 1.0 | 1398 | $4,250 | $3.04 | 24d | 1 | 0.91mi |
| 1802 14th St SE Washington, DC | 3.0 | 2.0 | 1800 | $2,800 | $1.56 | 24d | 1 | 0.92mi |
| 1634 Ridge Pl SE Washington, DC | 3.0 | 3.5 | 1248 | $3,200 | $2.56 | 24d | 1 | 0.96mi |
| 1938 S St SE Washington, DC | 3.0 | 2.0 | 1522 | $2,999 | $1.97 | 24d | 1 | 0.97mi |
| 802 Malcolm X Ave SE Washington, DC | 4.0 | 1.0 | 1140 | $3,150 | $2.76 | 24d | 1 | 0.99mi |
| 2913 8th St SE #3101 Washington, DC | 2.0 | 2.0 | 1100 | $2,400 | $2.18 | 13d | 1 | 1.00mi |
| 615 Malcolm X Ave SE Unit F Washington, DC | 3.0 | 1.0 | 1100 | $2,508 | $2.28 | 2d | 1 | 1.10mi |
| 3210 8th St SE #1 Washington, DC | 2.0 | 2.0 | 1106 | $2,395 | $2.17 | 24d | 1 | 1.12mi |
| 3010 V Pl SE Washington, DC | 4.0 | 3.0 | 2232 | $3,500 | $1.57 | 24d | 1 | 1.13mi |
| 1516 18th St SE Washington, DC | 3.0 | 2.0 | 1941 | $3,200 | $1.65 | 24d | 1 | 1.14mi |
| 2612 33rd St SE Washington, DC | 3.0 | 3.0 | 1826 | $3,529 | $1.93 | 24d | 1 | 1.15mi |
| 407 Lebaum St SE Unit 4 Washington, DC | 2.0 | 1.0 | 1192 | $2,100 | $1.76 | 24d | 1 | 1.19mi |
| 1800 28th Pl SE #201 Washington, DC | 3.0 | 2.0 | 1132 | $2,800 | $2.47 | 2d | 1 | 1.21mi |
HOA detail condo
- Monthly dues
- $586 · $7,032/yr
- Assessments
- None detected in remarks — confirm with the listing agent.
Listing history 15 events
-
2026-05-11status Pending
-
2026-04-06price $219,950
-
2026-02-26$224,950 Active
-
2026-02-26historical
-
2025-12-24price $224,950
-
2025-11-21price $234,950
-
2025-11-14status Active
-
2025-10-02status Active Under Contract
-
2025-09-30historical
-
2025-09-11price $239,950
-
2025-07-12price $249,950
-
2025-06-12price $254,950
-
2025-05-06price $269,950
-
2025-04-03$289,950 Active
-
2003-12-08soldstatus $120,000
ⓘ Source: listings_history table (triggers on properties + properties_extension) + one-shot
backfill from property_details.listing_events for pre-trigger history.
Tax reassessment forecast DC · Partial reset (capped growth)
- Current annual tax
- $2,358 · $197/mo
- Projected year-2 tax
- $2,358 · $197/mo
- Expected delta
- $0/yr ($0/mo · 0.0%)
ⓘ Screening estimate from a state-policy table — verify with the county assessor before closing.
Nearby sold comps map
Loading sold comps map…
Walkable amenities ~0.75 mi
Loading nearby amenities…
Taxation est. · year 1
- Rental income
- $35,078
- − Mortgage interest
- −$12,321
- − Property taxes
- −$2,358
- − Insurance
- −$1,100
- − Repairs & maintenance
- −$2,806
- − Management
- −$2,806
- − HOA
- −$7,032
- − Depreciation
- −$6,399
- Taxable income
- $256
- Est. tax owed @ 24.0%
- −$62
- After-tax cash flow
- $3,319/yr
For passive investors: Depreciation is non-cash, so a rental often shows a tax loss while cash-flowing — sheltering income. Rental losses are passive: they offset passive income freely, and up to $25,000/yr can offset ordinary (W-2) income if you actively participate and your MAGI is under $100k (phasing out to $0 by $150k); unused losses carry forward. On sale, claimed depreciation is recaptured at up to 25%, and gains may owe capital-gains tax (a 1031 exchange can defer both). Figures are a year-1 estimate at your 24.0% rate — not tax advice; consult a CPA.
Schools (NCES district)
- District
- District Of Columbia Public Schools
- NCES district ID
- 1100030
- Math proficiency
- 33% ▲ 3.00%
- Reading proficiency
- 40% ▲ 5.00%
- Median HH income
- $67,671
- Composite
- 35.84/100
- National rank
- #9606
- State rank
- #8 of 32 in DC
Livability — Washington
- Score
- 73/100
- State rank
- #1
- US rank
- #5327
Category grades
Schools grade is shown separately in the Schools card above.
Census & demographics
- Census place
- Washington, DC
- County
- District of Columbia · 671,873 people
- City population
- 671,873
- Metro
- Washington-Arlington-Alexandria, DC-VA-MD-WV
- Population (ZIP)
- 53,005
- Household income
- $54,032
- Rent vs Own
- Severe rent burden
- 5148.0
Population outlook (District of Columbia County) Hauer SSP2
- Today (2025)
- 821,926 people
- By 2030
- 899,517 · +9.4%
- By 2040
- 1,061,162 · +29.1%
- By 2050
- 1,231,493 · +49.8%
- By 2075
- 1,603,312 · +95.1%
- By 2100
- 1,847,141 · +124.7%
Race, ethnicity, and origin ACS 2023
- Neighborhood character
- Predominantly Black (90%)
- Race & ethnicity
- Black 90% Two or more races 3% Hispanic / Latino 3% White 3%
- Common ancestry
- Lithuanian 1%
- Foreign-born
- 3% · Canada
- Languages at home
- 95% English-only · Spanish 2% French/Haitian/Cajun 1%
Political lean MEDSL · District of Columbia
- 2024 margin
- Solid D (+86.1) · D 91.2% · R 5.1% · Other 3.8%
- 2008→2024 swing
- +0.1pp no change · 2008: 85.9pp · 2024: 86.1pp
- All cycles
- 2024: D+86.1 2020: D+86.8 2016: D+88.7 2012: D+84.2 2008: D+85.9
Not yet ingested
- Civics
- —
Market trends
- HPI YoY
- ▼ -415.44%
- Current HPI
- 306.5068
- Rent YoY
- ▲ 3.86%
- Metro
- Washington-Arlington-Alexandria, DC-VA-MD-WV
- State GDP YoY
- ▲ 1.33%
- F500 in state
- 6
Industry mix (Fortune 500 HQ in DC)
| Industry | F500 HQs | Revenue |
|---|---|---|
| Financial Services | 1 | $153B |
|
||
| Life Sciences / Industrials | 1 | $25B |
|
||
| Industrial Machinery | 1 | $8B |
|
||
Price history
+83.3% since first listed15 events — show timeline
- 2026-05-11 Pending — BRIGHT MLS
- 2026-04-06 Price Changed $219,950 BRIGHT MLS
- 2026-02-26 Listing Removed — BRIGHT MLS
- 2026-02-26 Listed $224,950 BRIGHT MLS
- 2025-12-24 Price Changed $224,950 BRIGHT MLS
- 2025-11-21 Price Changed $234,950 BRIGHT MLS
- 2025-11-14 Relisted — BRIGHT MLS
- 2025-10-02 Relisted — BRIGHT MLS
- 2025-09-30 Listing Removed — BRIGHT MLS
- 2025-09-11 Price Changed $239,950 BRIGHT MLS
- 2025-07-12 Price Changed $249,950 BRIGHT MLS
- 2025-06-12 Price Changed $254,950 BRIGHT MLS
- 2025-05-06 Price Changed $269,950 BRIGHT MLS
- 2025-04-03 Listed $289,950 BRIGHT MLS
- 2003-12-08 Sold (Public Records) $120,000 Public Records
Property tax history
+1.8%/yrLatest (2025): $2,358 · -2.4% YoY. Source: county tax records.
Cash-flow waterfall
monthlySold comps — $/sqft
last 12 mo · ≤1 miLoading sold comps…