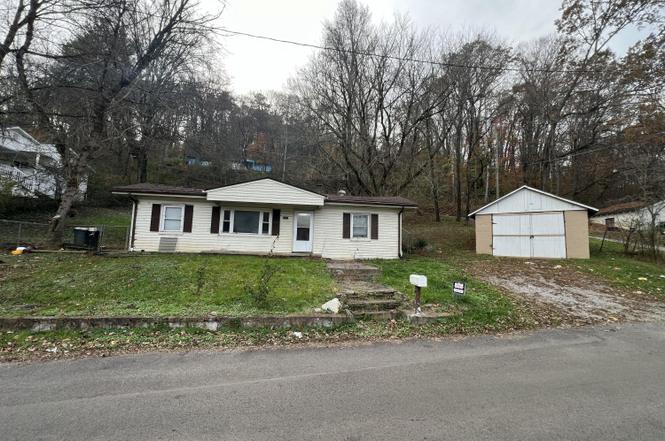
129 Turkey Rd · Powell, TN
Flood risk 1/10 · Minimal
- FEMA flood zone
- X (unshaded)
- Chance of flooding over 30 yrs
- 0.0%
- Est. flood insurance / yr
- $507 – $1,088
Fire risk 5/10 · Moderate
- Est. fire insurance / yr
- $949 – $1,763
Heat risk 5/10 · Moderate
- Hot days now (above 102°F)
- 7 days/yr
- Hot days in 30 yrs
- 19 days/yr
Wind risk 2/10 · Minimal
- Chance of severe wind over 30 yrs
- 1.0%
Air-quality risk 3/10 · Minor
- Unhealthy air days now
- 3 days/yr
- Unhealthy air days in 30 yrs
- 4 days/yr
Risk factors via First Street. Map © Google.
Why this score? — see what drove the B- grade
The composite is a weighted blend of 9 inputs, each scored 0–100. Each bar is that input's sub-score; the figure is the points it added to the 100-point composite (weight × sub-score).
- Cash flow +30.0/30.0
- 1% rule +10.0/10.0
- DSCR +10.0/10.0
- ARV discount +7.5/15.0
- Rent growth +2.5/5.0
- Livability +2.5/5.0
- Condition / age +2.5/5.0
- Schools +2.3/10.0
- Appreciation +0.0/10.0
$80,000
🖨 Deal sheet 📄 Offer letter ✓ Due diligence
Key facts
- 0.37 acre lot
- Garage
- Built 1953
Property features AI
Exterior
- Parking: Off-street parking; Detached garage (1 car); Main level parking
- Utilities: Septic tank sewer
- Home design: Detached property
- Construction: Vinyl siding; Block construction; Slab foundation; Built area approximately 728 (source: tax records)
- Exterior features: Irregular lot; Other view
Interior
- Kitchen: Appliances: Other
- Flooring: Laminate flooring; Carpeted areas
- Bathrooms: 1 full bathroom
- Heating & cooling: Central heating (electric); Central cooling
- Interior features: Eat-in kitchen; 4 total rooms
Neighborhood map
What this means for you Summary
Snapshot
- This is a 2-bed/1.0-bath single-family listed at $80k.
Deal economics
- At list price, monthly cash flow is $677 ($8k/yr) — positive.
- The deal already cash-flows at list — no discount required.
- Meets the 1% rule at list price ($1k rent vs $80k).
- Recommended offer: $70k (12.0% below list) — sets the bar for market timing.
Location & tenants
- Location reads: area grade B — affects rentability + tenant quality, not the cash-flow math above.
- Anderson County (town): math 25% / reading 28% proficiency, ranked #75 of 139 in TN (top 54%) — low school quality limits family demand, transient renter base, plan for 1-2y turnover.
- Zoned schools: Claxton Elementary (math 18% / reading 25%, grade F, #630 of 952 statewide, top 66%, 502 students, 0% FRL); Clinton Middle School (math 25% / reading 25%, grade F, #153 of 333 statewide, top 46%, 609 students, 0% FRL); Clinton High School (math 17% / reading 37%, grade F, #104 of 332 statewide, top 33%, 1,126 students, 0% FRL) — zoned schools average 0% FRL vs 49% district-wide (49 pts lower); this property's tenant base skews higher-income than the district average.
- Market conditions: 19 active listings in the ZIP; solid renter incomes; 400 units permitted in Anderson County in 2024 (91 in 5+ unit buildings).
Forward outlook
- Local home prices are declining (-3.0%/yr); year-one equity from $553 of loan paydown is wiped out by about $2k of value loss. Plan a longer hold.
- At projected returns (-3.0% appreciation + 3.0% rent growth), your $22k cash investment doubles in ~4 years — after that, you're playing with house money.
Negotiation context
- It's been on market 216 days — a 12% lower offer ($70k) is reasonable based on typical stale-listing flexibility.
- 2 sale attempts; this cycle's ask has dropped $20k (20%) from the opening price — seller is motivated, your offer sets the floor, not the list.
- Current owner paid $25k; list at $80k implies a 220% gain — meaningful room to come down on a strong offer.
Risks & watch-outs
- Watch-outs: built in 1953 — expect roof / HVAC / electrical / plumbing capex.
- Climate carrying-cost: moderate wildfire risk; extreme-heat days projected 7→19/yr by 2055 (HVAC capex compounding) — expect insurance premiums to compound above CPI over the hold.
Questions for the listing agent
- It's been on market 216 days. Have you received any prior offers? Is the seller open to a 12% concession, seller financing, or rate buy-down credit?
- Built in 1953 — when were the roof, HVAC, electrical panel, plumbing, and water heater last replaced?
- Why hasn't it sold? Are there any deal-killer items the seller is aware of (foundation, flood, title, zoning, code violations)?
- Is there a deadline driving the sale (1031 exchange, divorce, estate, relocation)? That informs how much negotiation room exists.
- What's the average days-on-market for RENTAL listings here right now (not sales)? A rising rental-DOM trend means longer vacancies and softer asking-rent achievability than the comps imply.
- What's the recent tenant-quality profile in this submarket — average credit score on applications, eviction rate, late-payment / NSF rate, and stable-employment percentage? A property-management company in the area should have these aggregated.
- How much new for-sale + rental construction is in the pipeline within 1–3 miles? Heavy new supply typically softens prices + rents 12–24 months out; constrained supply supports both.
Investment metrics
- 1% rule
- 1.84% ✓
- Cap rate
- 16.45%
- Cash-on-cash
- 36.29%
- DSCR
- 2.61
- GRM
- 4.5
CMA / ARV
No comps found within radius.
Projected returns pro-forma
-3.0% appreciation · 3.0% rent growth · sell at horizon
- IRR
- 32.0%
- Equity multiple
- 2.35×
- Total profit
- $30,160
- Equity at exit
- $11,928
- IRR
- 39.1%
- Equity multiple
- 4.65×
- Total profit
- $81,735
- Equity at exit
- $6,917
Cash invested: $22,400 (down + closing). Projections, not guarantees.
Landlord ↔ Tenant lean methodology
- Overall (STATE)
- 87 Strongly Landlord-Friendly
- State Tennessee
- 87 Strongly Landlord-Friendly · R+13
- County
- — inherits STATE
- City
- — inherits STATE
ZIP-level market 37849
- Home prices YoY
- -22.1%
- Active inventory
- 19
- Price-to-rent
- 4.5×
Monthly cashflow live
- Estimated rent
- $1,470 medium interval (Pro) →
- Mortgage (P&I)
- −$420
- Tax from tax record
- −$31 /mo · $369/yr
- Insurance
- −$33
- HOA
- −$0
- Vacancy / Maint / Mgmt
- −$309
- Net cashflow
- $677
Break-even live
UW: 25.0% down · 7.5% · 30yr · 1.5% tax · 5.0% vac · 8.0% maint · 8.0% mgmt
Financing live
Cash to close
- Down payment
- $20,000
- Closing costs
- $2,400
- Reserves months
- —
- Total cash needed
- —
Loan-product check · same deal, 3 products live
Conventional
25% down · 7.5% · 30yr
- Down + closing
- —
- Monthly P&I
- —
- Monthly cashflow
- —
- DSCR
- —
- Eligible?
- —
Personal DTI + credit; lowest rate.
DSCR
20% down · 8.5% · 30yr
- Down + closing
- —
- Monthly P&I
- —
- Monthly cashflow
- —
- DSCR
- —
- Eligible?
- —
No personal income docs; deal must DSCR.
Hard money
10% down · 12.0% · 12mo
- Down + closing
- —
- Monthly P&I
- —
- Monthly cashflow
- —
- DSCR
- —
- Eligible?
- —
Short-term bridge; refi at stabilization.
Listing history 23 events
-
2026-06-18days on market $80,000 Active 216 DOM
-
2026-06-17days on market $80,000 Active 215 DOM
-
2026-06-16days on market $80,000 Active 214 DOM
-
2026-06-15price $80,000 Active 213 DOM
-
2026-06-15days on market $90,000 Active 213 DOM
-
2026-06-14days on market $90,000 Active 211 DOM
-
2026-06-13days on market $90,000 Active 210 DOM
-
2026-06-10days on market $90,000 Active 208 DOM
-
2026-06-09days on market $90,000 Active 207 DOM
-
2026-06-08days on market $90,000 Active 206 DOM
-
2026-06-07days on market $90,000 Active 205 DOM
-
2026-06-03days on market $90,000 Active 201 DOM
-
2026-06-03status $90,000 Active 200 DOM
-
2026-06-02days on market $90,000 Pending - Continue to Show 200 DOM
-
2026-06-01days on market $90,000 Pending - Continue to Show 199 DOM
-
2026-05-31days on market $90,000 Pending - Continue to Show 198 DOM
-
2026-05-31days on market $90,000 Pending - Continue to Show 197 DOM
-
2026-01-18historical Pending - Continue to Show
-
2025-12-30status Active
-
2025-12-22historical Pending - Continue to Show
-
2025-12-07price $90,000
-
2025-11-14$100,000 Active
-
1999-02-01soldstatus $25,000
ⓘ Source: listings_history table (triggers on properties + properties_extension) + one-shot
backfill from property_details.listing_events for pre-trigger history.
Tax reassessment forecast TN · Resets to sale price
- Current annual tax
- $369 · $31/mo
- Projected year-2 tax
- $568 · $47/mo
- Expected delta
- +$199/yr (+$17/mo · 53.9%)
ⓘ Screening estimate from a state-policy table — verify with the county assessor before closing.
Climate risk First Street
- Flood 1/10 Low FEMA zone X (unshaded) · 0% chance over 30 yrs
- Wildfire 5/10 Major
- Heat 5/10 Major 7 d/yr ≥102°F today · 19 d/yr by 30 yrs out
- Wind 2/10 Low 100% chance of damaging wind over 30 yrs
- Air quality 3/10 Moderate 3 unhealthy d/yr today · 4 by 30 yrs out
Nearby sold comps map
Loading sold comps map…
Walkable amenities ~0.75 mi
Loading nearby amenities…
Taxation est. · year 1
- Rental income
- $17,636
- − Mortgage interest
- −$4,481
- − Property taxes
- −$369
- − Insurance
- −$400
- − Repairs & maintenance
- −$1,411
- − Management
- −$1,411
- − Depreciation
- −$2,327
- Taxable income
- $7,236
- Est. tax owed @ 24.0%
- −$1,737
- After-tax cash flow
- $6,392/yr
For passive investors: Depreciation is non-cash, so a rental often shows a tax loss while cash-flowing — sheltering income. Rental losses are passive: they offset passive income freely, and up to $25,000/yr can offset ordinary (W-2) income if you actively participate and your MAGI is under $100k (phasing out to $0 by $150k); unused losses carry forward. On sale, claimed depreciation is recaptured at up to 25%, and gains may owe capital-gains tax (a 1031 exchange can defer both). Figures are a year-1 estimate at your 24.0% rate — not tax advice; consult a CPA.
Schools (NCES district)
- District
- Anderson County
- NCES district ID
- 4700090
- Math proficiency
- 25% ▼ -11.00%
- Reading proficiency
- 28% ▼ -4.00%
- Median HH income
- $43,541
- Composite
- 22.68/100
- National rank
- #8043
- State rank
- #75 of 139 in TN
Livability — Powell
No livability data for this city. (Only ~50 U.S. cities are tracked.)
Census & demographics
- County
- Knox County · 473,959 people
- City population
- 29,375
- Metro
- Knoxville, TN
- Population (ZIP)
- 29,375
- Household income
- $84,275
- Rent vs Own
- Severe rent burden
- 398.0
Population outlook (Anderson County) Hauer SSP2
- Today (2025)
- 76,963 people
- By 2030
- 77,226 · +0.3%
- By 2040
- 76,905 · -0.1%
- By 2050
- 75,405 · -2.0%
- By 2075
- 70,858 · -7.9%
- By 2100
- 60,585 · -21.3%
Race, ethnicity, and origin ACS 2023
- Neighborhood character
- Predominantly White (89%)
- Race & ethnicity
- White 89% Hispanic / Latino 6% Two or more races 6% Black 3%
- Hispanic origin (detail)
- Mexican 3%
- Common ancestry
- Italian 3% Serbian 2% Slovak 2%
- Foreign-born
- 3% · Canada
- Languages at home
- 95% English-only · Spanish 5%
Political lean MEDSL · Anderson
- 2024 margin
- Solid R (+35.7) · D 31.5% · R 67.3% · Other 1.2%
- 2008→2024 swing
- -9.5pp toward R · 2008: -26.2pp · 2024: -35.7pp
- All cycles
- 2024: R+35.7 2020: R+32.2 2016: R+34.3 2012: R+29.8 2008: R+26.2
Not yet ingested
- Civics
- —
Market trends
- HPI YoY
- ▼ -92.10%
- Current HPI
- 325.6584
- Rent YoY
- —
- Metro
- Knoxville, TN
- State GDP YoY
- ▲ 2.78%
- F500 in state
- 22
Industry mix (Fortune 500 HQ in TN)
| Industry | F500 HQs | Revenue |
|---|---|---|
| Healthcare | 3 | $91B |
|
||
| Retail | 3 | $72B |
|
||
| Transportation / Logistics | 1 | $88B |
|
||
| Paper / Packaging | 1 | $19B |
|
||
| Insurance | 1 | $13B |
|
||
| Energy | 1 | $12B |
|
||
Price history
+260.0% since first listed6 events — show timeline
- 2026-01-18 Contingent — Knoxville MLS
- 2025-12-30 Relisted — Knoxville MLS
- 2025-12-22 Contingent — Knoxville MLS
- 2025-12-07 Price Changed $90,000 Knoxville MLS
- 2025-11-14 Listed $100,000 Knoxville MLS
- 1999-02-01 Sold (Public Records) $25,000 Public Records
Property tax history
+2.9%/yrLatest (2025): $369 · +37.7% YoY. Source: county tax records.
Cash-flow waterfall
monthlySold comps — $/sqft
last 12 mo · ≤1 miLoading sold comps…