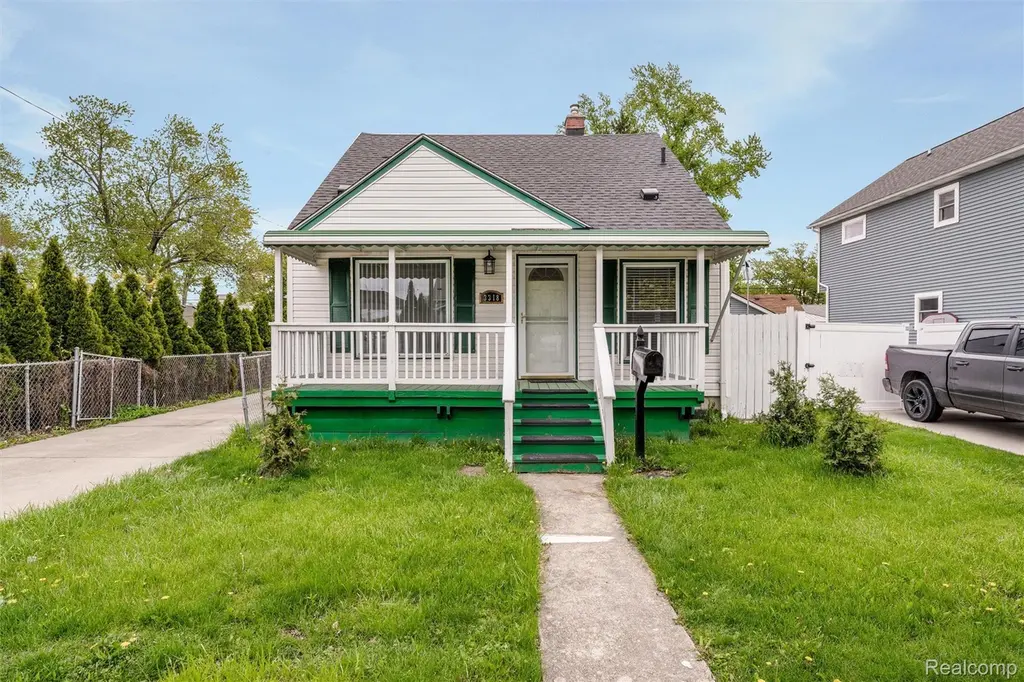
3318 Wakefield Rd · Berkley, MI
Flood risk 3/10 · Minor
- FEMA flood zone
- X (unshaded)
- Chance of flooding over 30 yrs
- 0.2%
- Est. flood insurance / yr
- $507 – $1,088
Fire risk 1/10 · Minimal
- Est. fire insurance / yr
- $784 – $1,456
Heat risk 2/10 · Minimal
- Hot days now (above 97°F)
- 7 days/yr
- Hot days in 30 yrs
- 15 days/yr
Wind risk 2/10 · Minimal
- Chance of severe wind over 30 yrs
- —
Air-quality risk 4/10 · Minor
- Unhealthy air days now
- 3 days/yr
- Unhealthy air days in 30 yrs
- 6 days/yr
Risk factors via First Street. Map © Google.
Why this score? — see what drove the D grade
The composite is a weighted blend of 9 inputs, each scored 0–100. Each bar is that input's sub-score; the figure is the points it added to the 100-point composite (weight × sub-score).
- ARV discount +12.7/15.0
- Cash flow +9.2/30.0
- Schools +4.9/10.0
- Livability +4.6/5.0
- DSCR +2.6/10.0
- Rent growth +2.5/5.0
- Condition / age +2.5/5.0
- 1% rule +2.3/10.0
- Appreciation +0.0/10.0
$254,900
🖨 Deal sheet 📄 Offer letter ✓ Due diligence
Listing remarks MLS
Charming 3-bedroom bungalow located just steps from the heart of downtown Berkley! This home features beautiful hardwood floors, newer windows, a brand-new furnace, and a new roof for added peace of mind. A full basement offers plenty of storage or additional living potential, while the detached garage adds extra convenience. Perfect for investors, flippers, or buyers ready to add their personal touch, this property is packed with opportunity to build equity in one of Berkley's most sought-after neighborhoods.
Key facts
- Full basement
- Close to dining
- Close to shopping
Tags
Property features AI
Exterior
- Parking: Detached 2-car garage
- Utilities: Public water; Public sewer
- Home design: Single-family residence; One level; Ground-level entry; Vinyl siding
- Construction: Block foundation
- Exterior features: Paved road access; Lot roughly 40 x 114 (0.1 acre)
Interior
- Bedrooms: 3 total rooms (includes bedrooms and living areas)
- Bathrooms: 1 full bathroom
- Heating & cooling: Forced air heating (natural gas); No central air
- Interior features: Unfinished basement
Neighborhood map
What this means for you Summary
Snapshot
- This is a 3-bed/1.0-bath single-family listed at $255k.
Deal economics
- At list price, monthly cash flow is $-192 ($-2k/yr) — negative.
- To cash-flow at today's rent, offer at most $221k (13.3% below list).
- To meet the 1% rule (rent ≥ 1% of price), the offer needs to be $187k (26.7% below list).
- Recommended offer: $187k (26.7% below list) — sets the bar for 1% rule.
- Cap rate 5.4% vs local median 4.0% in Berkley — top-decile yield for the area; either an underpriced asset or a hidden risk that comps aren't pricing in. Stress-test before assuming the spread holds.
Location & tenants
- Location reads 92/100 on livability (#1 in MI, #33 nationally) — a professional / high-income tenant draw. Strengths: schools A+, crime A+, commute A+.
- Berkley School District (suburban): math 47% / reading 62% proficiency, ranked #64 of 540 in MI (top 12%) — acceptable for families but not a draw, mixed tenant base, ~2y average lease; only 18% free/reduced lunch — higher-income household profile.
- Market conditions: 82 active listings in the ZIP; 23 comparable units currently listed for rent nearby; rentals at typical pace (median 25d on market — plan ~3-4 weeks tenant-placement turnaround); high-income renter base; 2,614 units permitted in Oakland County in 2024 (721 in 5+ unit buildings).
Forward outlook
- Local home prices are declining (-3.0%/yr); year-one equity from $2k of loan paydown is wiped out by about $8k of value loss. Plan a longer hold.
- Oakland County population projected at +10% by 2050 — modest demand growth; plan on rents tracking national, not racing it.
Negotiation context
- It's been on market 16 days — a 2% lower offer ($251k) is reasonable based on typical stale-listing flexibility.
- 2 sale attempts with the ask held roughly flat each time — persistent listings suggest the price (not the market) is what's stuck; bring a comps-based counter.
Risks & watch-outs
- Watch-outs: built in 1951 — expect roof / HVAC / electrical / plumbing capex.
Questions for the listing agent
- What do current leases actually rent for vs. the listed asking? Can we see a recent rent roll and the last 12 months of T-12 income?
- Built in 1951 — when were the roof, HVAC, electrical panel, plumbing, and water heater last replaced?
- Is there a deadline driving the sale (1031 exchange, divorce, estate, relocation)? That informs how much negotiation room exists.
- Schools are A-rated — typically a magnet for longer-tenancy family renters. What's the average tenant stay here, and is there a school-zone premium baked into asking?
- The area grade is low — what's the realistic commute time and amenity access for the typical tenant pool here? Any planned neighborhood developments (good or bad) we should know about?
- What's the average days-on-market for RENTAL listings here right now (not sales)? A rising rental-DOM trend means longer vacancies and softer asking-rent achievability than the comps imply.
- What's the recent tenant-quality profile in this submarket — average credit score on applications, eviction rate, late-payment / NSF rate, and stable-employment percentage? A property-management company in the area should have these aggregated.
- How much new for-sale + rental construction is in the pipeline within 1–3 miles? Heavy new supply typically softens prices + rents 12–24 months out; constrained supply supports both.
Investment metrics
- 1% rule
- 0.73% ✗
- Cap rate
- 5.39%
- Cash-on-cash
- -3.23%
- DSCR
- 0.86
- GRM
- 11.4
CMA / ARV
- ARV (median comp)
- $288,502
- List price
- $254,900
- Delta
- -11.65%
- Verdict
- UNDERPRICED
- Comps
- 20 within 1.0 mi
Show comp detail 12 sales within ~0.75 mi
| Address | Dist | Beds/Ba | Sqft | Sold | Price | $/sf | Match |
|---|---|---|---|---|---|---|---|
| 3318 Wakefield Rd | 0.00mi | 3/1.0 | 968 (0%) | 0mo | $242,500 | $251 | 100 |
| 3714 Robina Ave | 0.25mi | 3/1.0 | 1,000 (+3%) | 2mo | $300,000 | $300 | 81 |
| 2380 Wiltshire Rd Rd | 0.37mi | 3/1.0 | 945 (-2%) | 1mo | $165,000 | $175 | 78 |
| 2828 Robina Ave | 0.31mi | 3/1.0 | 1,036 (+7%) | 3mo | $305,000 | $294 | 72 |
| 2616 Kenmore Rd | 0.46mi | 3/1.0 | 924 (-4%) | 3mo | $230,000 | $249 | 68 |
| 3170 Tyler Ave | 0.24mi | 2/1.0 (-1) | 887 (-8%) | 3mo | $185,500 | $209 | 68 |
| 3414 W Webster Rd | 0.58mi | 3/1.5 | 1,008 (+4%) | 1mo | $305,000 | $303 | 63 |
| 3626 Prairie Ave | 0.58mi | 2/2.0 (-1) | 976 (+1%) | 2mo | $279,900 | $287 | 61 |
| 3819 Royal Ave | 0.47mi | 3/1.0 | 1,054 (+9%) | 4mo | $284,500 | $270 | 60 |
| 4056 Robina Ave | 0.43mi | 3/1.0 | 1,111 (+15%) | 3mo | $218,360 | $197 | 53 |
| 2330 Buckingham Ave | 0.65mi | 3/1.0 | 1,053 (+9%) | 3mo | $215,000 | $204 | 52 |
| 2893 Harvard Rd | 0.74mi | 3/1.0 | 1,099 (+14%) | 2mo | $345,000 | $314 | 42 |
Match score weights: distance 35% · size 25% · config 20% · recency 20%. Top-matched comps best support the ARV.
Projected returns pro-forma
-3.0% appreciation · 3.0% rent growth · sell at horizon
- IRR
- -21.7%
- Equity multiple
- 0.25×
- Total profit
- $-53,574
- Equity at exit
- $38,006
- IRR
- -15.5%
- Equity multiple
- 0.12×
- Total profit
- $-62,532
- Equity at exit
- $22,039
Cash invested: $71,372 (down + closing). Projections, not guarantees.
Landlord ↔ Tenant lean methodology
- Overall (STATE)
- 62 Landlord-Friendly
- State Michigan
- 62 Landlord-Friendly · EVEN
- County
- — inherits STATE
- City
- — inherits STATE
ZIP-level market 48072
- Active inventory
- 82
- Price-to-rent
- 11.4×
Monthly cashflow live
- Estimated rent
- $1,867 high interval (Pro) →
- Mortgage (P&I)
- −$1,337
- Tax from tax record
- −$224 /mo · $2,693/yr
- Insurance
- −$106
- HOA
- −$0
- Vacancy / Maint / Mgmt
- −$392
- Net cashflow
- $-192
Break-even live
UW: 25.0% down · 7.5% · 30yr · 1.5% tax · 5.0% vac · 8.0% maint · 8.0% mgmt
Financing live
Cash to close
- Down payment
- $63,725
- Closing costs
- $7,647
- Reserves months
- —
- Total cash needed
- —
Loan-product check · same deal, 3 products live
Conventional
25% down · 7.5% · 30yr
- Down + closing
- —
- Monthly P&I
- —
- Monthly cashflow
- —
- DSCR
- —
- Eligible?
- —
Personal DTI + credit; lowest rate.
DSCR
20% down · 8.5% · 30yr
- Down + closing
- —
- Monthly P&I
- —
- Monthly cashflow
- —
- DSCR
- —
- Eligible?
- —
No personal income docs; deal must DSCR.
Hard money
10% down · 12.0% · 12mo
- Down + closing
- —
- Monthly P&I
- —
- Monthly cashflow
- —
- DSCR
- —
- Eligible?
- —
Short-term bridge; refi at stabilization.
Rent comps 23 comps
| Address | Beds | Baths | Sqft | Rent | $/sqft | DOM | Units | Dist |
|---|---|---|---|---|---|---|---|---|
| 3185 Buckingham Ave Berkley, MI | 3.0 | 1.0 | 1091 | $1,895 | $1.74 | 24d | 1 | 0.31mi |
| 2575 Catalpa Dr Unit 2575-16 Berkley, MI | 2.0 | 1.0 | 1100 | $1,495 | $1.36 | 24d | 1 | 0.47mi |
| 2575 Catalpa Dr Unit 2575-06 Berkley, MI | 2.0 | 2.0 | 1100 | $1,695 | $1.54 | 24d | 1 | 0.47mi |
| 3936 Royal Ave Berkley, MI | 3.0 | 2.0 | 900 | $2,000 | $2.22 | 43d | 1 | 0.52mi |
| 2639 Oxford Rd Berkley, MI | 2.0 | 1.0 | 1010 | $2,495 | $2.47 | 1d | 1 | 0.63mi |
| 2200 Berkley Ave Apt 102 Berkley, MI | 2.0 | 1.0 | 900 | $1,340 | $1.49 | 24d | 1 | 0.75mi |
| 3644 Greenfield Rd Unit 3664 Greenfield Berkley, MI | 2.0 | 1.5 | 950 | $1,700 | $1.79 | 18d | 1 | 0.79mi |
| 28124 Brentwood St Southfield, MI | 3.0 | 1.0 | 1056 | $1,800 | $1.70 | 24d | 1 | 0.87mi |
| 3264 Coolidge Hwy Royal Oak, MI | 2.0 | 1.0 | 916 | $1,600 | $1.75 | 5d | 1 | 0.91mi |
| 3282 Coolidge Hwy Royal Oak, MI | 2.0 | 1.0 | 916 | $1,650 | $1.80 | 24d | 1 | 0.93mi |
| 3009 W 13 Mile Rd Royal Oak, MI | 1.0–2.0 | 1.0 | 730 | $1,599 | $2.19 | 3d | 31 | 1.13mi |
| 29890 Everett St Southfield, MI | 3.0 | 1.5 | 1100 | $2,200 | $2.00 | 43d | 1 | 1.13mi |
| 2817 W 13 Mile Rd Royal Oak, MI | 2.0 | 1.0 | 688 | $1,250 | $1.82 | 24d | 1 | 1.18mi |
| 4030 W 13 Mile Rd Unit J2 Royal Oak, MI | 2.0 | 1.0 | 724 | $1,450 | $2.00 | 18d | 1 | 1.22mi |
| 4030 W 13 Mile Rd Unit J2 Royal Oak, MI | 2.0 | 1.0 | 724 | $1,450 | $2.00 | 20d | 1 | 1.22mi |
| 4030 W 13 Mile Rd Unit J2 Royal Oak, MI | 2.0 | 1.0 | 724 | $1,600 | $2.21 | 24d | 1 | 1.22mi |
| 4000 W 13 Mile Rd Royal Oak, MI | 2.0 | 1.0 | 780 | $1,444 | $1.85 | 2d | 3 | 1.22mi |
| 3220 Shenandoah Dr #12 Royal Oak, MI | 2.0 | 1.0 | 688 | $1,250 | $1.82 | 24d | 1 | 1.24mi |
| 4120 W 13 Mile Rd Royal Oak, MI | 1.0–2.0 | 1.0 | 775 | $1,300 | $1.68 | 2d | 5 | 1.25mi |
| 3225 Benjamin Ave #2 Royal Oak, MI | 2.0 | 1.0 | 800 | $1,525 | $1.91 | 5d | 1 | 1.26mi |
| 15833 W Eleven Mile Rd Southfield, MI | 1.0–2.0 | 1.0 | 905 | $1,424 | $1.57 | 2d | 6 | 1.36mi |
| 1607 Catalpa Dr Unit 1607 Catalpa Royal Oak, MI | 2.0 | 1.0 | 950 | $2,100 | $2.21 | 24d | 1 | 1.38mi |
| 3406 Elmhurst Ave Royal Oak, MI | 2.0 | 1.0 | 950 | $1,800 | $1.89 | 24d | 1 | 1.46mi |
Listing history 2 events
-
2026-05-12$264,900 Active 521-char remark
Show marketing remark (515 chars)
Charming 3-bedroom bungalow located just steps from the heart of downtown Berkley! This home features beautiful hardwood floors, newer windows, a brand-new furnace, and a new roof for added peace of mind. A full basement offers plenty of storage or additional living potential, while the detached garage adds extra convenience. Perfect for investors, flippers, or buyers ready to add their personal touch, this property is packed with opportunity to build equity in one of Berkley's most sought-after neighborhoods.
-
2026-05-12$264,900 Active 515-char remark
Show marketing remark (515 chars)
Charming 3-bedroom bungalow located just steps from the heart of downtown Berkley! This home features beautiful hardwood floors, newer windows, a brand-new furnace, and a new roof for added peace of mind. A full basement offers plenty of storage or additional living potential, while the detached garage adds extra convenience. Perfect for investors, flippers, or buyers ready to add their personal touch, this property is packed with opportunity to build equity in one of Berkley's most sought-after neighborhoods.
ⓘ Source: listings_history table (triggers on properties + properties_extension) + one-shot
backfill from property_details.listing_events for pre-trigger history.
Tax reassessment forecast MI · Partial reset (capped growth)
- Current annual tax
- $2,693 · $224/mo
- Projected year-2 tax
- $3,309 · $276/mo
- Expected delta
- +$616/yr (+$51/mo · 22.9%)
ⓘ Screening estimate from a state-policy table — verify with the county assessor before closing.
Climate risk First Street
- Flood 3/10 Moderate FEMA zone X (unshaded) · 20% chance over 30 yrs
- Wildfire 1/10 Low
- Heat 2/10 Low 7 d/yr ≥97°F today · 15 d/yr by 30 yrs out
- Wind 2/10 Low
- Air quality 4/10 Moderate 3 unhealthy d/yr today · 6 by 30 yrs out
Nearby sold comps map
Loading sold comps map…
Walkable amenities ~0.75 mi
Loading nearby amenities…
Taxation est. · year 1
- Rental income
- $22,408
- − Mortgage interest
- −$14,278
- − Property taxes
- −$2,693
- − Insurance
- −$1,274
- − Repairs & maintenance
- −$1,793
- − Management
- −$1,793
- − Depreciation
- −$7,415
- Taxable loss
- −$6,839
- Est. tax savings @ 24.0%
- +$1,641
- After-tax cash flow
- $-665/yr
For passive investors: Depreciation is non-cash, so a rental often shows a tax loss while cash-flowing — sheltering income. Rental losses are passive: they offset passive income freely, and up to $25,000/yr can offset ordinary (W-2) income if you actively participate and your MAGI is under $100k (phasing out to $0 by $150k); unused losses carry forward. On sale, claimed depreciation is recaptured at up to 25%, and gains may owe capital-gains tax (a 1031 exchange can defer both). Figures are a year-1 estimate at your 24.0% rate — not tax advice; consult a CPA.
Schools (NCES district)
- District
- Berkley School District
- NCES district ID
- 2605010
- Math proficiency
- 47% ▼ -10.00%
- Reading proficiency
- 62% ▼ -3.00%
- Median HH income
- $72,519
- Composite
- 48.61/100
- National rank
- #2109
- State rank
- #64 of 540 in MI
Livability — Berkley
- Score
- 92/100
- State rank
- #1
- US rank
- #33
Category grades
Schools grade is shown separately in the Schools card above.
Census & demographics
- Census place
- Berkley, MI
- County
- Oakland County · 1,009,092 people
- City population
- 15,149
- Metro
- Detroit-Warren-Dearborn, MI
- Population (ZIP)
- 15,149
- Household income
- $116,239
- Rent vs Own
- Severe rent burden
- 127.0
Population outlook (Oakland County) Hauer SSP2
- Today (2025)
- 1,335,747 people
- By 2030
- 1,375,100 · +2.9%
- By 2040
- 1,435,385 · +7.5%
- By 2050
- 1,469,250 · +10.0%
- By 2075
- 1,531,946 · +14.7%
- By 2100
- 1,450,485 · +8.6%
Race, ethnicity, and origin ACS 2023
- Neighborhood character
- Predominantly White (86%)
- Race & ethnicity
- White 86% Two or more races 8% Hispanic / Latino 3% Black 2%
- Common ancestry
- Romanian 12% Lithuanian 4% Slovak 4%
- Foreign-born
- 3% · Canada
- Languages at home
- 96% English-only · Other Indo-European 1% Spanish 1% Russian/Polish/Slavic 1%
Political lean MEDSL · Oakland
- 2024 margin
- D (+10.6) · D 54.4% · R 43.8% · Other 1.9%
- 2008→2024 swing
- -3.9pp toward R · 2008: 14.5pp · 2024: 10.6pp
- All cycles
- 2024: D+10.6 2020: D+14.1 2016: D+8.1 2012: D+8.1 2008: D+14.5
Not yet ingested
- Civics
- —
Market trends
- HPI YoY
- ▼ -502.41%
- Current HPI
- 225.7389
- Rent YoY
- —
- Metro
- Detroit-Warren-Dearborn, MI
- State GDP YoY
- ▲ 1.37%
- F500 in state
- 28
Industry mix (Fortune 500 HQ in MI)
| Industry | F500 HQs | Revenue |
|---|---|---|
| Automotive Parts | 3 | $48B |
|
||
| Automotive | 2 | $372B |
|
||
| Chemicals | 1 | $45B |
|
||
| Automotive Retail | 1 | $29B |
|
||
| Healthcare / Medical Devices | 1 | $23B |
|
||
| Automotive Technology | 1 | $20B |
|
||
Price history
+18.3% since first listed9 events — show timeline
- 2026-06-08 Sold (MLS) $242,500 REALCOMP
- 2026-06-08 Sold (MLS) $242,500 MiRealSource-MiMLS
- 2026-05-28 Pending — MiRealSource-MiMLS
- 2026-05-28 Pending — REALCOMP
- 2026-05-20 Price Changed $254,900 MiRealSource-MiMLS
- 2026-05-20 Price Changed $254,900 REALCOMP
- 2026-05-12 Listed $264,900 REALCOMP
- 2026-05-12 Listed $264,900 MiRealSource-MiMLS
- 2026-05-06 Sold (Public Records) $205,000 Public Records
Property tax history
+3.7%/yrLatest (2025): $2,693 · +2.4% YoY. Source: county tax records.
Cash-flow waterfall
monthlySold comps — $/sqft
last 12 mo · ≤1 miLoading sold comps…