2145 Pierce St #421 · Hollywood, FL
Flood risk No data
- FEMA flood zone
- —
- Chance of flooding over 30 yrs
- —
- Est. flood insurance / yr
- —
Fire risk No data
- Est. fire insurance / yr
- —
Heat risk No data
- Hot days now (above threshold)
- —
- Hot days in 30 yrs
- —
Wind risk No data
- Chance of severe wind over 30 yrs
- —
Air-quality risk No data
- Unhealthy air days now
- —
- Unhealthy air days in 30 yrs
- —
Risk factors via First Street. Map © Google.
Why this score? — see what drove the C+ grade
The composite is a weighted blend of 9 inputs, each scored 0–100. Each bar is that input's sub-score; the figure is the points it added to the 100-point composite (weight × sub-score).
- Cash flow +25.5/30.0
- 1% rule +10.0/10.0
- DSCR +8.5/10.0
- ARV discount +7.5/15.0
- Schools +4.1/10.0
- Livability +3.8/5.0
- Rent growth +2.6/5.0
- Condition / age +2.5/5.0
- Appreciation +0.0/10.0
$129,999
🖨 Deal sheet (PDF) 📄 Offer letter ✓ Due diligence
Listing remarks
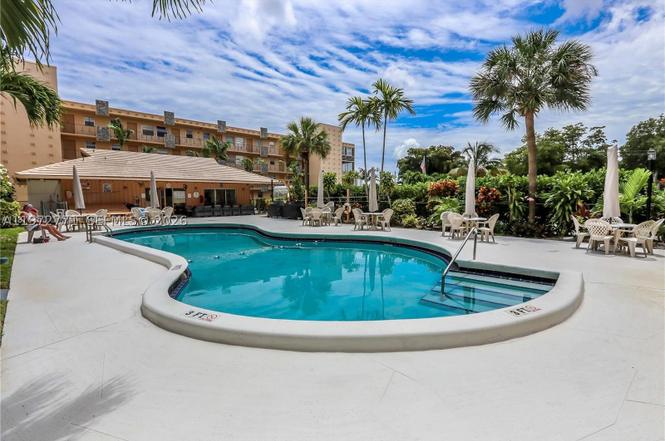
Well managed 55+ Bldg. has passed 40 Yr & 50 year inspections. LOW MAINTENANCE FEE. Building will have ALL IMPACT WINDOWS IN March. No outstanding assessments & none expected. 55+ community. Freshly painted & Immaculate Spacious 2/1 Condo. Kitchen has lots of cabinet space. Entire unit has the same beautiful ceramic tile floors that flows thru every room. Excellent location, walking distance of downtown Hollywood, and minutes to the beach and the famous boardwalk. Clubhouse w/ BBQ are and heated pool. Very friendly community and & well managed community. ROOF ASSESSMENTS PAID BY SELLER. No Pets. RENT RESTRICTION: No rent first year owned, 2 mos. min ~ max 6 months an
Key facts
- Excellent location
- Heated pool
- Impact windows
Tags
Property features AI
Finance
- Financial info: Pets not allowed
- HOA & community: Monthly association fee of $389 covering common areas; Community amenities: Clubhouse, Laundry, Pool, Storage, Trash service, Elevators; 133 units in community; Senior community
Exterior
- Parking: Carport (1 space); One covered parking space
- Utilities: Cable available
- Home design: Attached property; 4-story building; Entry on level 4
- Construction: Block construction; Resale property
- Exterior features: Courtyard; Heated pool
Interior
- Kitchen: Electric range; Refrigerator
- Bedrooms: Bedroom located on the main level
- Flooring: Tile
- Bathrooms: 1 full bathroom
- Heating & cooling: Central heating; Central air conditioning
- Interior features: Unfurnished; First floor entry; Bedroom on main level; Tile flooring
- Laundry & utility: Common area laundry
Neighborhood map
What this means for you Summary
Snapshot
- This is a 2-bed/1.0-bath condo listed at $130k.
Deal economics
- At list price, monthly cash flow is $305 ($4k/yr) — positive.
- The deal already cash-flows at list — no discount required.
- Meets the 1% rule at list price ($2k rent vs $130k).
- Recommended offer: $118k (9.0% below list) — sets the bar for market timing.
- Cap rate 9.1% vs local median 3.2% in Hollywood — top-decile yield for the area; either an underpriced asset or a hidden risk that comps aren't pricing in. Stress-test before assuming the spread holds.
Location & tenants
- Location reads 76/100 on livability (#232 in FL, #3,548 nationally) — a middle-class / working-renter tenant base. Strengths: commute A+, housing A+, crime B+; Watch: amenities D.
- Broward (suburban): math 42% / reading 53% proficiency, ranked #46 of 73 in FL (top 63%) — families likely to look elsewhere, expect single-tenant / working-renter base with shorter leases.
- Market conditions: Rents flat; 590 active listings in the ZIP; 40 comparable units currently listed for rent nearby; rentals at typical pace (median 19d on market — plan ~3-4 weeks tenant-placement turnaround); 2,111 units permitted in Broward County in 2024 (1,265 in 5+ unit buildings).
- This rent runs 44% of the median local income ($56k/yr) — at the standard rent-burdened threshold; future hikes will face affordability resistance.
Forward outlook
- Local home prices are declining (-3.0%/yr); year-one equity from $899 of loan paydown is wiped out by about $4k of value loss. Plan a longer hold.
- Broward County population projected at +34% by 2050 — long-run rental-demand tailwind backs the buy-and-hold thesis.
Negotiation context
- It's been on market 113 days — a 9% lower offer ($118k) is reasonable based on typical stale-listing flexibility.
- 5 sale attempts since 3y ago with the ask held roughly flat each time — persistent listings suggest the price (not the market) is what's stuck; bring a comps-based counter.
- Current owner paid $38k; list at $130k implies a 242% gain — meaningful room to come down on a strong offer.
Questions for the listing agent
- It's been on market 113 days. Have you received any prior offers? Is the seller open to a 9% concession, seller financing, or rate buy-down credit?
- Built in 1969 — when were the roof, HVAC, electrical panel, plumbing, and water heater last replaced?
- What does the HOA fee cover, when was the last increase, and are there any pending special assessments or reserve-fund shortfalls?
- Any open or pending special assessments — roof, HVAC, plumbing, elevator, façade? What's the per-unit balance and payoff schedule, and is the seller paying it off at close or rolling it to the buyer?
- Why hasn't it sold? Are there any deal-killer items the seller is aware of (foundation, flood, title, zoning, code violations)?
- Is there a deadline driving the sale (1031 exchange, divorce, estate, relocation)? That informs how much negotiation room exists.
- What's the average days-on-market for RENTAL listings here right now (not sales)? A rising rental-DOM trend means longer vacancies and softer asking-rent achievability than the comps imply.
- What's the recent tenant-quality profile in this submarket — average credit score on applications, eviction rate, late-payment / NSF rate, and stable-employment percentage? A property-management company in the area should have these aggregated.
- How much new apartment / multifamily construction is in the pipeline within 1–3 miles? Heavy new supply (>2% of stock underway) typically softens rents 12–24 months out; light construction supports rent growth.
Investment metrics
- 1% rule
- 1.61% ✓
- Cap rate
- 9.10%
- Cash-on-cash
- 10.04%
- DSCR
- 1.45
- GRM
- 5.2
CMA / ARV
No comps found within radius.
Projected returns pro-forma
-3.0% appreciation · 0.43% rent growth · sell at horizon
- IRR
- -5.1%
- Equity multiple
- 0.82×
- Total profit
- $-6,638
- Equity at exit
- $19,383
- IRR
- -0.1%
- Equity multiple
- 1.00×
- Total profit
- $-122
- Equity at exit
- $11,240
Cash invested: $36,400 (down + closing). Projections, not guarantees.
Landlord ↔ Tenant lean methodology
- Overall (STATE)
- 87 Strongly Landlord-Friendly
- State Florida
- 87 Strongly Landlord-Friendly · R+3
- County
- — inherits STATE
- City
- — inherits STATE
ZIP-level market 33020
- Rents YoY
- 0.4%
- Active inventory
- 590
- Price-to-rent
- 5.2×
Monthly cashflow live
- Estimated rent
- $2,093 high interval (Pro) →
- Mortgage (P&I)
- −$682
- Tax from tax record
- −$224 /mo · $2,693/yr
- Insurance
- −$54
- HOA
- −$389
- Vacancy / Maint / Mgmt
- −$440
- Net cashflow
- $305
Break-even live
Sensitivity live
| Price | -10% $378 | -5% $341 | +0% $305 | +5% $268 | +10% $231 |
|---|---|---|---|---|---|
| Rent | -10% $139 | -5% $222 | +0% $305 | +5% $387 | +10% $470 |
| Rate | -1.0pp $370 | -0.5pp $338 | base $305 | +0.5pp $271 | +1.0pp $237 |
UW: 25.0% down · 7.5% · 30yr · 1.5% tax · 5.0% vac · 8.0% maint · 8.0% mgmt
Financing live
Cash to close
- Down payment
- $32,500
- Closing costs
- $3,900
- Reserves months
- —
- Total cash needed
- —
Loan-product check · same deal, 3 products live
Conventional
25% down · 7.5% · 30yr
- Down + closing
- —
- Monthly P&I
- —
- Monthly cashflow
- —
- DSCR
- —
- Eligible?
- —
Personal DTI + credit; lowest rate.
DSCR
20% down · 8.5% · 30yr
- Down + closing
- —
- Monthly P&I
- —
- Monthly cashflow
- —
- DSCR
- —
- Eligible?
- —
No personal income docs; deal must DSCR.
Hard money
10% down · 12.0% · 12mo
- Down + closing
- —
- Monthly P&I
- —
- Monthly cashflow
- —
- DSCR
- —
- Eligible?
- —
Short-term bridge; refi at stabilization.
Rent comps 40 comps
| Address | Beds | Baths | Sqft | Rent | $/sqft | DOM | Units | Dist |
|---|---|---|---|---|---|---|---|---|
| 2233 Hollywood Blvd Hollywood, FL | 1.0–2.0 | 1.0–2.0 | 913 | $3,515 | $3.85 | 16d | 94 | 0.39mi |
| 2165 Van Buren St Hollywood, FL | 3.0 | 1.0–3.0 | 1072 | $3,609 | $3.37 | 0d | 15 | 0.44mi |
| 2204 McKinley St #2 Hollywood, FL | 1.0 | 1.0 | 635 | $1,850 | $2.91 | 18d | 1 | 0.49mi |
| 2204 McKinley St #2 Hollywood, FL | 1.0 | 1.0 | 635 | $1,800 | $2.83 | 2d | 1 | 0.49mi |
| 1818 Hollywood Blvd Hollywood, FL | 3.0 | 1.0–2.5 | 1089 | $4,166 | $3.83 | 0d | 26 | 0.56mi |
| 2001 Van Buren St Hollywood, FL | 2.0 | 1.0–2.0 | 788 | $3,599 | $4.57 | 16d | 171 | 0.56mi |
| 1521 N 23rd Ave Hollywood, FL | 2.0 | 2.0 | 750 | $2,000 | $2.67 | 25d | 1 | 0.56mi |
| 2443 Cleveland St Unit 2 Hollywood, FL | 1.0 | 1.0 | 600 | $1,500 | $2.50 | 25d | 1 | 0.58mi |
| 2111 Roosevelt St Unit 3 Hollywood, FL | 1.0 | 1.0 | 600 | $1,425 | $2.38 | 25d | 1 | 0.58mi |
| 1776 Polk St Hollywood, FL | 1.0–2.0 | 1.0–2.0 | 954 | $3,598 | $3.77 | 16d | 25 | 0.59mi |
| 1944 Taft St Unit 2 Hollywood, FL | 2.0 | 2.0 | 750 | $1,800 | $2.40 | 9d | 1 | 0.67mi |
| 2619 Arthur St Unit 3 Hollywood, FL | 1.0 | 1.0 | 450 | $1,280 | $2.84 | 25d | 1 | 0.69mi |
| 1947 Taft St Unit 0 Hollywood, FL | 2.0 | 2.0 | 650 | $1,900 | $2.92 | 25d | 1 | 0.69mi |
| 1815 McKinley St Unit 9 Hollywood, FL | 2.0 | 1.0 | 650 | $1,750 | $2.69 | 18d | 1 | 0.70mi |
| 1770 S Young Cir Hollywood, FL | 2.0 | 1.0–2.0 | 881 | $4,768 | $5.41 | 3d | 42 | 0.73mi |
| 320 S Federal Hwy Hollywood, FL | 2.0 | 1.0–2.0 | 742 | $3,616 | $4.87 | 25d | 9 | 0.74mi |
| 303 S Federal Hwy Hollywood, FL | 1.0–3.0 | 1.0–3.0 | 992 | $2,932 | $2.95 | 3d | 35 | 0.75mi |
| 1710 McKinley St #5 Hollywood, FL | 1.0 | 1.0 | 573 | $1,450 | $2.53 | 20d | 1 | 0.75mi |
| 1710 McKinley St #5 Hollywood, FL | 1.0 | 1.0 | 573 | $1,400 | $2.44 | 25d | 1 | 0.75mi |
| 1816 Taft St Unit 8 Hollywood, FL | 1.0 | 1.0 | 500 | $1,399 | $2.80 | 4d | 1 | 0.76mi |
| 2806 Taylor St Apt C Hollywood, FL | 2.0 | 2.0 | 650 | $2,295 | $3.53 | 25d | 1 | 0.83mi |
| 2806 Taylor St Apt C Hollywood, FL | 2.0 | 2.0 | 650 | $2,295 | $3.53 | 9d | 1 | 0.83mi |
| 2830 Fillmore St Unit 2 Hollywood, FL | 1.0 | 1.0 | 750 | $1,450 | $1.93 | 9d | 1 | 0.87mi |
| 2830 Fillmore St Unit 5 Hollywood, FL | 1.0 | 1.0 | 700 | $1,450 | $2.07 | 25d | 1 | 0.87mi |
| 1533 Cleveland St Hollywood, FL | 1.0 | 1.0 | 512 | $1,200 | $2.34 | 25d | 1 | 0.89mi |
| 2840 Taylor St #28 Hollywood, FL | 1.0 | 1.0 | 560 | $1,800 | $3.21 | 25d | 1 | 0.90mi |
| 1560 McKinley St Unit 115w Hollywood, FL | 1.0 | 1.5 | 665 | $1,500 | $2.26 | 4d | 1 | 0.91mi |
| 2910 Pierce St Unit P102 Hollywood, FL | 1.0 | 1.0 | 700 | $1,595 | $2.28 | 25d | 1 | 0.93mi |
| 2843 Fillmore St Hollywood, FL | 1.0–2.0 | 1.0 | 800 | $2,095 | $2.62 | 25d | 1 | 0.93mi |
| 2847 Fillmore St Hollywood, FL | 1.0 | 1.0 | 700 | $1,600 | $2.29 | 3d | 1 | 0.95mi |
| 2630 Madison St Unit b Hollywood, FL | 1.0 | 1.0 | 400 | $1,500 | $3.75 | 25d | 1 | 0.95mi |
| 2630 Madison St Hollywood, FL | 1.0 | 1.0 | 400 | $1,500 | $3.75 | 25d | 1 | 0.95mi |
| 1958 Liberty St Hollywood, FL | 1.0 | 1.0 | 3837 | $1,469 | $0.38 | 4d | 2 | 0.96mi |
| 2851 Fillmore St Unit 507 Hollywood, FL | 1.0 | 1.0 | 600 | $1,600 | $2.67 | 0d | 1 | 0.96mi |
| 1520 McKinley St Unit 107E Hollywood, FL | 1.0 | 1.5 | 665 | $1,700 | $2.56 | 18d | 1 | 0.97mi |
| 2118 N 19th Ave Unit 1-4 Hollywood, FL | 2.0 | 1.0 | 650 | $1,690 | $2.60 | 4d | 1 | 0.99mi |
| 1425 Arthur St Unit 414B Hollywood, FL | 1.0 | 1.5 | 597 | $1,750 | $2.93 | 20d | 1 | 1.01mi |
| 1930 Thomas St Unit 1930 Hollywood, FL | 1.0 | 1.0 | 600 | $1,450 | $2.42 | 25d | 1 | 1.03mi |
| 1913 Thomas St Hollywood, FL | 1.0 | 1.0 | 600 | $1,600 | $2.67 | 20d | 1 | 1.08mi |
| 2815 Madison St Hollywood, FL | 1.0 | 1.0 | 400 | $1,200 | $3.00 | 0d | 1 | 1.09mi |
HOA detail condo
- Monthly dues
- $389 · $4,668/yr
- Likely covers
- pool
- Assessments
- None detected in remarks — confirm with the listing agent.
Listing history 26 events
-
2026-06-21days on market $129,999 Active 113 DOM
-
2026-06-18days on market $129,999 Active 110 DOM
-
2026-06-17days on market $129,999 Active 109 DOM
-
2026-06-16days on market $129,999 Active 108 DOM
-
2026-06-15days on market $129,999 Active 107 DOM
-
2026-06-13days on market $129,999 Active 105 DOM
-
2026-06-09days on market $129,999 Active 101 DOM
-
2026-06-07days on market $129,999 Active 99 DOM
-
2026-06-04days on market $129,999 Active 96 DOM
-
2026-06-03days on market $129,999 Active 95 DOM
-
2026-06-02days on market $129,999 Active 94 DOM
-
2026-06-01days on market $129,999 Active 93 DOM
-
2026-05-31days on market $129,999 Active 92 DOM
-
2026-02-28$129,999 Active
-
2026-02-25historical
-
2025-08-25$139,999 Active
-
2025-08-25historical
-
2025-05-22price $139,999
-
2025-02-25$149,999 Active
-
2025-02-06historical
-
2024-08-06$149,999 Active
-
2024-08-06historical
-
2023-09-08$160,000 Active
-
2013-06-25soldstatus $38,000
-
2003-03-13soldstatus $38,000
-
1996-04-11soldstatus $29,000
ⓘ Source: listings_history table (triggers on properties + properties_extension) + one-shot
backfill from property_details.listing_events for pre-trigger history.
Tax reassessment forecast FL · Resets to sale price
- Current annual tax
- $2,693 · $224/mo
- Projected year-2 tax
- $2,693 · $224/mo
- Expected delta
- $0/yr ($0/mo · 0.0%)
ⓘ Screening estimate from a state-policy table — verify with the county assessor before closing.
Nearby sold comps map
Loading sold comps map…
Walkable amenities ~0.75 mi
Loading nearby amenities…
Taxation est. · year 1
- Rental income
- $25,122
- − Mortgage interest
- −$7,282
- − Property taxes
- −$2,693
- − Insurance
- −$650
- − Repairs & maintenance
- −$2,010
- − Management
- −$2,010
- − HOA
- −$4,668
- − Depreciation
- −$3,782
- Taxable income
- $2,028
- Est. tax owed @ 24.0%
- −$487
- After-tax cash flow
- $3,168/yr
For passive investors: Depreciation is non-cash, so a rental often shows a tax loss while cash-flowing — sheltering income. Rental losses are passive: they offset passive income freely, and up to $25,000/yr can offset ordinary (W-2) income if you actively participate and your MAGI is under $100k (phasing out to $0 by $150k); unused losses carry forward. On sale, claimed depreciation is recaptured at up to 25%, and gains may owe capital-gains tax (a 1031 exchange can defer both). Figures are a year-1 estimate at your 24.0% rate — not tax advice; consult a CPA.
Schools (NCES district)
- District
- Broward
- NCES district ID
- 1200180
- Math proficiency
- 42% ▼ -18.00%
- Reading proficiency
- 53% ▼ -5.00%
- Median HH income
- $52,139
- Composite
- 40.88/100
- National rank
- #3621
- State rank
- #46 of 73 in FL
Livability — Hollywood
- Score
- 76/100
- State rank
- #232
- US rank
- #3548
Category grades
Schools grade is shown separately in the Schools card above.
Census & demographics
- Census place
- Hollywood, FL
- County
- Broward County · 1,963,430 people
- City population
- 109,079
- Metro
- Miami-Fort Lauderdale-Pompano Beach, FL
- Population (ZIP)
- 46,322
- Household income
- $56,473
- Rent vs Own
- Severe rent burden
- 3948.0
Population outlook (Broward County) Hauer SSP2
- Today (2025)
- 2,207,033 people
- By 2030
- 2,360,704 · +7.0%
- By 2040
- 2,661,208 · +20.6%
- By 2050
- 2,946,698 · +33.5%
- By 2075
- 3,602,273 · +63.2%
- By 2100
- 3,970,984 · +79.9%
Race, ethnicity, and origin ACS 2023
- Neighborhood character
- Diverse neighborhood (Simpson 0.68)
- Race & ethnicity
- Hispanic / Latino 43% Two or more races 31% White 28% Black 24% Asian 1%
- Hispanic origin (detail)
- Mexican 1% Puerto Rican 4% Cuban 9% Dominican 3% Salvadoran 3%
- Common ancestry
- Hispanic 5% Lithuanian 2% Scotch-Irish 1%
- Foreign-born
- 41% · Canada, Jamaica, Dominican Republic
- Languages at home
- 48% English-only · Spanish 38% French/Haitian/Cajun 6% Russian/Polish/Slavic 2%
Political lean MEDSL · Broward
- 2024 margin
- D (+17.0) · D 58.0% · R 41.0%
- 2008→2024 swing
- -17.8pp toward R · 2008: 34.7pp · 2024: 17.0pp
- All cycles
- 2024: D+17.0 2020: D+29.8 2016: D+35.0 2012: D+34.9 2008: D+34.7
Not yet ingested
- Civics
- —
Market trends
- HPI YoY
- ▼ -406.34%
- Current HPI
- 524.7664
- Rent YoY
- ▲ 0.43%
- Metro
- Miami-Fort Lauderdale-Pompano Beach, FL
- State GDP YoY
- ▲ 3.28%
- F500 in state
- 36
Industry mix (Fortune 500 HQ in FL)
| Industry | F500 HQs | Revenue |
|---|---|---|
| Industrial Technology | 2 | $29B |
|
||
| Insurance | 2 | $17B |
|
||
| Retail | 1 | $60B |
|
||
| Technology Distribution | 1 | $58B |
|
||
| Homebuilding | 1 | $35B |
|
||
| Technology Manufacturing | 1 | $35B |
|
||
Price history
+348.3% since first listed13 events — show timeline
- 2026-02-28 Listed $129,999 MARMLS
- 2026-02-25 Listing Removed — MARMLS
- 2025-08-25 Listing Removed — MARMLS
- 2025-08-25 Listed $139,999 MARMLS
- 2025-05-22 Price Changed $139,999 MARMLS
- 2025-02-25 Listed $149,999 MARMLS
- 2025-02-06 Listing Removed — MARMLS
- 2024-08-06 Listing Removed — MARMLS
- 2024-08-06 Listed $149,999 MARMLS
- 2023-09-08 Listed $160,000 MARMLS
- 2013-06-25 Sold (Public Records) $38,000 Public Records
- 2003-03-13 Sold (Public Records) $38,000 Public Records
- 1996-04-11 Sold (Public Records) $29,000 Public Records
Property tax history
+7.5%/yrLatest (2025): $2,693 · +4.9% YoY. Source: county tax records.
Cash-flow waterfall
monthlySold comps — $/sqft
last 12 mo · ≤1 miLoading sold comps…