 🏗️ New Construction
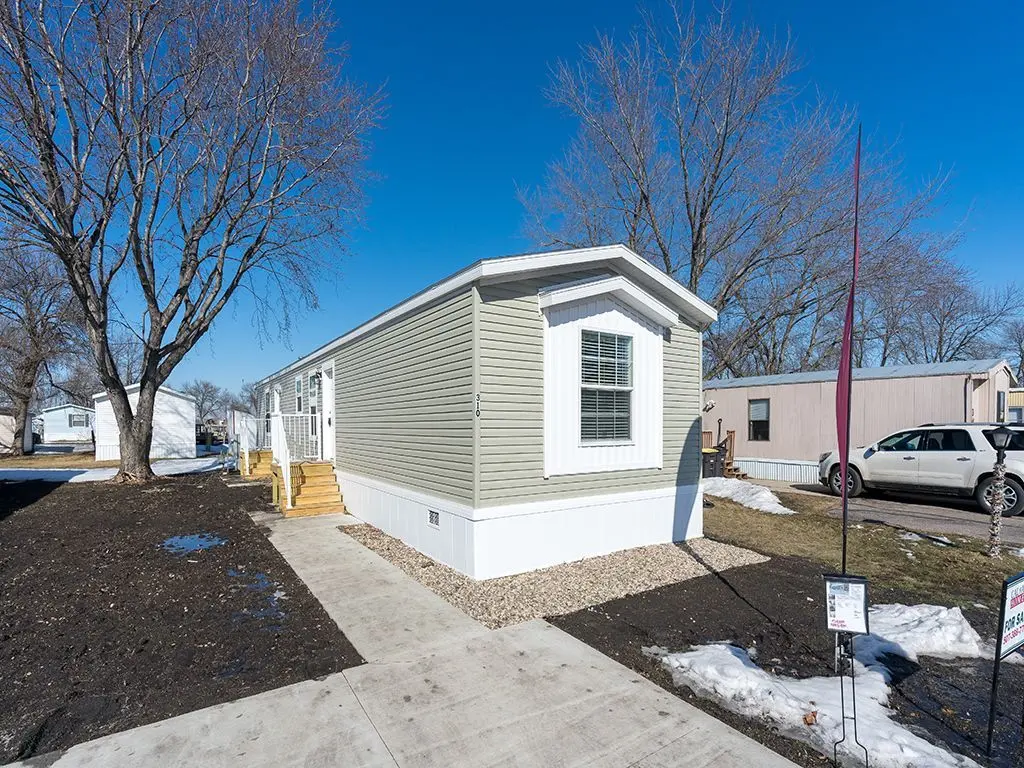
Single Story 3DR 2BA - 1672-206 Plan · North Mankato, MN
Flood risk 1/10 · Minimal
- FEMA flood zone
- X (unshaded)
- Chance of flooding over 30 yrs
- 0.0%
- Est. flood insurance / yr
- $507 – $1,088
Fire risk 3/10 · Minor
- Est. fire insurance / yr
- $888 – $1,650
Heat risk 2/10 · Minimal
- Hot days now (above 100°F)
- 7 days/yr
- Hot days in 30 yrs
- 15 days/yr
Wind risk 2/10 · Minimal
- Chance of severe wind over 30 yrs
- —
Air-quality risk 2/10 · Minimal
- Unhealthy air days now
- 1 days/yr
- Unhealthy air days in 30 yrs
- 1 days/yr
Risk factors via First Street. Map © Google.
Why this score? — see what drove the D grade
The composite is a weighted blend of 9 inputs, each scored 0–100. Each bar is that input's sub-score; the figure is the points it added to the 100-point composite (weight × sub-score).
- Cash flow +11.6/30.0
- 1% rule +7.8/10.0
- ARV discount +7.5/15.0
- Schools +4.4/10.0
- Livability +4.0/5.0
- DSCR +3.4/10.0
- Rent growth +2.5/5.0
- Condition / age +2.5/5.0
- Appreciation +0.0/10.0
$141,900
🖨 Deal sheet (PDF) 📄 Offer letter ✓ Due diligence
Listing remarks MLS
Beautiful 3 bedroom 2 bathroom home. Fully dry walled throughout with easy care vinyl flooring and carpet. The open space in the living, dining and kitchen are perfect for family time and entertaining. The ceilings are 8 ft. high, further adding a feeling of open spaciousness. Every energy efficient window has a window box detail and wood look vinyl blinds. Stay cool in the summer and warm in the winter while enjoying energy savings with 6 in. walls and thick insulation. Save money on lighting with the LED lighting package upgrade. Just steps from Benson Park and some of the greatest biking and jogging paths in the area.
Key facts
- Listed 956 days
Neighborhood map
What this means for you Summary
Snapshot
- This is a 3-bed/2.0-bath manufactured listed at $142k.
Deal economics
- At list price, monthly cash flow is $-44 ($-530/yr) — negative.
- To cash-flow at today's rent, offer at most $136k (4.5% below list).
- Meets the 1% rule at list price ($2k rent vs $142k).
- Recommended offer: $125k (12.0% below list) — sets the bar for market timing.
- Cap rate 5.9% vs local median 3.4% in North Mankato — top-decile yield for the area; either an underpriced asset or a hidden risk that comps aren't pricing in. Stress-test before assuming the spread holds.
Location & tenants
- Location reads 80/100 on livability (#71 in MN, #1,734 nationally) — a professional / high-income tenant draw. Strengths: housing A+, crime A, employment A-; Watch: amenities F, commute F.
- Mankato Public School District (urban): math 48% / reading 56% proficiency, ranked #98 of 301 in MN (top 33%) — acceptable for families but not a draw, mixed tenant base, ~2y average lease.
- Zoned schools: Hoover Elementary (math 55% / reading 56%, grade C, #308 of 857 statewide, top 36%, 503 students, 30% FRL); Dakota Meadows Middle School (math 36% / reading 59%, grade C-, #93 of 258 statewide, top 37%, 878 students, 34% FRL); Mankato West Senior High (math 52% / reading 67%, grade C+, #46 of 471 statewide, top 11%, 1,223 students, 32% FRL) — zoned schools at 32% FRL track the district average.
- Market conditions: 173 active listings in the ZIP; 5 comparable units currently listed for rent nearby; rentals lingering (median 46d on market — plan ~5-8 weeks vacancy on turnover, expect pricing pressure); 100% of comp listings sitting > 30 days — soft ceiling on asking rent; 109 units permitted in Nicollet County in 2024 (47 in 5+ unit buildings).
Forward outlook
- Local home prices are declining (-3.0%/yr); year-one equity from $981 of loan paydown is wiped out by about $4k of value loss. Plan a longer hold.
Negotiation context
- It's been on market 957 days — a 12% lower offer ($125k) is reasonable based on typical stale-listing flexibility.
Risks & watch-outs
- Watch-outs: HOA is 27% of rent.
Questions for the listing agent
- What do current leases actually rent for vs. the listed asking? Can we see a recent rent roll and the last 12 months of T-12 income?
- It's been on market 957 days. Have you received any prior offers? Is the seller open to a 12% concession, seller financing, or rate buy-down credit?
- What does the HOA fee cover, when was the last increase, and are there any pending special assessments or reserve-fund shortfalls?
- Why hasn't it sold? Are there any deal-killer items the seller is aware of (foundation, flood, title, zoning, code violations)?
- Is there a deadline driving the sale (1031 exchange, divorce, estate, relocation)? That informs how much negotiation room exists.
- Schools are A-rated — typically a magnet for longer-tenancy family renters. What's the average tenant stay here, and is there a school-zone premium baked into asking?
- The area grade is low — what's the realistic commute time and amenity access for the typical tenant pool here? Any planned neighborhood developments (good or bad) we should know about?
- What's the average days-on-market for RENTAL listings here right now (not sales)? A rising rental-DOM trend means longer vacancies and softer asking-rent achievability than the comps imply.
- What's the recent tenant-quality profile in this submarket — average credit score on applications, eviction rate, late-payment / NSF rate, and stable-employment percentage? A property-management company in the area should have these aggregated.
- How much new for-sale + rental construction is in the pipeline within 1–3 miles? Heavy new supply typically softens prices + rents 12–24 months out; constrained supply supports both.
Investment metrics
- 1% rule
- 1.28% ✓
- Cap rate
- 5.92%
- Cash-on-cash
- -1.33%
- DSCR
- 0.94
- GRM
- 6.5
CMA / ARV
No comps found within radius.
Projected returns pro-forma
-3.0% appreciation · 3.0% rent growth · sell at horizon
- IRR
- -18.2%
- Equity multiple
- 0.36×
- Total profit
- $-25,473
- Equity at exit
- $21,158
- IRR
- -9.9%
- Equity multiple
- 0.38×
- Total profit
- $-24,453
- Equity at exit
- $12,269
Cash invested: $39,732 (down + closing). Projections, not guarantees.
Landlord ↔ Tenant lean methodology
- Overall (STATE)
- 46 Balanced
- State Minnesota
- 46 Balanced · D+2
- County
- — inherits STATE
- City
- — inherits STATE
ZIP-level market 56003
- Active inventory
- 173
- Price-to-rent
- 6.5×
Monthly cashflow live
- Estimated rent
- $1,813 high interval (Pro) →
- Mortgage (P&I)
- −$744
- Tax est. 1.5%
- −$177 /mo · $2,128/yr
- Insurance
- −$59
- HOA
- −$496
- Vacancy / Maint / Mgmt
- −$381
- Net cashflow
- $-44
Break-even live
Sensitivity live
| Price | -10% $54 | -5% $5 | +0% $-44 | +5% $-93 | +10% $-142 |
|---|---|---|---|---|---|
| Rent | -10% $-187 | -5% $-116 | +0% $-44 | +5% $27 | +10% $99 |
| Rate | -1.0pp $27 | -0.5pp $-8 | base $-44 | +0.5pp $-81 | +1.0pp $-118 |
UW: 25.0% down · 7.5% · 30yr · 1.5% tax · 5.0% vac · 8.0% maint · 8.0% mgmt
Financing live
Cash to close
- Down payment
- $35,475
- Closing costs
- $4,257
- Reserves months
- —
- Total cash needed
- —
Loan-product check · same deal, 3 products live
Conventional
25% down · 7.5% · 30yr
- Down + closing
- —
- Monthly P&I
- —
- Monthly cashflow
- —
- DSCR
- —
- Eligible?
- —
Personal DTI + credit; lowest rate.
DSCR
20% down · 8.5% · 30yr
- Down + closing
- —
- Monthly P&I
- —
- Monthly cashflow
- —
- DSCR
- —
- Eligible?
- —
No personal income docs; deal must DSCR.
Hard money
10% down · 12.0% · 12mo
- Down + closing
- —
- Monthly P&I
- —
- Monthly cashflow
- —
- DSCR
- —
- Eligible?
- —
Short-term bridge; refi at stabilization.
Rent comps 5 comps
| Address | Beds | Baths | Sqft | Rent | $/sqft | DOM | Units | Dist |
|---|---|---|---|---|---|---|---|---|
| 2306 Pleasant View Dr Unit 2306 North Mankato, MN | 3.0 | 2.0 | 1482 | $2,100 | $1.42 | 46d | 1 | 0.18mi |
| 2140 Rolling Green Trl Unit 2141 North Mankato, MN | 3.0 | 2.5 | 1440 | $1,850 | $1.28 | 46d | 1 | 0.21mi |
| 1628 Colony Ct Unit 8 North Mankato, MN | 2.0 | 1.0 | 900 | $900 | $1.00 | 46d | 1 | 1.30mi |
| 418 Allan Ave Unit 6 North Mankato, MN | 2.0 | 1.0 | 846 | $1,195 | $1.41 | 46d | 1 | 1.35mi |
| 414 Allan Ave North Mankato, MN | 2.0 | 1.0 | 818 | $1,195 | $1.46 | 46d | 2 | 1.37mi |
HOA detail
- Monthly dues
- $496 · $5,952/yr
Listing history 20 events
-
2026-06-22days on market $141,900 Active 957 DOM
-
2026-06-21days on market $141,900 Active 956 DOM
-
2026-06-19days on market $141,900 Active 954 DOM
-
2026-06-18days on market $141,900 Active 953 DOM
-
2026-06-17days on market $141,900 Active 952 DOM
-
2026-06-16days on market $141,900 Active 951 DOM
-
2026-06-15days on market $141,900 Active 950 DOM
-
2026-06-14days on market $141,900 Active 948 DOM
-
2026-06-13days on market $141,900 Active 947 DOM
-
2026-06-10days on market $141,900 Active 945 DOM
-
2026-06-09days on market $141,900 Active 944 DOM
-
2026-06-08days on market $141,900 Active 943 DOM
-
2026-06-07days on market $141,900 Active 942 DOM
-
2026-06-05days on market $141,900 Active 939 DOM
-
2026-06-03days on market $141,900 Active 938 DOM
-
2026-06-02days on market $141,900 Active 937 DOM
-
2026-06-01days on market $141,900 Active 936 DOM
-
2026-05-31days on market $141,900 Active 935 DOM
-
2026-05-30days on market $141,900 Active 934 DOM
-
2023-11-08$141,900 Active 628-char remark
Show marketing remark (628 chars)
Beautiful 3 bedroom 2 bathroom home. Fully dry walled throughout with easy care vinyl flooring and carpet. The open space in the living, dining and kitchen are perfect for family time and entertaining. The ceilings are 8 ft. high, further adding a feeling of open spaciousness. Every energy efficient window has a window box detail and wood look vinyl blinds. Stay cool in the summer and warm in the winter while enjoying energy savings with 6 in. walls and thick insulation. Save money on lighting with the LED lighting package upgrade. Just steps from Benson Park and some of the greatest biking and jogging paths in the area.
ⓘ Source: listings_history table (triggers on properties + properties_extension) + one-shot
backfill from property_details.listing_events for pre-trigger history.
Climate risk First Street
- Flood 1/10 Low FEMA zone X (unshaded) · 0% chance over 30 yrs
- Wildfire 3/10 Moderate
- Heat 2/10 Low 7 d/yr ≥100°F today · 15 d/yr by 30 yrs out
- Wind 2/10 Low
- Air quality 2/10 Low 1 unhealthy d/yr today · 1 by 30 yrs out
Nearby sold comps map
Loading sold comps map…
Walkable amenities ~0.75 mi
Loading nearby amenities…
Taxation est. · year 1
- Rental income
- $21,759
- − Mortgage interest
- −$7,949
- − Property taxes
- −$2,128
- − Insurance
- −$710
- − Repairs & maintenance
- −$1,741
- − Management
- −$1,741
- − HOA
- −$5,952
- − Depreciation
- −$4,128
- Taxable loss
- −$2,589
- Est. tax savings @ 24.0%
- +$621
- After-tax cash flow
- $92/yr
For passive investors: Depreciation is non-cash, so a rental often shows a tax loss while cash-flowing — sheltering income. Rental losses are passive: they offset passive income freely, and up to $25,000/yr can offset ordinary (W-2) income if you actively participate and your MAGI is under $100k (phasing out to $0 by $150k); unused losses carry forward. On sale, claimed depreciation is recaptured at up to 25%, and gains may owe capital-gains tax (a 1031 exchange can defer both). Figures are a year-1 estimate at your 24.0% rate — not tax advice; consult a CPA.
Schools (NCES district)
- District
- Mankato Public School District
- NCES district ID
- 2718780
- Math proficiency
- 48% ▼ -11.00%
- Reading proficiency
- 56% ▼ -8.00%
- Median HH income
- $49,469
- Composite
- 44.36/100
- National rank
- #2819
- State rank
- #98 of 301 in MN
Livability — North Mankato
- Score
- 80/100
- State rank
- #71
- US rank
- #1734
Category grades
Schools grade is shown separately in the Schools card above.
Census & demographics
- Census place
- North Mankato, MN
- Population (ZIP)
- 15,319
Population outlook (Nicollet County) Hauer SSP2
- Today (2025)
- 34,373 people
- By 2030
- 34,666 · +0.9%
- By 2040
- 34,616 · +0.7%
- By 2050
- 34,340 · -0.1%
- By 2075
- 33,171 · -3.5%
- By 2100
- 31,949 · -7.1%
Race, ethnicity, and origin ACS 2023
- Neighborhood character
- Predominantly White (87%)
- Race & ethnicity
- White 87% Two or more races 7% Hispanic / Latino 5% Black 2% Asian 2%
- Common ancestry
- Portuguese 14% Italian 4% Scottish 2%
- Foreign-born
- 3% · Canada, China
- Languages at home
- 96% English-only · Spanish 1% Other Indo-European 1%
Political lean MEDSL · Nicollet
- 2024 margin
- Toss-up / Even · D 48.8% · R 49.3% · Other 1.9%
- 2008→2024 swing
- -11.0pp toward R · 2008: 10.5pp · 2024: -0.5pp
- All cycles
- 2024: R+0.5 2020: D+3.2 2016: R+3.1 2012: D+7.9 2008: D+10.5
Not yet ingested
- Civics
- —
Market trends
- HPI YoY
- ▼ -138.37%
- Current HPI
- 165.5673
- Rent YoY
- —
- Metro
- —
- State GDP YoY
- ▲ 2.41%
- F500 in state
- 34
Industry mix (Fortune 500 HQ in MN)
| Industry | F500 HQs | Revenue |
|---|---|---|
| Healthcare | 2 | $407B |
|
||
| Retail | 2 | $150B |
|
||
| Consumer Goods | 2 | $32B |
|
||
| Industrial Machinery | 2 | $6B |
|
||
| Agriculture | 1 | $40B |
|
||
| Healthcare / Medical Devices | 1 | $32B |
|
||
Price history
1 event — show timeline
- 2023-11-08 Listed $141,900 Zillow
Cash-flow waterfall
monthlySold comps — $/sqft
last 12 mo · ≤1 miLoading sold comps…