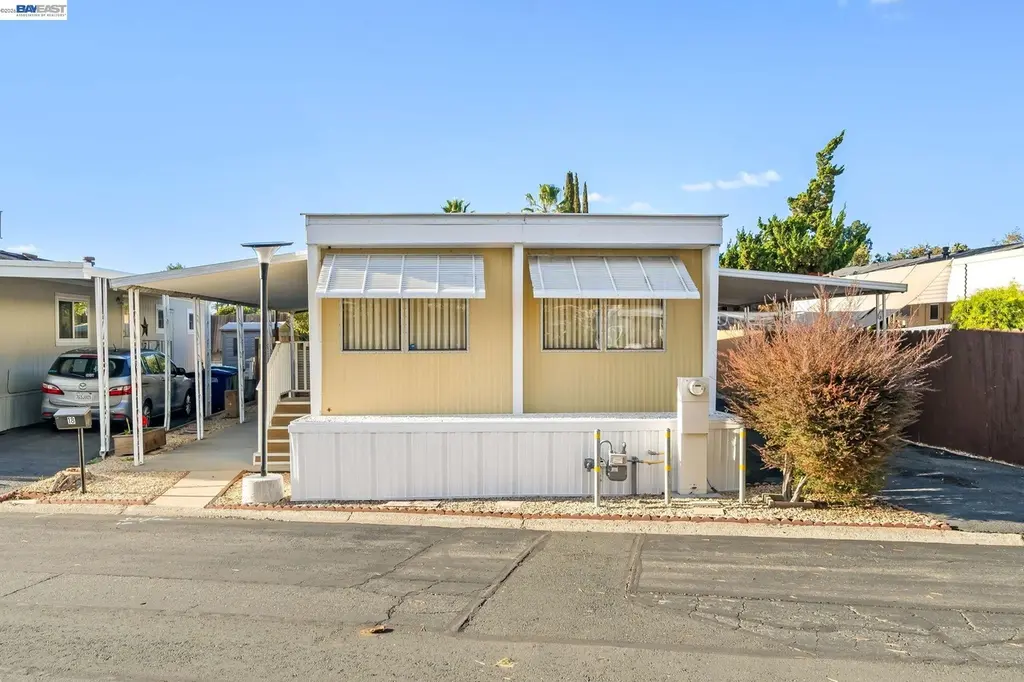
18 Galloway Dr · Concord, CA
Flood risk 1/10 · Minimal
- FEMA flood zone
- X (unshaded)
- Chance of flooding over 30 yrs
- 0.0%
- Est. flood insurance / yr
- $507 – $1,088
Fire risk 3/10 · Minor
- Est. fire insurance / yr
- $659 – $1,223
Heat risk 4/10 · Minor
- Hot days now (above 96°F)
- 7 days/yr
- Hot days in 30 yrs
- 14 days/yr
Wind risk 1/10 · Minimal
- Chance of severe wind over 30 yrs
- —
Air-quality risk 9/10 · Severe
- Unhealthy air days now
- 18 days/yr
- Unhealthy air days in 30 yrs
- 19 days/yr
Risk factors via First Street. Map © Google.
Why this score? — see what drove the B grade
The composite is a weighted blend of 9 inputs, each scored 0–100. Each bar is that input's sub-score; the figure is the points it added to the 100-point composite (weight × sub-score).
- Cash flow +30.0/30.0
- ARV discount +11.1/15.0
- DSCR +10.0/10.0
- 1% rule +9.9/10.0
- Schools +3.8/10.0
- Livability +3.2/5.0
- Rent growth +2.9/5.0
- Condition / age +2.8/5.0
- Appreciation +0.0/10.0
$155,000
🖨 Deal sheet 📄 Offer letter ✓ Due diligence
Listing remarks
Opportunity awaits in this 2-bedroom, 1-bath home located in the desirable Concord Mobile Home Park. This property is ready for your vision and updates, offering a great layout with an open living area, functional kitchen, and two cozy bedrooms. The kitchen and bathroom are original, making this an ideal project for buyers looking to customize a space. Recent improvements include a brand-new heater and brand-new swamp cooler, adding comfort and value from day one. Residents enjoy fantastic community amenities, including two swimming pools, a clubhouse, and beautifully maintained grounds. Conveniently located near shopping, dining, BART, and freeway access, this home combines affordability,
Key facts
- Functional kitchen
- Original bathroom
- Open living area
Tags
Property features AI
Finance
- HOA & community: Pets allowed (cats and dogs; number and size limits apply); Community clubhouse; Community pool; Located in Concord Mobile Home Park
Exterior
- Parking: Carport
- Utilities: Public water; Public sewer
- Home design: Manufactured in park (mobile home); Double wide
- Construction: Aluminum siding; Metal construction
- Exterior features: Back yard; Front yard; Landscaped; Awnings on patio/porch
Interior
- Kitchen: Gas range; Self-cleaning oven; Refrigerator; Pantry
- Bedrooms: 2 bedrooms (main entry level)
- Flooring: Laminate; Vinyl
- Bathrooms: 1 full bathroom
- Heating & cooling: Forced air heating; Ceiling fan(s)
- Interior features: Pantry; Dining area; Living room
- Laundry & utility: Laundry in park
Neighborhood map
What this means for you Summary
Snapshot
- This is a 2-bed/1.0-bath manufactured listed at $155k. Condition is rated average.
Deal economics
- At list price, monthly cash flow is $749 ($9k/yr) — positive.
- The deal already cash-flows at list — no discount required.
- Meets the 1% rule at list price ($2k rent vs $155k).
- Cap rate 12.1% vs local median 2.8% in Concord — top-decile yield for the area; either an underpriced asset or a hidden risk that comps aren't pricing in. Stress-test before assuming the spread holds.
Location & tenants
- Location reads 65/100 on livability (#397 in CA) — a middle-class / working-renter tenant base. Strengths: employment A+, health & safety A+, housing B; Watch: schools C-, crime F, amenities F.
- Mt. Diablo Unified (suburban): math 36% / reading 45% proficiency, ranked #202 of 517 in CA (top 39%) — families likely to look elsewhere, expect single-tenant / working-renter base with shorter leases.
- Market conditions: Rents rising (+1.6%/yr); 116 active listings in the ZIP; 40 comparable units currently listed for rent nearby; rentals at typical pace (median 20d on market — plan ~3-4 weeks tenant-placement turnaround); solid renter incomes; 2,169 units permitted in Contra Costa County in 2024 (896 in 5+ unit buildings).
- This rent runs 34% of the median local income ($82k/yr) — at the standard rent-burdened threshold; future hikes will face affordability resistance.
Forward outlook
- Local home prices are declining (-3.0%/yr); year-one equity from $1k of loan paydown is wiped out by about $5k of value loss. Plan a longer hold.
- Contra Costa County population projected at +26% by 2050 — long-run rental-demand tailwind backs the buy-and-hold thesis.
- At projected returns (-3.0% appreciation + 1.6% rent growth), your $43k cash investment doubles in ~7 years — after that, you're playing with house money.
Negotiation context
- Only 13 days on market — expect competitive offers; lowballing is unlikely to land.
Questions for the listing agent
- Is there a deadline driving the sale (1031 exchange, divorce, estate, relocation)? That informs how much negotiation room exists.
- Crime grade is F in this area — have there been break-ins, vandalism, or insurance claims at this property in the last 3 years? What carrier currently insures it and at what premium?
- What's the average days-on-market for RENTAL listings here right now (not sales)? A rising rental-DOM trend means longer vacancies and softer asking-rent achievability than the comps imply.
- What's the recent tenant-quality profile in this submarket — average credit score on applications, eviction rate, late-payment / NSF rate, and stable-employment percentage? A property-management company in the area should have these aggregated.
- How much new for-sale + rental construction is in the pipeline within 1–3 miles? Heavy new supply typically softens prices + rents 12–24 months out; constrained supply supports both.
Investment metrics
- 1% rule
- 1.49% ✓
- Cap rate
- 12.09%
- Cash-on-cash
- 20.71%
- DSCR
- 1.92
- GRM
- 5.6
CMA / ARV
- ARV (on-the-fly)
- $168,448
- Comps found
- 8
Show comp detail 8 sales within ~0.75 mi
| Address | Dist | Beds/Ba | Sqft | Sold | Price | $/sf | Match |
|---|---|---|---|---|---|---|---|
| 96 Welcome Ave | 0.11mi | 2/2.0 | 868 (-3%) | 1mo | $199,000 | $229 | 85 |
| 81 Eileen | 0.09mi | 2/1.0 | 825 (-8%) | 4mo | $149,000 | $181 | 80 |
| 141 Scenic Dr | 0.14mi | 2/1.0 | 800 (-11%) | 2mo | $135,000 | $169 | 74 |
| 56 Koch Ln | 0.03mi | 2/2.0 | 960 (+7%) | 13mo | $145,000 | $151 | 72 |
| 86 Eileen Ln | 0.10mi | 2/2.0 | 812 (-9%) | 6mo | $235,000 | $289 | 71 |
| 53 Galloway Dr #53 | 0.13mi | 2/2.0 | 940 (+5%) | 16mo | $275,000 | $293 | 69 |
| 26 David Dr | 0.07mi | 3/2.0 (+1) | 1,020 (+14%) | 3mo | $170,000 | $167 | 63 |
| 14 Terrace Dr | 0.24mi | 2/2.0 | 1,008 (+12%) | 17mo | $189,000 | $188 | 50 |
Match score weights: distance 35% · size 25% · config 20% · recency 20%. Top-matched comps best support the ARV.
Projected returns pro-forma
-3.0% appreciation · 1.59% rent growth · sell at horizon
- IRR
- 11.5%
- Equity multiple
- 1.45×
- Total profit
- $19,399
- Equity at exit
- $23,111
- IRR
- 19.3%
- Equity multiple
- 2.51×
- Total profit
- $65,603
- Equity at exit
- $13,402
Cash invested: $43,400 (down + closing). Projections, not guarantees.
Landlord ↔ Tenant lean methodology
- Overall (STATE)
- 18 Strongly Tenant-Friendly
- State California
- 18 Strongly Tenant-Friendly · D+13
- County
- — inherits STATE
- City
- — inherits STATE
ZIP-level market 94520
- Rents YoY
- 1.6%
- Active inventory
- 116
- Price-to-rent
- 5.6×
Monthly cashflow live
- Estimated rent
- $2,304 high interval (Pro) →
- Mortgage (P&I)
- −$813
- Tax est. 1.5%
- −$194 /mo · $2,325/yr
- Insurance
- −$65
- HOA
- −$0
- Vacancy / Maint / Mgmt
- −$484
- Net cashflow
- $749
Break-even live
UW: 25.0% down · 7.5% · 30yr · 1.5% tax · 5.0% vac · 8.0% maint · 8.0% mgmt
Financing live
Cash to close
- Down payment
- $38,750
- Closing costs
- $4,650
- Reserves months
- —
- Total cash needed
- —
Loan-product check · same deal, 3 products live
Conventional
25% down · 7.5% · 30yr
- Down + closing
- —
- Monthly P&I
- —
- Monthly cashflow
- —
- DSCR
- —
- Eligible?
- —
Personal DTI + credit; lowest rate.
DSCR
20% down · 8.5% · 30yr
- Down + closing
- —
- Monthly P&I
- —
- Monthly cashflow
- —
- DSCR
- —
- Eligible?
- —
No personal income docs; deal must DSCR.
Hard money
10% down · 12.0% · 12mo
- Down + closing
- —
- Monthly P&I
- —
- Monthly cashflow
- —
- DSCR
- —
- Eligible?
- —
Short-term bridge; refi at stabilization.
Rent comps 40 comps
| Address | Beds | Baths | Sqft | Rent | $/sqft | DOM | Units | Dist |
|---|---|---|---|---|---|---|---|---|
| 1070 San Miguel Rd Concord, CA | 1.0–2.0 | 1.0–1.5 | 890 | $2,590 | $2.91 | 19d | 1 | 0.13mi |
| 2751 Monument Blvd Concord, CA | 1.0–2.0 | 1.0 | 676 | $2,045 | $3.03 | 3d | 1 | 0.52mi |
| 2055 Sierra Rd #34 Concord, CA | 1.0 | 1.0 | 639 | $2,150 | $3.36 | 24d | 1 | 0.56mi |
| 1236 Detroit Ave Concord, CA | 2.0 | 1.0 | 750 | $2,430 | $3.24 | 4d | 1 | 0.60mi |
| 2043 Sierra Rd #11 Concord, CA | 2.0 | 1.5 | 904 | $2,100 | $2.32 | 24d | 1 | 0.61mi |
| 2925 Monument Blvd Concord, CA | 2.0–3.0 | 1.5 | 1084 | $2,545 | $2.35 | 3d | 5 | 0.62mi |
| 2039 Sierra Rd Concord, CA | 3.0 | 2.0 | 1098 | $2,895 | $2.64 | 24d | 1 | 0.63mi |
| 1036 Oak Grove Rd Concord, CA | 1.0–2.0 | 1.0–1.5 | 810 | $2,600 | $3.21 | 24d | 2 | 0.66mi |
| 1036 Oak Grove Rd Concord, CA | 1.0–2.0 | 1.0–1.5 | 826 | $2,600 | $3.15 | 2d | 3 | 0.66mi |
| 1050 Oak Grove Rd Concord, CA | 1.0–2.0 | 1.0 | 740 | $2,325 | $3.14 | 1d | 3 | 0.76mi |
| 2067 Riley Ct Unit 5 Concord, CA | 1.0 | 1.0 | 710 | $1,750 | $2.46 | 18d | 1 | 0.80mi |
| 1160 Meadow Ln Concord, CA | 1.0–2.0 | 1.0–1.5 | 740 | $2,240 | $3.02 | 11d | 9 | 0.80mi |
| 2055 Fox Way Concord, CA | 1.0 | 1.0 | 592 | $1,850 | $3.12 | 24d | 1 | 0.80mi |
| 2065 Riley Ct Apt 1 Concord, CA | 1.0 | 1.0 | 600 | $1,699 | $2.83 | 21d | 1 | 0.81mi |
| 2065 Riley Ct Apt 1 Concord, CA | 1.0 | 1.0 | 600 | $1,799 | $3.00 | 24d | 1 | 0.81mi |
| 1133 Meadow Ln #94 Concord, CA | 1.0 | 1.0 | 592 | $1,595 | $2.69 | 3d | 1 | 0.85mi |
| 1818 Laguna St Concord, CA | 1.0–2.0 | 1.0 | 750 | $2,695 | $3.59 | 5d | 12 | 0.86mi |
| 1185 Meadow Ln Unit 115 Concord, CA | 1.0 | 1.0 | 800 | $2,350 | $2.94 | 24d | 1 | 0.87mi |
| 1866 Robin Ln Unit 6 Concord, CA | 2.0 | 1.0 | 700 | $2,200 | $3.14 | 20d | 1 | 0.88mi |
| 1883 Robin Ln #1 Concord, CA | 2.0 | 1.0 | 950 | $2,600 | $2.74 | 24d | 1 | 0.89mi |
| 1195 Heather Ct Unit A Concord, CA | 2.0 | 1.0 | 980 | $2,700 | $2.76 | 3d | 1 | 0.90mi |
| 1750 Diane Ct Concord, CA | 2.0 | 1.0 | 900 | $2,325 | $2.58 | 24d | 1 | 0.90mi |
| 1854 Robin Ln Concord, CA | 1.0 | 1.0 | 625 | $1,725 | $2.76 | 24d | 1 | 0.90mi |
| 1867 Robin Ln Unit 3 Concord, CA | 1.0 | 1.0 | 700 | $1,595 | $2.28 | 24d | 1 | 0.90mi |
| 1500 Ellis St Concord, CA | 2.0 | 1.0–2.0 | 664 | $2,350 | $3.54 | 11d | 5 | 0.91mi |
| 1841 Laguna St Concord, CA | 2.0 | 1.0 | 925 | $2,372 | $2.56 | 24d | 5 | 0.93mi |
| 1441 Detroit Ave Concord, CA | 1.0–2.0 | 1.0–2.0 | 738 | $2,391 | $3.24 | 1d | 11 | 0.95mi |
| 1835 Robin Ln Concord, CA | 2.0 | 2.0 | 800 | $2,100 | $2.62 | 5d | 1 | 0.95mi |
| 1835 Robin Ln Unit 11 Concord, CA | 2.0 | 2.0 | 800 | $2,100 | $2.62 | 24d | 1 | 0.95mi |
| 1555 Galindo St Concord, CA | 1.0–3.0 | 1.0–2.5 | 1045 | $3,696 | $3.54 | 1d | 13 | 0.96mi |
| 1699 Laguna St Concord, CA | 1.0 | 1.0 | 646 | $1,787 | $2.77 | 24d | 1 | 0.97mi |
| 1150 Virginia Ln Concord, CA | 1.0 | 1.0 | 600 | $1,775 | $2.96 | 16d | 1 | 0.99mi |
| 1591 Ellis St #220 Concord, CA | 1.0 | 1.0 | 646 | $2,000 | $3.10 | 12d | 1 | 1.00mi |
| 1491 Detroit Ave Concord, CA | 1.0–2.0 | 1.0 | 650 | $1,999 | $3.08 | 16d | 1 | 1.00mi |
| 1590 Frisbie Ct Unit 6 Concord, CA | 2.0 | 1.0 | 850 | $2,195 | $2.58 | 15d | 1 | 1.00mi |
| 1660 Haller Ct Concord, CA | 2.0 | 1.0 | 880 | $2,125 | $2.41 | 21d | 1 | 1.01mi |
| 1501 Detroit Ave Concord, CA | 2.0 | 1.5 | 812 | $2,234 | $2.75 | 11d | 3 | 1.03mi |
| 1620 Adelaide St Concord, CA | 1.0 | 1.0 | 550 | $1,722 | $3.13 | 24d | 1 | 1.04mi |
| 1731 Ellis St #58 Concord, CA | 1.0 | 1.0 | 645 | $1,800 | $2.79 | 3d | 1 | 1.04mi |
| 1631 Frisbie Ct Concord, CA | 2.0 | 1.0 | 750 | $2,100 | $2.80 | 24d | 1 | 1.04mi |
Listing history 14 events
-
2026-06-18days on market $155,000 Active 13 DOM
-
2026-06-17days on market $155,000 Active 12 DOM
-
2026-06-16days on market $155,000 Active 11 DOM
-
2026-06-15days on market $155,000 Active 10 DOM
-
2026-06-13days on market $155,000 Active 8 DOM
-
2026-06-13days on market $155,000 Active 7 DOM
-
2026-06-10days on market $155,000 Active 4 DOM
-
2026-06-08days on market $155,000 Active 3 DOM
-
2026-06-07days on market $155,000 Active 2 DOM
-
2026-06-01days on market $155,000 Active 193 DOM
-
2026-05-31days on market $155,000 Active 192 DOM
-
2026-04-21price $155,000
-
2026-01-07price $169,000
-
2025-11-20$179,000 Active
ⓘ Source: listings_history table (triggers on properties + properties_extension) + one-shot
backfill from property_details.listing_events for pre-trigger history.
Climate risk First Street
- Flood 1/10 Low FEMA zone X (unshaded) · 0% chance over 30 yrs
- Wildfire 3/10 Moderate
- Heat 4/10 Moderate 7 d/yr ≥96°F today · 14 d/yr by 30 yrs out
- Wind 1/10 Low
- Air quality 9/10 Extreme 18 unhealthy d/yr today · 19 by 30 yrs out
Nearby sold comps map
Loading sold comps map…
Walkable amenities ~0.75 mi
Loading nearby amenities…
Taxation est. · year 1
- Rental income
- $27,648
- − Mortgage interest
- −$8,682
- − Property taxes
- −$2,325
- − Insurance
- −$775
- − Repairs & maintenance
- −$2,212
- − Management
- −$2,212
- − Depreciation
- −$4,509
- Taxable income
- $6,933
- Est. tax owed @ 24.0%
- −$1,664
- After-tax cash flow
- $7,324/yr
For passive investors: Depreciation is non-cash, so a rental often shows a tax loss while cash-flowing — sheltering income. Rental losses are passive: they offset passive income freely, and up to $25,000/yr can offset ordinary (W-2) income if you actively participate and your MAGI is under $100k (phasing out to $0 by $150k); unused losses carry forward. On sale, claimed depreciation is recaptured at up to 25%, and gains may owe capital-gains tax (a 1031 exchange can defer both). Figures are a year-1 estimate at your 24.0% rate — not tax advice; consult a CPA.
Condition & rehab AI · 12 photos
This 2-bedroom, 1-bath home in Concord Mobile Home Park requires moderate renovations to improve its condition and increase its value. Key updates include painting interior walls, replacing kitchen cabinets, and upgrading bathroom fixtures.
Repairs flagged
- Minor Kitchen cabinets — Original cabinets
- Minor Bathroom fixtures — Original fixtures
- Moderate Exterior siding — Worn appearance
- Minor Interior walls — Some wear
Value-add opportunities
- Resale Paint interior walls — Fresh paint enhances curb appeal
- Resale Replace kitchen cabinets — Modern cabinets improve functionality and aesthetics
- Resale Replace bathroom fixtures — Upgraded fixtures increase appeal and functionality
- Both Landscaping — Improved landscaping enhances curb appeal and adds value
Renovation cost estimate screening
| Repair item | Severity | Est. cost |
|---|---|---|
| Kitchen cabinets · Original cabinets | Minor | $500–3,000 |
| Bathroom fixtures · Original fixtures | Minor | $500–3,000 |
| Exterior siding · Worn appearance | Moderate | $3,000–15,000 |
| Interior walls · Some wear | Minor | $500–3,000 |
| Total estimated repair cost · 4 items | $4,500–24,000 |
Value-add ROI direction
- Resale Paint interior walls — Fresh paint enhances curb appeal ↑
- Resale Replace kitchen cabinets — Modern cabinets improve functionality and aesthetics ↑
- Resale Replace bathroom fixtures — Upgraded fixtures increase appeal and functionality ↑
- Both Landscaping — Improved landscaping enhances curb appeal and adds value ↑
ⓘ Cost ranges are severity-bucket heuristics (US national rule-of-thumb). Get contractor quotes + a written scope before underwriting a rehab budget.
Schools (NCES district)
- District
- Mt. Diablo Unified
- NCES district ID
- 0626370
- Math proficiency
- 36% ▼ -2.00%
- Reading proficiency
- 45% ▼ -5.00%
- Median HH income
- $77,494
- Composite
- 37.5/100
- National rank
- #4401
- State rank
- #202 of 517 in CA
Livability — Concord
- Score
- 65/100
- State rank
- #397
- US rank
- #13519
Category grades
Schools grade is shown separately in the Schools card above.
Census & demographics
- Census place
- Concord, CA
- County
- Contra Costa County · 1,059,880 people
- City population
- 125,693
- Metro
- San Francisco-Oakland-Berkeley, CA
- Population (ZIP)
- 37,381
- Household income
- $82,479
- Rent vs Own
- Severe rent burden
- 2649.0
Population outlook (Contra Costa County) Hauer SSP2
- Today (2025)
- 1,287,720 people
- By 2030
- 1,364,937 · +6.0%
- By 2040
- 1,506,209 · +17.0%
- By 2050
- 1,624,373 · +26.1%
- By 2075
- 1,853,193 · +43.9%
- By 2100
- 1,901,231 · +47.6%
Race, ethnicity, and origin ACS 2023
- Neighborhood character
- Diverse neighborhood (Simpson 0.65)
- Race & ethnicity
- Hispanic / Latino 51% White 28% Two or more races 20% Asian 10% Black 4% Native American 2%
- Hispanic origin (detail)
- Mexican 35% Puerto Rican 3%
- Common ancestry
- Lithuanian 2% Italian 2% Russian 1%
- Foreign-born
- 35% · Canada, China, Vietnam
- Languages at home
- 43% English-only · Spanish 43% Tagalog/Filipino 3% Other Indo-European 2%
Political lean MEDSL · Contra Costa
- 2024 margin
- Solid D (+38.0) · D 67.3% · R 29.4% · Other 3.3%
- 2008→2024 swing
- +0.2pp no change · 2008: 37.8pp · 2024: 38.0pp
- All cycles
- 2024: D+38.0 2020: D+45.3 2016: D+43.5 2012: D+33.7 2008: D+37.8
Not yet ingested
- Civics
- —
Market trends
- HPI YoY
- ▼ -551.74%
- Current HPI
- 440.2872
- Rent YoY
- ▲ 1.59%
- Metro
- San Francisco-Oakland-Berkeley, CA
- State GDP YoY
- ▲ 3.21%
- F500 in state
- 116
Industry mix (Fortune 500 HQ in CA)
| Industry | F500 HQs | Revenue |
|---|---|---|
| Technology | 27 | $1,492B |
|
||
| Financial Services | 3 | $174B |
|
||
| Retail | 3 | $44B |
|
||
| Insurance | 3 | $26B |
|
||
| Media / Entertainment | 2 | $115B |
|
||
| Pharmaceuticals / Biotech | 2 | $62B |
|
||
Price history
-13.4% since first listed3 events — show timeline
- 2026-04-21 Price Changed $155,000 bridgeMLS, Bay East AOR, or Contra Costa AOR
- 2026-01-07 Price Changed $169,000 bridgeMLS, Bay East AOR, or Contra Costa AOR
- 2025-11-20 Listed $179,000 bridgeMLS, Bay East AOR, or Contra Costa AOR
Cash-flow waterfall
monthlySold comps — $/sqft
last 12 mo · ≤1 miLoading sold comps…