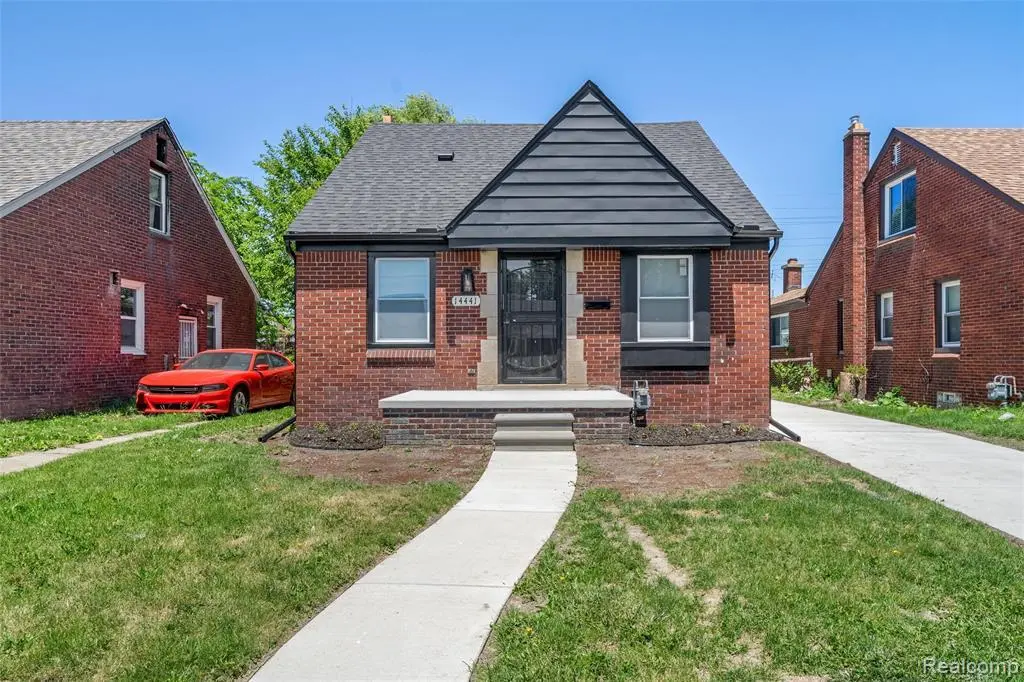
14441 Carlisle St · Detroit, MI
Flood risk 1/10 · Minimal
- FEMA flood zone
- X (unshaded)
- Chance of flooding over 30 yrs
- 0.0%
- Est. flood insurance / yr
- $473 – $860
Fire risk 1/10 · Minimal
- Est. fire insurance / yr
- $784 – $1,456
Heat risk 3/10 · Minor
- Hot days now (above 96°F)
- 7 days/yr
- Hot days in 30 yrs
- 15 days/yr
Wind risk 2/10 · Minimal
- Chance of severe wind over 30 yrs
- —
Air-quality risk 3/10 · Minor
- Unhealthy air days now
- 2 days/yr
- Unhealthy air days in 30 yrs
- 5 days/yr
Risk factors via First Street. Map © Google.
Why this score? — see what drove the D- grade
The composite is a weighted blend of 9 inputs, each scored 0–100. Each bar is that input's sub-score; the figure is the points it added to the 100-point composite (weight × sub-score).
- Cash flow +12.6/30.0
- ARV discount +7.5/15.0
- DSCR +3.8/10.0
- Livability +3.7/5.0
- 1% rule +3.5/10.0
- Rent growth +2.8/5.0
- Condition / age +2.5/5.0
- Schools +1.3/10.0
- Appreciation +0.0/10.0
$160,000
🖨 Deal sheet (PDF) 📄 Offer letter ✓ Due diligence
Listing remarks MLS
Welcome home! Just bring your furniture and move right in! This beautifully remodeled 3-bedroom, 1.5-bath home has been completely updated from top to bottom. Enjoy peace of mind with a brand-new roof, doors, trim, and moldings, along with a stunning modern kitchen and updated bathrooms. New flooring flows throughout the entire home, creating a fresh and inviting feel. The kitchen comes fully equipped with brand-new appliances, including a stove, refrigerator, and dishwasher. The spacious basement offers endless possibilities and can easily serve as a family room, home office, gym, or even a potential 4th bedroom. Outside, you'll find a brand-new driveway leading to a 1-car garage, all situated on a quiet, well-maintained block. Don't miss the opportunity to make this beauty yours. Schedule your showing today and make this move-in-ready beauty your new home! Make sure to watch the virtual tour video!
Key facts
- Remodeled
- Brand-new roof
- Updated bathrooms
Tags
Property features AI
Exterior
- Parking: Detached 1-car garage
- Utilities: Public water; Public sewer
- Home design: Single-family residence; One and one-half story; Ground-level entry; Brick exterior
- Construction: Built with brick construction materials; Brick/mortar foundation
- Exterior features: Paved road access; Lot roughly 40 x 114 (0.11 acres)
Interior
- Kitchen: Dishwasher; Free-standing gas oven; Stainless steel appliances
- Bathrooms: 1 full bathroom; 1 half bathroom
- Heating & cooling: Forced air heating (natural gas); No central air
- Interior features: Dishwasher; Free-standing gas oven; Stainless steel appliances; Partially finished basement; 5 total rooms
Neighborhood map
What this means for you Summary
Snapshot
- This is a 3-bed/1.0-bath single-family listed at $160k.
Deal economics
- At list price, monthly cash flow is $-20 ($-236/yr) — negative.
- To cash-flow at today's rent, offer at most $157k (2.2% below list).
- To meet the 1% rule (rent ≥ 1% of price), the offer needs to be $136k (15.1% below list).
- Recommended offer: $136k (15.1% below list) — sets the bar for 1% rule.
- Cap rate 6.1% vs local median 10.0% in Detroit — below-typical yield; the buyer is paying a premium for something (appreciation thesis, condition, location) that the cap rate doesn't capture.
Location & tenants
- Location reads 73/100 on livability (#218 in MI) — a middle-class / working-renter tenant base. Strengths: amenities A+, commute A+, cost of living A+; Watch: crime F, employment F.
- Detroit Public Schools Community District (urban): math 10% / reading 24% proficiency, ranked #499 of 540 in MI (top 92%) — low school quality limits family demand, transient renter base, plan for 1-2y turnover; 90% free/reduced lunch — lower-income household profile, screen leases tightly.
- Zoned schools: Pulaski Elementarymiddle School (math 10% / reading 10%, grade F, #1,230 of 1,397 statewide, top 91%, 355 students, 98% FRL); Osborn High School (math 5% / reading 15%, grade F, #659 of 713 statewide, top 97%, 407 students, 92% FRL).
- Market conditions: Rents rising (+1.3%/yr); 376 active listings in the ZIP; 28 comparable units currently listed for rent nearby; rentals at typical pace (median 20d on market — plan ~3-4 weeks tenant-placement turnaround); lower-income renter base — watch delinquency; 2,639 units permitted in Wayne County in 2024 (1,216 in 5+ unit buildings).
- This rent runs 42% of the median local income ($39k/yr) — at the standard rent-burdened threshold; future hikes will face affordability resistance.
Forward outlook
- Local home prices are declining (-3.0%/yr); year-one equity from $1k of loan paydown is wiped out by about $5k of value loss. Plan a longer hold.
- Wayne County population projected at -17% by 2050 — secular population decline; favor cash flow + early exit over multi-decade hold.
Negotiation context
- It's been on market 17 days — a 2% lower offer ($158k) is reasonable based on typical stale-listing flexibility.
- 9 sale attempts since 23y ago with the ask held roughly flat each time — persistent listings suggest the price (not the market) is what's stuck; bring a comps-based counter.
- Current owner paid $61k; list at $160k implies a 161% gain — meaningful room to come down on a strong offer.
Risks & watch-outs
- Watch-outs: built in 1946 — expect roof / HVAC / electrical / plumbing capex.
Questions for the listing agent
- What do current leases actually rent for vs. the listed asking? Can we see a recent rent roll and the last 12 months of T-12 income?
- Built in 1946 — when were the roof, HVAC, electrical panel, plumbing, and water heater last replaced?
- Is there a deadline driving the sale (1031 exchange, divorce, estate, relocation)? That informs how much negotiation room exists.
- Schools are F-rated, which usually means shorter tenancies and higher turnover. Who's the typical renter profile here, and what's been the actual vacancy rate?
- Crime grade is F in this area — have there been break-ins, vandalism, or insurance claims at this property in the last 3 years? What carrier currently insures it and at what premium?
- The area grade is low — what's the realistic commute time and amenity access for the typical tenant pool here? Any planned neighborhood developments (good or bad) we should know about?
- What's the average days-on-market for RENTAL listings here right now (not sales)? A rising rental-DOM trend means longer vacancies and softer asking-rent achievability than the comps imply.
- What's the recent tenant-quality profile in this submarket — average credit score on applications, eviction rate, late-payment / NSF rate, and stable-employment percentage? A property-management company in the area should have these aggregated.
- How much new for-sale + rental construction is in the pipeline within 1–3 miles? Heavy new supply typically softens prices + rents 12–24 months out; constrained supply supports both.
Investment metrics
- 1% rule
- 0.85% ✗
- Cap rate
- 6.15%
- Cash-on-cash
- -0.53%
- DSCR
- 0.98
- GRM
- 9.8
CMA / ARV
- ARV (on-the-fly)
- $52,488
- Comps found
- 12
Show comp detail 12 sales within ~0.75 mi
| Address | Dist | Beds/Ba | Sqft | Sold | Price | $/sf | Match |
|---|---|---|---|---|---|---|---|
| 14068 Carlisle St | 0.20mi | 3/1.0 | 1,020 (+5%) | 2mo | $55,000 | $54 | 81 |
| 19953 Regent Dr | 0.39mi | 3/1.0 | 1,038 (+7%) | 2mo | $55,000 | $53 | 69 |
| 14076 Rossini Dr | 0.45mi | 3/1.0 | 1,055 (+8%) | 0mo | $90,000 | $85 | 65 |
| 20218 Hickory St | 0.68mi | 3/1.0 | 930 (-4%) | 2mo | $26,000 | $28 | 60 |
| 14078 Bringard Dr | 0.28mi | 3/1.5 | 1,110 (+14%) | 2mo | $76,000 | $68 | 60 |
| 20020 Pelkey St | 0.67mi | 3/1.0 | 1,020 (+5%) | 2mo | $75,000 | $74 | 59 |
| 20300 Hickory St | 0.67mi | 3/1.0 | 918 (-6%) | 1mo | $31,000 | $34 | 59 |
| 14788 Rossini Dr | 0.46mi | 3/1.0 | 1,099 (+13%) | 1mo | $82,000 | $75 | 56 |
| 20200 Alcoy St | 0.75mi | 3/1.0 | 917 (-6%) | 2mo | $55,100 | $60 | 54 |
| 14910 Fairmount Dr | 0.46mi | 3/1.0 | 1,116 (+15%) | 1mo | $15,000 | $13 | 53 |
| 15275 Eastburn St | 0.59mi | 3/1.0 | 1,100 (+13%) | 2mo | $56,000 | $51 | 49 |
| 14027 Tacoma St | 0.56mi | 2/1.5 (-1) | 860 (-12%) | 2mo | $34,000 | $40 | 46 |
Match score weights: distance 35% · size 25% · config 20% · recency 20%. Top-matched comps best support the ARV.
Projected returns pro-forma
-3.0% appreciation · 1.33% rent growth · sell at horizon
- IRR
- -19.0%
- Equity multiple
- 0.34×
- Total profit
- $-29,412
- Equity at exit
- $23,857
- IRR
- -15.3%
- Equity multiple
- 0.19×
- Total profit
- $-36,080
- Equity at exit
- $13,834
Cash invested: $44,800 (down + closing). Projections, not guarantees.
Landlord ↔ Tenant lean methodology
- Overall (STATE)
- 62 Landlord-Friendly
- State Michigan
- 62 Landlord-Friendly · EVEN
- County
- — inherits STATE
- City
- — inherits STATE
ZIP-level market 48205
- Home prices YoY
- -28.1%
- Rents YoY
- 1.3%
- Active inventory
- 376
- Price-to-rent
- 9.8×
Monthly cashflow live
- Estimated rent
- $1,358 high interval (Pro) →
- Mortgage (P&I)
- −$839
- Tax from tax record
- −$187 /mo · $2,241/yr
- Insurance
- −$67
- HOA
- −$0
- Vacancy / Maint / Mgmt
- −$285
- Net cashflow
- $-20
Break-even live
Sensitivity live
| Price | -10% $71 | -5% $26 | +0% $-20 | +5% $-65 | +10% $-110 |
|---|---|---|---|---|---|
| Rent | -10% $-127 | -5% $-73 | +0% $-20 | +5% $34 | +10% $88 |
| Rate | -1.0pp $61 | -0.5pp $21 | base $-20 | +0.5pp $-61 | +1.0pp $-103 |
UW: 25.0% down · 7.5% · 30yr · 1.5% tax · 5.0% vac · 8.0% maint · 8.0% mgmt
Financing live
Cash to close
- Down payment
- $40,000
- Closing costs
- $4,800
- Reserves months
- —
- Total cash needed
- —
Loan-product check · same deal, 3 products live
Conventional
25% down · 7.5% · 30yr
- Down + closing
- —
- Monthly P&I
- —
- Monthly cashflow
- —
- DSCR
- —
- Eligible?
- —
Personal DTI + credit; lowest rate.
DSCR
20% down · 8.5% · 30yr
- Down + closing
- —
- Monthly P&I
- —
- Monthly cashflow
- —
- DSCR
- —
- Eligible?
- —
No personal income docs; deal must DSCR.
Hard money
10% down · 12.0% · 12mo
- Down + closing
- —
- Monthly P&I
- —
- Monthly cashflow
- —
- DSCR
- —
- Eligible?
- —
Short-term bridge; refi at stabilization.
Rent comps 28 comps
| Address | Beds | Baths | Sqft | Rent | $/sqft | DOM | Units | Dist |
|---|---|---|---|---|---|---|---|---|
| 14068 Carlisle St Detroit, MI | 3.0 | 1.0 | 1020 | $1,300 | $1.27 | 26d | 1 | 0.19mi |
| 20215 Schoenherr St Unit 1 Detroit, MI | 2.0 | 1.0 | 1000 | $1,200 | $1.20 | 19d | 1 | 0.59mi |
| 13501 Vernon Ave Warren, MI | 2.0 | 1.0 | 850 | $1,300 | $1.53 | 26d | 1 | 0.63mi |
| 20227 Pelkey St Detroit, MI | 3.0 | 1.0 | 968 | $1,350 | $1.39 | 19d | 1 | 0.64mi |
| 20242 Hickory St Detroit, MI | 3.0 | 1.0 | 747 | $1,300 | $1.74 | 13d | 1 | 0.67mi |
| 15663 Carlisle St Detroit, MI | 2.0 | 1.0 | 803 | $1,050 | $1.31 | 17d | 1 | 0.78mi |
| 20027 Alcoy St Detroit, MI | 3.0 | 1.0 | 1000 | $1,349 | $1.35 | 19d | 1 | 0.80mi |
| 14461 Lappin St Detroit, MI | 3.0 | 1.5 | 989 | $1,150 | $1.16 | 19d | 1 | 0.82mi |
| 13669 Pfent St Detroit, MI | 3.0 | 2.0 | 1031 | $1,374 | $1.33 | 19d | 1 | 0.88mi |
| 12846 Georgiana Ave Warren, MI | 3.0 | 1.0 | 912 | $1,300 | $1.43 | 26d | 1 | 0.91mi |
| 12807 Coleen Ave Warren, MI | 3.0 | 1.0 | 1080 | $1,250 | $1.16 | 26d | 1 | 0.94mi |
| 13050 Couwlier Ave Warren, MI | 3.0 | 1.0 | 850 | $1,320 | $1.55 | 0d | 1 | 0.95mi |
| 20296 Waltham St Detroit, MI | 3.0 | 1.5 | 986 | $1,300 | $1.32 | 19d | 1 | 1.03mi |
| 21412 Waltham Rd Warren, MI | 2.0 | 1.0 | 696 | $1,225 | $1.76 | 45d | 1 | 1.10mi |
| 19220 Alcoy St Detroit, MI | 3.0 | 1.0 | 1023 | $1,350 | $1.32 | 19d | 1 | 1.11mi |
| 21311 Waltham Rd Warren, MI | 3.0 | 1.0 | 1000 | $1,350 | $1.35 | 0d | 1 | 1.11mi |
| 20091 Barlow St Detroit, MI | 3.0 | 1.0 | 930 | $1,300 | $1.40 | 19d | 1 | 1.14mi |
| 20553 Hamburg St Detroit, MI | 3.0 | 1.0 | 1074 | $1,300 | $1.21 | 5d | 1 | 1.18mi |
| 19170 Joann St Detroit, MI | 4.0 | 1.0 | 1020 | $1,400 | $1.37 | 45d | 1 | 1.18mi |
| 16291 Eastburn St Detroit, MI | 3.0 | 1.0 | 1000 | $1,364 | $1.36 | 26d | 1 | 1.20mi |
| 22852 Sharrow Ave Warren, MI | 3.0 | 1.0 | 1000 | $1,400 | $1.40 | 7d | 1 | 1.21mi |
| 16410 Edmore Dr Detroit, MI | 3.0 | 1.0 | 850 | $1,250 | $1.47 | 17d | 1 | 1.24mi |
| 16225 Manning St Detroit, MI | 4.0 | 2.0 | 1036 | $1,475 | $1.42 | 45d | 1 | 1.25mi |
| 19143 Fairport St Detroit, MI | 3.0 | 1.0 | 1070 | $1,225 | $1.14 | 19d | 1 | 1.26mi |
| 15909 Maddelein St Detroit, MI | 3.0 | 1.0 | 894 | $1,266 | $1.42 | 45d | 1 | 1.29mi |
| 16212 Maddelein St Detroit, MI | 2.0 | 1.0 | 800 | $1,200 | $1.50 | 14d | 1 | 1.42mi |
| 18624 Fairport St Unit NA Detroit, MI | 3.0 | 1.0 | 924 | $1,450 | $1.57 | 26d | 1 | 1.45mi |
| 18624 Fairport St Detroit, MI | 3.0 | 1.0 | 874 | $1,450 | $1.66 | 23d | 1 | 1.45mi |
Listing history 11 events
-
2026-06-21days on market $160,000 Active 17 DOM
-
2026-06-18days on market $160,000 Active 14 DOM
-
2026-06-17days on market $160,000 Active 13 DOM
-
2026-06-16days on market $160,000 Active 12 DOM
-
2026-06-15days on market $160,000 Active 11 DOM
-
2026-06-13days on market $160,000 Active 9 DOM
-
2026-06-13days on market $160,000 Active 8 DOM
-
2026-06-09days on market $160,000 Active 5 DOM
-
2026-06-08days on market $160,000 Active 4 DOM
-
2026-06-07remarks 699-char remark
-
2026-06-07$160,000 Active 3 DOM
ⓘ Source: listings_history table (triggers on properties + properties_extension) + one-shot
backfill from property_details.listing_events for pre-trigger history.
Tax reassessment forecast MI · Partial reset (capped growth)
- Current annual tax
- $2,241 · $187/mo
- Projected year-2 tax
- $2,352 · $196/mo
- Expected delta
- +$112/yr (+$9/mo · 5.0%)
ⓘ Screening estimate from a state-policy table — verify with the county assessor before closing.
Climate risk First Street
- Flood 1/10 Low FEMA zone X (unshaded) · 0% chance over 30 yrs
- Wildfire 1/10 Low
- Heat 3/10 Moderate 7 d/yr ≥96°F today · 15 d/yr by 30 yrs out
- Wind 2/10 Low
- Air quality 3/10 Moderate 2 unhealthy d/yr today · 5 by 30 yrs out
Nearby sold comps map
Loading sold comps map…
Walkable amenities ~0.75 mi
Loading nearby amenities…
Taxation est. · year 1
- Rental income
- $16,295
- − Mortgage interest
- −$8,962
- − Property taxes
- −$2,241
- − Insurance
- −$800
- − Repairs & maintenance
- −$1,304
- − Management
- −$1,304
- − Depreciation
- −$4,655
- Taxable loss
- −$2,970
- Est. tax savings @ 24.0%
- +$713
- After-tax cash flow
- $477/yr
For passive investors: Depreciation is non-cash, so a rental often shows a tax loss while cash-flowing — sheltering income. Rental losses are passive: they offset passive income freely, and up to $25,000/yr can offset ordinary (W-2) income if you actively participate and your MAGI is under $100k (phasing out to $0 by $150k); unused losses carry forward. On sale, claimed depreciation is recaptured at up to 25%, and gains may owe capital-gains tax (a 1031 exchange can defer both). Figures are a year-1 estimate at your 24.0% rate — not tax advice; consult a CPA.
Schools (NCES district)
- District
- Detroit Public Schools Community District
- NCES district ID
- 2601103
- Math proficiency
- 10% ▼ -2.00%
- Reading proficiency
- 24% ▲ 6.00%
- Median HH income
- $25,815
- Composite
- 13.06/100
- National rank
- #9564
- State rank
- #499 of 540 in MI
Livability — Detroit
- Score
- 73/100
- State rank
- #218
- US rank
- #5427
Category grades
Schools grade is shown separately in the Schools card above.
Census & demographics
- Census place
- Detroit, MI
- County
- Wayne County · 1,562,939 people
- City population
- 572,865
- Metro
- Detroit-Warren-Dearborn, MI
- Population (ZIP)
- 34,187
- Household income
- $38,966
- Rent vs Own
- Severe rent burden
- 2121.0
Population outlook (Wayne County) Hauer SSP2
- Today (2025)
- 1,675,273 people
- By 2030
- 1,620,300 · -3.3%
- By 2040
- 1,502,341 · -10.3%
- By 2050
- 1,384,039 · -17.4%
- By 2075
- 1,124,592 · -32.9%
- By 2100
- 881,193 · -47.4%
Race, ethnicity, and origin ACS 2023
- Neighborhood character
- Predominantly Black (93%)
- Race & ethnicity
- Black 93% White 3% Two or more races 2%
- Foreign-born
- 1% · Canada
- Languages at home
- 98% English-only · Spanish 1%
Political lean MEDSL · Wayne
- 2024 margin
- Strong D (+29.0) · D 62.7% · R 33.7% · Other 3.6%
- 2008→2024 swing
- -20.5pp toward R · 2008: 49.5pp · 2024: 29.0pp
- All cycles
- 2024: D+29.0 2020: D+38.1 2016: D+37.3 2012: D+46.9 2008: D+49.5
Not yet ingested
- Civics
- —
Market trends
- HPI YoY
- ▼ -91.80%
- Current HPI
- 235.0926
- Rent YoY
- ▲ 1.33%
- Metro
- Detroit-Warren-Dearborn, MI
- State GDP YoY
- ▲ 1.37%
- F500 in state
- 28
Industry mix (Fortune 500 HQ in MI)
| Industry | F500 HQs | Revenue |
|---|---|---|
| Automotive Parts | 3 | $48B |
|
||
| Automotive | 2 | $372B |
|
||
| Chemicals | 1 | $45B |
|
||
| Automotive Retail | 1 | $29B |
|
||
| Healthcare / Medical Devices | 1 | $23B |
|
||
| Automotive Technology | 1 | $20B |
|
||
Price history
+45.6% since first listed33 events — show timeline
- 2026-06-04 Listed $160,000 REALCOMP
- 2026-06-04 Listed $160,000 MiRealSource-MiMLS
- 2026-02-19 Sold (Public Records) $61,200 Public Records
- 2026-02-17 Pending — MiRealSource-MiMLS
- 2026-02-17 Pending — REALCOMP
- 2026-02-17 Sold (MLS) $62,500 REALCOMP
- 2026-02-17 Sold (MLS) $62,500 MiRealSource-MiMLS
- 2025-11-07 Contingent — MiRealSource-MiMLS
- 2025-11-07 Contingent — REALCOMP
- 2025-06-30 Price Changed $69,900 MiRealSource-MiMLS
- 2025-06-30 Price Changed $69,900 REALCOMP
- 2025-06-19 Relisted — MiRealSource-MiMLS
- 2025-06-19 Pending — MiRealSource-MiMLS
- 2025-06-19 Relisted — REALCOMP
- 2025-06-19 Pending — REALCOMP
- 2025-06-16 Pending — REALCOMP
- 2025-05-13 Sold (MLS) $62,500 REALCOMP
- 2025-05-13 Sold (MLS) $62,500 MiRealSource-MiMLS
- 2025-04-24 Listed $74,900 REALCOMP
- 2025-04-24 Listed $74,900 MiRealSource-MiMLS
- 2025-03-05 Listing Removed — REALCOMP
- 2025-03-05 Listing Removed — MiRealSource-MiMLS
- 2024-11-18 Listed $79,900 MiRealSource-MiMLS
- 2024-11-18 Listed $79,900 REALCOMP
- 2024-11-11 Coming Soon — MiRealSource-MiMLS
- 2024-11-11 Coming Soon — REALCOMP
- 2013-03-05 Sold (Public Records) $45,670 Public Records
- 2012-11-05 Sold (Public Records) $54,000 Public Records
- 2011-12-20 Sold (Public Records) $52,600 Public Records
- 2004-03-01 Sold (Public Records) $109,900 Public Records
- 2003-12-17 Sold (MLS) $109,900 MiRealSource-MiMLS
- 2003-09-26 Listing Removed — MiRealSource-MiMLS
- 2003-09-20 Listed $109,900 MiRealSource-MiMLS
Property tax history
+2.3%/yrLatest (2025): $2,241 · +1.0% YoY. Source: county tax records.
Cash-flow waterfall
monthlySold comps — $/sqft
last 12 mo · ≤1 miLoading sold comps…