 5-Plex
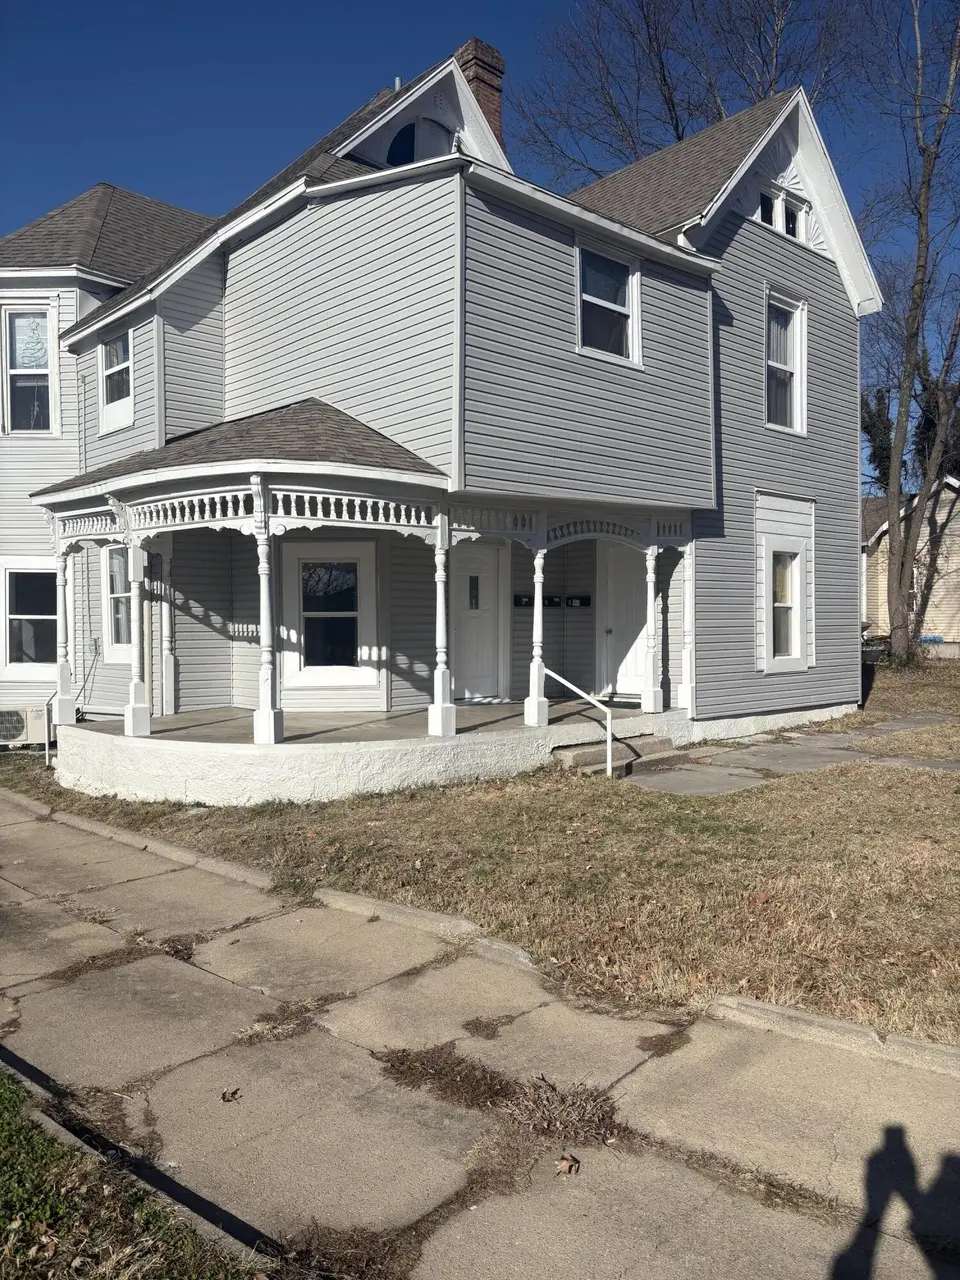
1711 N Washington Ave · Springfield, MO
Flood risk 1/10 · Minimal
- FEMA flood zone
- X (unshaded)
- Chance of flooding over 30 yrs
- 0.0%
- Est. flood insurance / yr
- $507 – $1,088
Fire risk 1/10 · Minimal
- Est. fire insurance / yr
- $1,054 – $1,958
Heat risk 5/10 · Moderate
- Hot days now (above 104°F)
- 7 days/yr
- Hot days in 30 yrs
- 19 days/yr
Wind risk 2/10 · Minimal
- Chance of severe wind over 30 yrs
- —
Air-quality risk 2/10 · Minimal
- Unhealthy air days now
- 1 days/yr
- Unhealthy air days in 30 yrs
- 2 days/yr
Risk factors via First Street. Map © Google.
Why this score? — see what drove the B grade
The composite is a weighted blend of 9 inputs, each scored 0–100. Each bar is that input's sub-score; the figure is the points it added to the 100-point composite (weight × sub-score).
- Cash flow +30.0/30.0
- 1% rule +10.0/10.0
- DSCR +10.0/10.0
- ARV discount +7.5/15.0
- Livability +3.8/5.0
- Rent growth +3.6/5.0
- Schools +3.2/10.0
- Condition / age +2.2/5.0
- Appreciation +0.0/10.0
$325,000
🖨 Deal sheet (PDF) 📄 Offer letter ✓ Due diligence
Multi-family units
County records classify this as Multi-Family (5+ Unit). Listing-text estimate: 5 units. confirmed
5+ unit building — per-unit beds/baths from public records are typically unavailable; the breakdown below (if shown) is an estimate from the listing text.
Listing remarks MLS
Great 5 plex, New Vinyl siding appliances, (refrigerators and electric ranges), all newer vynil windows, mini splits . New paint, new fixtures, new water heaters, new combo washer/dryer in common laundry room. Off street parking, located in the C-Street Redevelopment Area. Great Income, steady occupancy.
Key facts
- Newer vynil windows
- Combo washer dryer
- New paint
Tags
Neighborhood map
What this means for you Summary
Snapshot
- This is a 5 × 1-bed/1-bath units multifamily listed at $325k. Condition is rated fair.
Deal economics
- At list price, monthly cash flow is $2k ($20k/yr) — positive. Per door: $329/mo.
- The deal already cash-flows at list — no discount required.
- Meets the 1% rule at list price ($5k rent vs $325k).
- Recommended offer: $286k (12.0% below list) — sets the bar for market timing.
- Cap rate 12.4% vs local median 4.6% in Springfield — top-decile yield for the area; either an underpriced asset or a hidden risk that comps aren't pricing in. Stress-test before assuming the spread holds.
Location & tenants
- Location reads 75/100 on livability (#57 in MO, #4,121 nationally) — a middle-class / working-renter tenant base. Strengths: commute A+, cost of living A+, housing A+; Watch: crime F, employment F.
- Springfield R-XII (urban): math 32% / reading 46% proficiency, ranked #174 of 324 in MO (top 54%) — families likely to look elsewhere, expect single-tenant / working-renter base with shorter leases.
- Zoned schools: Boyd Elem. (math 8% / reading 22%, grade F, #982 of 1,115 statewide, top 89%, 175 students, 78% FRL); Pipkin Middle (math 20% / reading 29%, grade F, #324 of 391 statewide, top 83%, 340 students, 82% FRL) — zoned schools average 80% FRL vs 46% district-wide (33 pts higher); higher-poverty schools than district average — tighter screening recommended.
- Zoned-school proficiency averages 20% at this address vs 39% district-wide (-19 pts) — the specific schools serving this property underperform the Springfield R-XII average; the district grade overstates school quality for this exact location.
- Market conditions: Rents rising fast (+4.2%/yr); 401 active listings in the ZIP; 1,302 units permitted in Greene County in 2024 (250 in 5+ unit buildings).
Forward outlook
- Local home prices are declining (-3.0%/yr); year-one equity from $2k of loan paydown is wiped out by about $10k of value loss. Plan a longer hold.
- Greene County population projected at +25% by 2050 — long-run rental-demand tailwind backs the buy-and-hold thesis.
- At projected returns (-3.0% appreciation + 4.2% rent growth), your $91k cash investment doubles in ~6 years — after that, you're playing with house money.
Negotiation context
- It's been on market 148 days — a 12% lower offer ($286k) is reasonable based on typical stale-listing flexibility.
- 5 sale attempts since 6y ago; this cycle's ask has dropped $24k (7%) from the opening price — seller is motivated, your offer sets the floor, not the list.
Risks & watch-outs
- Watch-outs: built in 1921 — expect roof / HVAC / electrical / plumbing capex.
- Climate carrying-cost: extreme-heat days projected 7→19/yr by 2055 (HVAC capex compounding) — expect insurance premiums to compound above CPI over the hold.
Questions for the listing agent
- It's been on market 148 days. Have you received any prior offers? Is the seller open to a 12% concession, seller financing, or rate buy-down credit?
- Can we see the unit-by-unit rent roll, current vacancy, and any below-market leases? What's the average tenancy length?
- What capital expenditures (roof, boiler, parking lot, exteriors) have been made in the last 5 years, and what's planned in the next 2?
- Have any recent inspections been done? Can we get a copy of the seller's disclosures and any deferred-maintenance estimates?
- Built in 1921 — when were the roof, HVAC, electrical panel, plumbing, and water heater last replaced?
- Why hasn't it sold? Are there any deal-killer items the seller is aware of (foundation, flood, title, zoning, code violations)?
- Is there a deadline driving the sale (1031 exchange, divorce, estate, relocation)? That informs how much negotiation room exists.
- Crime grade is F in this area — have there been break-ins, vandalism, or insurance claims at this property in the last 3 years? What carrier currently insures it and at what premium?
- What's the average days-on-market for RENTAL listings here right now (not sales)? A rising rental-DOM trend means longer vacancies and softer asking-rent achievability than the comps imply.
- What's the recent tenant-quality profile in this submarket — average credit score on applications, eviction rate, late-payment / NSF rate, and stable-employment percentage? A property-management company in the area should have these aggregated.
- How much new apartment / multifamily construction is in the pipeline within 1–3 miles? Heavy new supply (>2% of stock underway) typically softens rents 12–24 months out; light construction supports rent growth.
Investment metrics
- 1% rule
- 1.52% ✓
- Cap rate
- 12.36%
- Cash-on-cash
- 21.68%
- DSCR
- 1.96
- GRM
- 5.5
CMA / ARV
- ARV (median comp)
- $214,087
- List price
- $325,000
- Delta
- 51.81%
- Verdict
- OVERPRICED
- Comps
- 16 within 1.0 mi
Projected returns pro-forma
-3.0% appreciation · 4.24% rent growth · sell at horizon
- IRR
- 15.7%
- Equity multiple
- 1.64×
- Total profit
- $58,334
- Equity at exit
- $48,459
- IRR
- 25.3%
- Equity multiple
- 3.33×
- Total profit
- $212,095
- Equity at exit
- $28,100
Cash invested: $91,000 (down + closing). Projections, not guarantees.
Landlord ↔ Tenant lean methodology
- Overall (STATE)
- 81 Strongly Landlord-Friendly
- State Missouri
- 81 Strongly Landlord-Friendly · R+10
- County
- — inherits STATE
- City
- — inherits STATE
ZIP-level market 65803
- Home prices YoY
- -29.8%
- Rents YoY
- 4.2%
- Active inventory
- 401
- Price-to-rent
- 27.5×
Monthly cashflow live
- Estimated rent
- $4,924 high interval (Pro) →
- Mortgage (P&I)
- −$1,704
- Tax est. 1.5%
- −$406 /mo · $4,875/yr
- Insurance
- −$135
- HOA
- −$0
- Vacancy / Maint / Mgmt
- −$1,034
- Net cashflow
- $1,644
Break-even live
Sensitivity live
| Price | -10% $1,869 | -5% $1,756 | +0% $1,644 | +5% $1,532 | +10% $1,419 |
|---|---|---|---|---|---|
| Rent | -10% $1,255 | -5% $1,449 | +0% $1,644 | +5% $1,838 | +10% $2,033 |
| Rate | -1.0pp $1,808 | -0.5pp $1,727 | base $1,644 | +0.5pp $1,560 | +1.0pp $1,474 |
5-unit breakdown (identical units grouped — click to expand)
| Units | Beds | Baths | Est. rent |
|---|---|---|---|
| 5× units | 1 | 1 | $4,925 |
| #1 | 1 | 1 | $985 |
| #2 | 1 | 1 | $985 |
| #3 | 1 | 1 | $985 |
| #4 | 1 | 1 | $985 |
| #5 | 1 | 1 | $985 |
| Total (5 units) | $4,924 | ||
UW: 25.0% down · 7.5% · 30yr · 1.5% tax · 5.0% vac · 8.0% maint · 8.0% mgmt
Financing live
Cash to close
- Down payment
- $81,250
- Closing costs
- $9,750
- Reserves months
- —
- Total cash needed
- —
Loan-product check · same deal, 3 products live
Conventional
25% down · 7.5% · 30yr
- Down + closing
- —
- Monthly P&I
- —
- Monthly cashflow
- —
- DSCR
- —
- Eligible?
- —
Personal DTI + credit; lowest rate.
DSCR
20% down · 8.5% · 30yr
- Down + closing
- —
- Monthly P&I
- —
- Monthly cashflow
- —
- DSCR
- —
- Eligible?
- —
No personal income docs; deal must DSCR.
Hard money
10% down · 12.0% · 12mo
- Down + closing
- —
- Monthly P&I
- —
- Monthly cashflow
- —
- DSCR
- —
- Eligible?
- —
Short-term bridge; refi at stabilization.
Listing history 22 events
-
2026-06-22days on market $325,000 Active 148 DOM
-
2026-06-18days on market $325,000 Active 145 DOM
-
2026-06-17days on market $325,000 Active 144 DOM
-
2026-06-16days on market $325,000 Active 143 DOM
-
2026-06-15days on market $325,000 Active 142 DOM
-
2026-06-14days on market $325,000 Active 140 DOM
-
2026-06-10days on market $325,000 Active 137 DOM
-
2026-06-09days on market $325,000 Active 136 DOM
-
2026-06-08days on market $325,000 Active 135 DOM
-
2026-06-07days on market $325,000 Active 134 DOM
-
2026-06-03days on market $325,000 Active 130 DOM
-
2026-06-02days on market $325,000 Active 129 DOM
-
2026-06-01days on market $325,000 Active 128 DOM
-
2026-05-31days on market $325,000 Active 127 DOM
-
2026-05-30days on market $325,000 Active 126 DOM
-
2026-03-05status Active 306-char remark
Show marketing remark (306 chars)
Great 5 plex, New Vinyl siding appliances, (refrigerators and electric ranges), all newer vynil windows, mini splits . New paint, new fixtures, new water heaters, new combo washer/dryer in common laundry room. Off street parking, located in the C-Street Redevelopment Area. Great Income, steady occupancy.
-
2025-10-16status Active 306-char remark
Show marketing remark (306 chars)
Great 5 plex, New Vinyl siding appliances, (refrigerators and electric ranges), all newer vynil windows, mini splits . New paint, new fixtures, new water heaters, new combo washer/dryer in common laundry room. Off street parking, located in the C-Street Redevelopment Area. Great Income, steady occupancy.
-
2025-06-02$349,500 Active 306-char remark
Show marketing remark (306 chars)
Great 5 plex, New Vinyl siding appliances, (refrigerators and electric ranges), all newer vynil windows, mini splits . New paint, new fixtures, new water heaters, new combo washer/dryer in common laundry room. Off street parking, located in the C-Street Redevelopment Area. Great Income, steady occupancy.
-
2025-04-24soldstatus Closed 306-char remark
Show marketing remark (306 chars)
Great 5 plex, New Vinyl siding appliances, (refrigerators and electric ranges), all newer vynil windows, mini splits . New paint, new fixtures, new water heaters, new combo washer/dryer in common laundry room. Off street parking, located in the C-Street Redevelopment Area. Great Income, steady occupancy.
-
2025-03-15$349,500 Active 306-char remark
Show marketing remark (306 chars)
Great 5 plex, New Vinyl siding appliances, (refrigerators and electric ranges), all newer vynil windows, mini splits . New paint, new fixtures, new water heaters, new combo washer/dryer in common laundry room. Off street parking, located in the C-Street Redevelopment Area. Great Income, steady occupancy.
-
2021-01-26soldstatus 131-char remark
Show marketing remark (131 chars)
Cash flow galore!! This apartment complex has 2-1 bedroom units and 3 efficiency units. Seller rents by the week or month to month.
-
2020-10-19$168,000 131-char remark
Show marketing remark (131 chars)
Cash flow galore!! This apartment complex has 2-1 bedroom units and 3 efficiency units. Seller rents by the week or month to month.
ⓘ Source: listings_history table (triggers on properties + properties_extension) + one-shot
backfill from property_details.listing_events for pre-trigger history.
Climate risk First Street
- Flood 1/10 Low FEMA zone X (unshaded) · 0% chance over 30 yrs
- Wildfire 1/10 Low
- Heat 5/10 Major 7 d/yr ≥104°F today · 19 d/yr by 30 yrs out
- Wind 2/10 Low
- Air quality 2/10 Low 1 unhealthy d/yr today · 2 by 30 yrs out
Nearby sold comps map
Loading sold comps map…
Walkable amenities ~0.75 mi
Loading nearby amenities…
Taxation est. · year 1
- Rental income
- $59,088
- − Mortgage interest
- −$18,205
- − Property taxes
- −$4,875
- − Insurance
- −$1,625
- − Repairs & maintenance
- −$4,727
- − Management
- −$4,727
- − Depreciation
- −$9,455
- Taxable income
- $15,474
- Est. tax owed @ 24.0%
- −$3,714
- After-tax cash flow
- $16,014/yr
For passive investors: Depreciation is non-cash, so a rental often shows a tax loss while cash-flowing — sheltering income. Rental losses are passive: they offset passive income freely, and up to $25,000/yr can offset ordinary (W-2) income if you actively participate and your MAGI is under $100k (phasing out to $0 by $150k); unused losses carry forward. On sale, claimed depreciation is recaptured at up to 25%, and gains may owe capital-gains tax (a 1031 exchange can defer both). Figures are a year-1 estimate at your 24.0% rate — not tax advice; consult a CPA.
Condition & rehab AI · 13 photos
The property is in fair condition with some exterior repairs and maintenance needed. Painting the exterior siding and maintaining the landscaping will significantly increase its value.
Repairs flagged
- Major Exterior siding — The exterior siding is weathered and in need of repainting.
- Major Landscaping — The landscaping is overgrown and unkempt, requiring trimming and maintenance.
Value-add opportunities
- Both Painting the exterior siding — Painting the exterior siding will improve the curb appeal and increase the property's value.
- Both Landscaping maintenance — Maintaining the landscaping will improve the property's curb appeal and increase its rental value.
Renovation cost estimate screening
| Repair item | Severity | Est. cost |
|---|---|---|
| Exterior siding · The exterior siding is weathered and in need of repainting. | Major | $15,000–50,000 |
| Landscaping · The landscaping is overgrown and unkempt, requiring trimming and maintenance. | Major | $15,000–50,000 |
| Total estimated repair cost · 2 items | $30,000–100,000 |
Value-add ROI direction
- Both Painting the exterior siding — Painting the exterior siding will improve the curb appeal and increase the property's value. ↑
- Both Landscaping maintenance — Maintaining the landscaping will improve the property's curb appeal and increase its rental value. ↑
ⓘ Cost ranges are severity-bucket heuristics (US national rule-of-thumb). Get contractor quotes + a written scope before underwriting a rehab budget.
Schools (NCES district)
- District
- Springfield R-XII
- NCES district ID
- 2928860
- Math proficiency
- 32% ▼ -2.00%
- Reading proficiency
- 46% ▼ -3.00%
- Median HH income
- $37,886
- Composite
- 32.45/100
- National rank
- #5717
- State rank
- #174 of 324 in MO
Livability — Springfield
- Score
- 75/100
- State rank
- #57
- US rank
- #4121
Category grades
Schools grade is shown separately in the Schools card above.
Census & demographics
- Census place
- Springfield, MO
- County
- Greene County · 244,327 people
- City population
- 223,044
- Metro
- Springfield, MO
- Population (ZIP)
- 42,882
- Household income
- $50,572
- Rent vs Own
- Severe rent burden
- 1305.0
Population outlook (Greene County) Hauer SSP2
- Today (2025)
- 319,054 people
- By 2030
- 335,135 · +5.0%
- By 2040
- 366,186 · +14.8%
- By 2050
- 397,431 · +24.6%
- By 2075
- 477,035 · +49.5%
- By 2100
- 520,828 · +63.2%
Race, ethnicity, and origin ACS 2023
- Neighborhood character
- Predominantly White (82%)
- Race & ethnicity
- White 82% Two or more races 9% Hispanic / Latino 6% Black 4%
- Hispanic origin (detail)
- Mexican 2% Puerto Rican 2%
- Common ancestry
- Lithuanian 2% Italian 2% Iranian 2%
- Foreign-born
- 3% · Canada
- Languages at home
- 95% English-only · Spanish 3%
Political lean MEDSL · Greene
- 2024 margin
- Strong R (+20.8) · D 38.9% · R 59.7% · Other 1.4%
- 2008→2024 swing
- -5.0pp toward R · 2008: -15.8pp · 2024: -20.8pp
- All cycles
- 2024: R+20.8 2020: R+20.1 2016: R+27.4 2012: R+24.4 2008: R+15.8
Not yet ingested
- Civics
- —
Market trends
- HPI YoY
- ▼ -87.08%
- Current HPI
- 205.0439
- Rent YoY
- ▲ 4.24%
- Metro
- Springfield, MO
- State GDP YoY
- ▲ 1.84%
- F500 in state
- 20
Industry mix (Fortune 500 HQ in MO)
| Industry | F500 HQs | Revenue |
|---|---|---|
| Healthcare | 1 | $163B |
|
||
| Insurance | 1 | $21B |
|
||
| Industrial Technology | 1 | $17B |
|
||
| Retail | 1 | $16B |
|
||
| Industrial Distribution | 1 | $10B |
|
||
| Utilities | 1 | $9B |
|
||
Price history
+108.0% since first listed7 events — show timeline
- 2026-03-05 Relisted — SOMO
- 2025-10-16 Relisted — SOMO
- 2025-06-02 Listed $349,500 SOMO
- 2025-04-24 Sold (MLS) — SOMO
- 2025-03-15 Listed $349,500 SOMO
- 2021-01-26 Sold (MLS) — SOMO
- 2020-10-19 Listed $168,000 SOMO
Cash-flow waterfall
monthlySold comps — $/sqft
last 12 mo · ≤1 miLoading sold comps…