1516 Avocado Blvd · Bunnell, FL
Flood risk 4/10 · Minor
- FEMA flood zone
- X (unshaded)
- Chance of flooding over 30 yrs
- 0.2%
- Est. flood insurance / yr
- $507 – $1,088
Fire risk 5/10 · Moderate
- Est. fire insurance / yr
- $947 – $1,759
Heat risk 9/10 · Severe
- Hot days now (above 108°F)
- 7 days/yr
- Hot days in 30 yrs
- 19 days/yr
Wind risk 9/10 · Severe
- Chance of severe wind over 30 yrs
- 99.0%
Air-quality risk 2/10 · Minimal
- Unhealthy air days now
- 2 days/yr
- Unhealthy air days in 30 yrs
- 2 days/yr
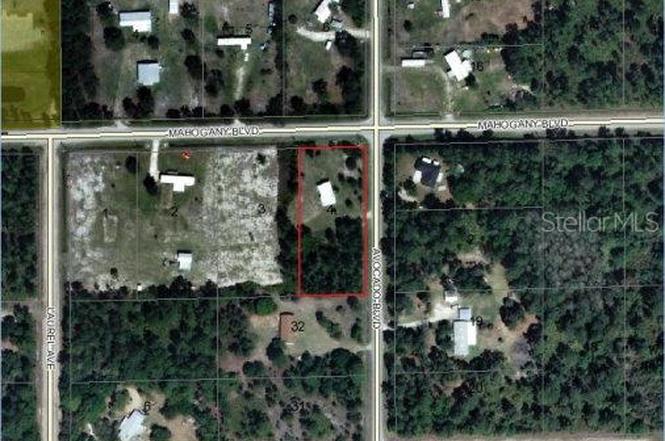
Risk factors via First Street. Map © Google.
Why this score? — see what drove the B- grade
The composite is a weighted blend of 9 inputs, each scored 0–100. Each bar is that input's sub-score; the figure is the points it added to the 100-point composite (weight × sub-score).
- Cash flow +28.1/30.0
- DSCR +10.0/10.0
- ARV discount +8.4/15.0
- 1% rule +7.0/10.0
- Schools +4.6/10.0
- Livability +3.6/5.0
- Rent growth +2.5/5.0
- Condition / age +2.5/5.0
- Appreciation +0.0/10.0
$120,000
🖨 Deal sheet (PDF) 📄 Offer letter ✓ Due diligence
Listing remarks MLS
Large, almost 1 acre corner lot located in Daytona North area of Bunnell. ALL CONTRACTS/OFFERS ARE SUBJECT TO ONEWEST SENIOR MANAGEMENT APPROVAL AND ANY OFFERS OR COUNTER OFFERS BY ONEWEST ARE NOT BINDING UNLESS THE ENTIRE AGREEMENT IS RATIFIED BY ALL PARTIES. Please include proof of funds with all cash offers. ; Paid Sewer:0;
Key facts
- Well house
- Corner lot
- Paved streets
Tags
Property features AI
Finance
- Other: Property type: Residential; Property subtype: Manufactured Home; Zoning: MH-1; Living area reported as 934 square feet; Contains 1 well and 1 septic system; Road surface: Paved
- Financial info: No lease restrictions; Unfurnished
- HOA & community: No HOA/association reported; Development: Not Assigned
Exterior
- Parking: No parking details provided
- Security: No security features reported
- Utilities: Well water; Septic tank; Electricity available; Water service available
- Home design: Manufactured double-wide home; Single-story; East-facing
- Construction: Vinyl siding; Shingle roof; Crawlspace foundation; Other foundation type; Built on a 0.93-acre lot (approximately 1/2 to less than 1 acre)
- Exterior features: Sliding doors
Interior
- Kitchen: No appliances reported
- Bedrooms: 2 bedrooms
- Flooring: Other flooring type
- Bathrooms: 2 full bathrooms
- Heating & cooling: Other heating; Central air conditioning
- Interior features: No notable built-in interior features reported
- Laundry & utility: Indoor laundry room
Neighborhood map
What this means for you Summary
Snapshot
- This is a 2-bed/2.0-bath manufactured listed at $120k.
Deal economics
- At list price, monthly cash flow is $377 ($5k/yr) — positive.
- The deal already cash-flows at list — no discount required.
- Meets the 1% rule at list price ($1k rent vs $120k).
- Recommended offer: $109k (9.0% below list) — sets the bar for market timing.
- Cap rate 10.1% vs local median 3.5% in Bunnell — top-decile yield for the area; either an underpriced asset or a hidden risk that comps aren't pricing in. Stress-test before assuming the spread holds.
Location & tenants
- Location reads 71/100 on livability (#378 in FL) — a middle-class / working-renter tenant base. Strengths: crime A+, cost of living A+, health & safety A+; Watch: amenities F, commute F, employment F.
- Flagler (rural): math 53% / reading 56% proficiency, ranked #20 of 73 in FL (top 27%) — acceptable for families but not a draw, mixed tenant base, ~2y average lease.
- Zoned schools: Bunnell Elementary School (math 42% / reading 44%, grade F, #1,366 of 2,144 statewide, top 64%, 1,080 students, 73% FRL); Buddy Taylor Middle School (math 50% / reading 45%, grade C-, #288 of 571 statewide, top 51%, 1,343 students, 63% FRL); Flagler-Palm Coast High School (math 36% / reading 51%, grade F, #248 of 667 statewide, top 38%, 2,523 students, 52% FRL).
- Market conditions: 281 active listings in the ZIP; 2,588 units permitted in Flagler County in 2024 (0 in 5+ unit buildings).
Forward outlook
- Local home prices are declining (-3.0%/yr); year-one equity from $830 of loan paydown is wiped out by about $4k of value loss. Plan a longer hold.
- Flagler County population projected at +28% by 2050 — long-run rental-demand tailwind backs the buy-and-hold thesis.
- At projected returns (-3.0% appreciation + 3.0% rent growth), your $34k cash investment doubles in ~9 years — after that, you're playing with house money.
Negotiation context
- It's been on market 116 days — a 9% lower offer ($109k) is reasonable based on typical stale-listing flexibility.
- 3 sale attempts since 13y ago with the ask held roughly flat each time — persistent listings suggest the price (not the market) is what's stuck; bring a comps-based counter.
- Current owner paid $8k; list at $120k implies a 1312% gain — meaningful room to come down on a strong offer.
Risks & watch-outs
- Climate carrying-cost: severe wind risk, 99% chance of damaging wind over 30y; moderate wildfire risk; extreme-heat days projected 7→19/yr by 2055 (HVAC capex compounding) — expect insurance premiums to compound above CPI over the hold.
Questions for the listing agent
- It's been on market 116 days. Have you received any prior offers? Is the seller open to a 9% concession, seller financing, or rate buy-down credit?
- Why hasn't it sold? Are there any deal-killer items the seller is aware of (foundation, flood, title, zoning, code violations)?
- Is there a deadline driving the sale (1031 exchange, divorce, estate, relocation)? That informs how much negotiation room exists.
- What's the average days-on-market for RENTAL listings here right now (not sales)? A rising rental-DOM trend means longer vacancies and softer asking-rent achievability than the comps imply.
- What's the recent tenant-quality profile in this submarket — average credit score on applications, eviction rate, late-payment / NSF rate, and stable-employment percentage? A property-management company in the area should have these aggregated.
- How much new for-sale + rental construction is in the pipeline within 1–3 miles? Heavy new supply typically softens prices + rents 12–24 months out; constrained supply supports both.
Investment metrics
- 1% rule
- 1.20% ✓
- Cap rate
- 10.06%
- Cash-on-cash
- 13.47%
- DSCR
- 1.60
- GRM
- 7.0
CMA / ARV
- ARV (on-the-fly)
- $122,354
- Comps found
- 3
Show comp detail 3 sales within ~0.75 mi
| Address | Dist | Beds/Ba | Sqft | Sold | Price | $/sf | Match |
|---|---|---|---|---|---|---|---|
| 6008 Mahogany Blvd | 0.07mi | 3/1.5 (+1) | 840 (-10%) | 4mo | $110,000 | $131 | 69 |
| 1817 Water Oak Rd | 0.70mi | 2/2.0 | 924 (-1%) | 13mo | $63,000 | $68 | 55 |
| 2089 Guava Ln | 0.66mi | 2/2.0 | 1,038 (+11%) | 3mo | $180,000 | $173 | 48 |
Match score weights: distance 35% · size 25% · config 20% · recency 20%. Top-matched comps best support the ARV.
Projected returns pro-forma
-3.0% appreciation · 3.0% rent growth · sell at horizon
- IRR
- 3.5%
- Equity multiple
- 1.14×
- Total profit
- $4,550
- Equity at exit
- $17,892
- IRR
- 13.0%
- Equity multiple
- 2.04×
- Total profit
- $34,796
- Equity at exit
- $10,375
Cash invested: $33,600 (down + closing). Projections, not guarantees.
Landlord ↔ Tenant lean methodology
- Overall (STATE)
- 87 Strongly Landlord-Friendly
- State Florida
- 87 Strongly Landlord-Friendly · R+3
- County
- — inherits STATE
- City
- — inherits STATE
ZIP-level market 32110
- Home prices YoY
- -22.4%
- Active inventory
- 281
- Price-to-rent
- 7.0×
Monthly cashflow live
- Estimated rent
- $1,435 medium interval (Pro) →
- Mortgage (P&I)
- −$629
- Tax from tax record
- −$77 /mo · $924/yr
- Insurance
- −$50
- HOA
- −$0
- Vacancy / Maint / Mgmt
- −$301
- Net cashflow
- $377
Break-even live
Sensitivity live
| Price | -10% $445 | -5% $411 | +0% $377 | +5% $343 | +10% $309 |
|---|---|---|---|---|---|
| Rent | -10% $264 | -5% $320 | +0% $377 | +5% $434 | +10% $490 |
| Rate | -1.0pp $438 | -0.5pp $408 | base $377 | +0.5pp $346 | +1.0pp $314 |
UW: 25.0% down · 7.5% · 30yr · 1.5% tax · 5.0% vac · 8.0% maint · 8.0% mgmt
Financing live
Cash to close
- Down payment
- $30,000
- Closing costs
- $3,600
- Reserves months
- —
- Total cash needed
- —
Loan-product check · same deal, 3 products live
Conventional
25% down · 7.5% · 30yr
- Down + closing
- —
- Monthly P&I
- —
- Monthly cashflow
- —
- DSCR
- —
- Eligible?
- —
Personal DTI + credit; lowest rate.
DSCR
20% down · 8.5% · 30yr
- Down + closing
- —
- Monthly P&I
- —
- Monthly cashflow
- —
- DSCR
- —
- Eligible?
- —
No personal income docs; deal must DSCR.
Hard money
10% down · 12.0% · 12mo
- Down + closing
- —
- Monthly P&I
- —
- Monthly cashflow
- —
- DSCR
- —
- Eligible?
- —
Short-term bridge; refi at stabilization.
Listing history 10 events
-
2026-06-03days on market $120,000 Active 116 DOM
-
2026-06-02days on market $120,000 Active 115 DOM
-
2026-06-01days on market $120,000 Active 114 DOM
-
2026-05-31days on market $120,000 Active 113 DOM
-
2026-02-25status Active
-
2026-02-23status Pending
-
2026-02-04$120,000 Active
-
2013-03-08soldstatus $8,500 328-char remark
Show marketing remark (328 chars)
Large, almost 1 acre corner lot located in Daytona North area of Bunnell. ALL CONTRACTS/OFFERS ARE SUBJECT TO ONEWEST SENIOR MANAGEMENT APPROVAL AND ANY OFFERS OR COUNTER OFFERS BY ONEWEST ARE NOT BINDING UNLESS THE ENTIRE AGREEMENT IS RATIFIED BY ALL PARTIES. Please include proof of funds with all cash offers. ; Paid Sewer:0;
-
2013-01-28$8,500 328-char remark
Show marketing remark (328 chars)
Large, almost 1 acre corner lot located in Daytona North area of Bunnell. ALL CONTRACTS/OFFERS ARE SUBJECT TO ONEWEST SENIOR MANAGEMENT APPROVAL AND ANY OFFERS OR COUNTER OFFERS BY ONEWEST ARE NOT BINDING UNLESS THE ENTIRE AGREEMENT IS RATIFIED BY ALL PARTIES. Please include proof of funds with all cash offers. ; Paid Sewer:0;
-
2006-02-16soldstatus $65,000
ⓘ Source: listings_history table (triggers on properties + properties_extension) + one-shot
backfill from property_details.listing_events for pre-trigger history.
Tax reassessment forecast FL · Resets to sale price
- Current annual tax
- $924 · $77/mo
- Projected year-2 tax
- $996 · $83/mo
- Expected delta
- +$72/yr (+$6/mo · 7.8%)
ⓘ Screening estimate from a state-policy table — verify with the county assessor before closing.
Climate risk First Street
- Flood 4/10 Moderate FEMA zone X (unshaded) · 20% chance over 30 yrs
- Wildfire 5/10 Major
- Heat 9/10 Extreme 7 d/yr ≥108°F today · 19 d/yr by 30 yrs out
- Wind 9/10 Extreme 99% chance of damaging wind over 30 yrs
- Air quality 2/10 Low 2 unhealthy d/yr today · 2 by 30 yrs out
Nearby sold comps map
Loading sold comps map…
Walkable amenities ~0.75 mi
Loading nearby amenities…
Taxation est. · year 1
- Rental income
- $17,216
- − Mortgage interest
- −$6,722
- − Property taxes
- −$924
- − Insurance
- −$600
- − Repairs & maintenance
- −$1,377
- − Management
- −$1,377
- − Depreciation
- −$3,491
- Taxable income
- $2,725
- Est. tax owed @ 24.0%
- −$654
- After-tax cash flow
- $3,871/yr
For passive investors: Depreciation is non-cash, so a rental often shows a tax loss while cash-flowing — sheltering income. Rental losses are passive: they offset passive income freely, and up to $25,000/yr can offset ordinary (W-2) income if you actively participate and your MAGI is under $100k (phasing out to $0 by $150k); unused losses carry forward. On sale, claimed depreciation is recaptured at up to 25%, and gains may owe capital-gains tax (a 1031 exchange can defer both). Figures are a year-1 estimate at your 24.0% rate — not tax advice; consult a CPA.
Schools (NCES district)
- District
- Flagler
- NCES district ID
- 1200540
- Math proficiency
- 53% ▼ -9.00%
- Reading proficiency
- 56% ▼ -4.00%
- Median HH income
- $48,354
- Composite
- 46.35/100
- National rank
- #2464
- State rank
- #20 of 73 in FL
Livability — Bunnell
- Score
- 71/100
- State rank
- #378
- US rank
- #6714
Category grades
Schools grade is shown separately in the Schools card above.
Census & demographics
- Population (ZIP)
- 9,877
Population outlook (Flagler County) Hauer SSP2
- Today (2025)
- 123,474 people
- By 2030
- 131,864 · +6.8%
- By 2040
- 146,176 · +18.4%
- By 2050
- 157,398 · +27.5%
- By 2075
- 177,990 · +44.2%
- By 2100
- 183,381 · +48.5%
Race, ethnicity, and origin ACS 2023
- Neighborhood character
- Predominantly White (81%)
- Race & ethnicity
- White 81% Black 11% Two or more races 6% Hispanic / Latino 3%
- Common ancestry
- Romanian 6% Lithuanian 2% Slovak 2%
- Foreign-born
- 2% · Canada
- Languages at home
- 97% English-only · Spanish 2%
Political lean MEDSL · Flagler
- 2024 margin
- Strong R (+28.2) · D 35.6% · R 63.8%
- 2008→2024 swing
- -29.8pp toward R · 2008: 1.6pp · 2024: -28.2pp
- All cycles
- 2024: R+28.2 2020: R+20.8 2016: R+20.6 2012: R+7.4 2008: D+1.6
Not yet ingested
- Civics
- —
Market trends
- HPI YoY
- ▼ -78.28%
- Current HPI
- 271.446
- Rent YoY
- —
- Metro
- —
- State GDP YoY
- ▲ 3.28%
- F500 in state
- 36
Industry mix (Fortune 500 HQ in FL)
| Industry | F500 HQs | Revenue |
|---|---|---|
| Industrial Technology | 2 | $29B |
|
||
| Insurance | 2 | $17B |
|
||
| Retail | 1 | $60B |
|
||
| Technology Distribution | 1 | $58B |
|
||
| Homebuilding | 1 | $35B |
|
||
| Technology Manufacturing | 1 | $35B |
|
||
Price history
+84.6% since first listed6 events — show timeline
- 2026-02-25 Relisted — Stellar MLS as Distributed by MLS Grid
- 2026-02-23 Pending — Stellar MLS as Distributed by MLS Grid
- 2026-02-04 Listed $120,000 Stellar MLS as Distributed by MLS Grid
- 2013-03-08 Sold (MLS) $8,500 Stellar MLS as Distributed by MLS Grid
- 2013-01-28 Listed $8,500 Stellar MLS as Distributed by MLS Grid
- 2006-02-16 Sold (Public Records) $65,000 Public Records
Property tax history
+4.8%/yrLatest (2025): $924 · +6.0% YoY. Source: county tax records.
Cash-flow waterfall
monthlySold comps — $/sqft
last 12 mo · ≤1 miLoading sold comps…