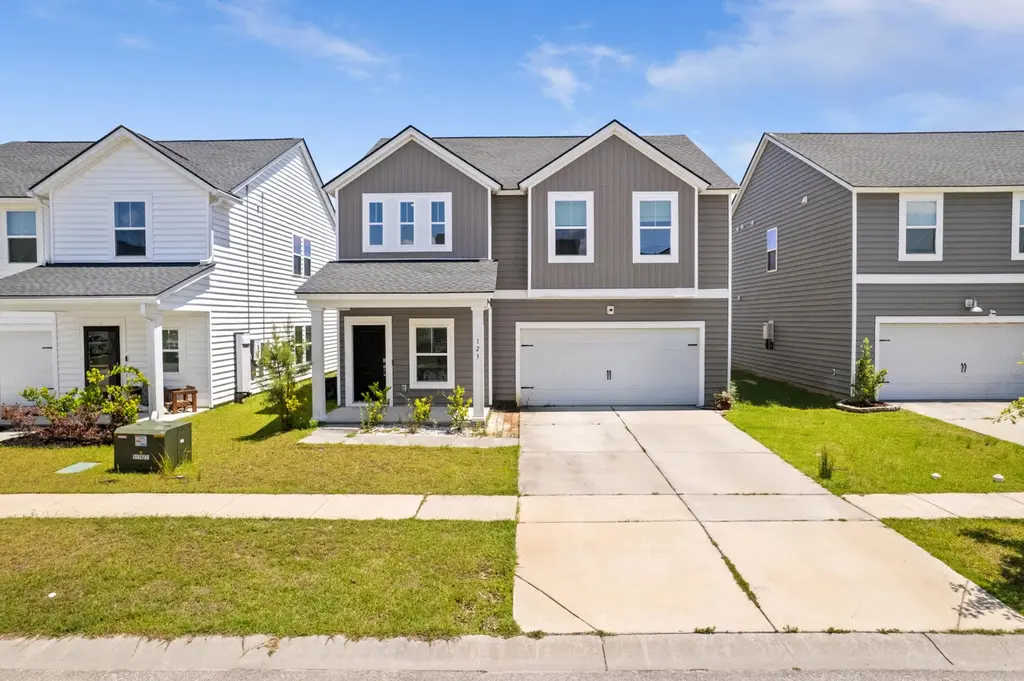
123 Whisper Dr · North Charleston, SC
Flood risk 1/10 · Minimal
- FEMA flood zone
- X (unshaded)
- Chance of flooding over 30 yrs
- 0.0%
- Est. flood insurance / yr
- $507 – $1,088
Fire risk 4/10 · Minor
- Est. fire insurance / yr
- $783 – $1,453
Heat risk 8/10 · Major
- Hot days now (above 109°F)
- 7 days/yr
- Hot days in 30 yrs
- 17 days/yr
Wind risk 8/10 · Major
- Chance of severe wind over 30 yrs
- 99.0%
Air-quality risk 2/10 · Minimal
- Unhealthy air days now
- 2 days/yr
- Unhealthy air days in 30 yrs
- 2 days/yr
Risk factors via First Street. Map © Google.
Why this score? — see what drove the D grade
The composite is a weighted blend of 9 inputs, each scored 0–100. Each bar is that input's sub-score; the figure is the points it added to the 100-point composite (weight × sub-score).
- Cash flow +10.5/30.0
- ARV discount +9.5/15.0
- Schools +4.1/10.0
- Condition / age +4.0/5.0
- Rent growth +3.5/5.0
- 1% rule +3.3/10.0
- Livability +3.3/5.0
- DSCR +3.0/10.0
- Appreciation +0.0/10.0
$330,000
🖨 Deal sheet 📄 Offer letter ✓ Due diligence
Listing remarks MLS
For comp purposes only
Key facts
- Open floor plan
- Modern appliances
- Backyard oasis
Tags
Property features AI
Finance
- HOA & community: HOA fee $300 quarterly; Community features include pool, park, and walk/jog trails
Exterior
- Parking: Attached 2-car garage
- Utilities: Public sewer; Dominion Energy; Dorchester County Water and Sewer service
- Home design: Single family detached residence; Two stories; Fee simple ownership
- Construction: No additional structures reported
- Exterior features: Wooden enclosed fence; Architectural roof; Level lot; Lot size between 0 and 0.5 acre; Community pool, park, and walk/jog trails
Interior
- Kitchen: Disposal; Gas range; Microwave; Tankless water heater
- Bedrooms: 4 bedrooms; Primary bedroom located on upper level with walk-in closet
- Flooring: Carpet; Laminate; Vinyl
- Bathrooms: 2.5 bathrooms (3 total)
- Heating & cooling: Central air; Forced air heating; Natural gas heating
- Interior features: Kitchen island; Walk-in closet(s); Ceiling fan(s); Eat-in kitchen; Living/dining combo; Pantry
- Laundry & utility: Laundry room; Washer hookup; Electric dryer hookup
Neighborhood map
What this means for you Summary
Snapshot
- This is a 4-bed/2.0-bath single-family listed at $330k. Condition is rated good.
Deal economics
- At list price, monthly cash flow is $-167 ($-2k/yr) — negative.
- To cash-flow at today's rent, offer at most $300k (9.0% below list).
- To meet the 1% rule (rent ≥ 1% of price), the offer needs to be $274k (17.1% below list).
- Recommended offer: $274k (17.1% below list) — sets the bar for 1% rule.
- Cap rate 5.7% vs local median 4.0% in North Charleston — top-decile yield for the area; either an underpriced asset or a hidden risk that comps aren't pricing in. Stress-test before assuming the spread holds.
Location & tenants
- Location reads 66/100 on livability (#122 in SC) — a middle-class / working-renter tenant base. Strengths: housing A+, health & safety A+, cost of living A; Watch: employment C-, crime F, amenities F.
- Dorchester 02 (suburban): math 40% / reading 55% proficiency, ranked #12 of 80 in SC (top 15%) — families likely to look elsewhere, expect single-tenant / working-renter base with shorter leases.
- Zoned schools: Sand Hill Elementary (math 58% / reading 59%, grade B-, #95 of 597 statewide, top 16%, 1,133 students, 42% FRL); Gregg Middle (math 28% / reading 45%, grade F, #98 of 229 statewide, top 43%, 850 students, 76% FRL); Ashley Ridge High (math 73% / reading 93%, grade A, #18 of 196 statewide, top 9%, 2,542 students, 50% FRL) — zoned schools average 56% FRL vs 36% district-wide (19 pts higher); higher-poverty schools than district average — tighter screening recommended.
- Market conditions: Rents rising (+3.9%/yr); 691 active listings in the ZIP; 4 comparable units currently listed for rent nearby; rentals leasing fast (median 3d on market — plan ~1-2 weeks tenant-placement turnaround); solid renter incomes; 1,199 units permitted in Dorchester County in 2024 (0 in 5+ unit buildings).
- This rent runs 40% of the median local income ($83k/yr) — at the standard rent-burdened threshold; future hikes will face affordability resistance.
Forward outlook
- Local home prices are declining (-3.0%/yr); year-one equity from $2k of loan paydown is wiped out by about $10k of value loss. Plan a longer hold.
- Dorchester County population projected at +43% by 2050 — long-run rental-demand tailwind backs the buy-and-hold thesis.
Negotiation context
- Only 5 days on market — expect competitive offers; lowballing is unlikely to land.
- 2 sale attempts since 5y ago with the ask held roughly flat each time — persistent listings suggest the price (not the market) is what's stuck; bring a comps-based counter.
- Current owner paid $279k; 18% above their basis — modest negotiation headroom, anchor on the comps not their cost.
Risks & watch-outs
- Climate carrying-cost: severe wind risk, 99% chance of damaging wind over 30y; extreme-heat days projected 7→17/yr by 2055 (HVAC capex compounding) — expect insurance premiums to compound above CPI over the hold.
Questions for the listing agent
- What do current leases actually rent for vs. the listed asking? Can we see a recent rent roll and the last 12 months of T-12 income?
- What does the HOA fee cover, when was the last increase, and are there any pending special assessments or reserve-fund shortfalls?
- Is there a deadline driving the sale (1031 exchange, divorce, estate, relocation)? That informs how much negotiation room exists.
- Crime grade is F in this area — have there been break-ins, vandalism, or insurance claims at this property in the last 3 years? What carrier currently insures it and at what premium?
- The area grade is low — what's the realistic commute time and amenity access for the typical tenant pool here? Any planned neighborhood developments (good or bad) we should know about?
- What's the average days-on-market for RENTAL listings here right now (not sales)? A rising rental-DOM trend means longer vacancies and softer asking-rent achievability than the comps imply.
- What's the recent tenant-quality profile in this submarket — average credit score on applications, eviction rate, late-payment / NSF rate, and stable-employment percentage? A property-management company in the area should have these aggregated.
- How much new for-sale + rental construction is in the pipeline within 1–3 miles? Heavy new supply typically softens prices + rents 12–24 months out; constrained supply supports both.
Investment metrics
- 1% rule
- 0.83% ✗
- Cap rate
- 5.68%
- Cash-on-cash
- -2.17%
- DSCR
- 0.90
- GRM
- 10.1
CMA / ARV
- ARV (on-the-fly)
- $345,356
- Comps found
- 12
Show comp detail 12 sales within ~0.75 mi
| Address | Dist | Beds/Ba | Sqft | Sold | Price | $/sf | Match |
|---|---|---|---|---|---|---|---|
| 104 Country Gate Ln | 0.13mi | 4/2.5 | 2,265 (+10%) | 2mo | $385,000 | $170 | 74 |
| 332 Pink Azalea St | 0.34mi | 4/2.5 | 2,150 (+4%) | 2mo | $360,000 | $167 | 74 |
| 135 Country Gate Ln | 0.23mi | 4/2.5 | 2,280 (+10%) | 4mo | $430,000 | $189 | 67 |
| 208 Morning Song St | 0.21mi | 4/2.5 | 2,296 (+11%) | 5mo | $367,500 | $160 | 65 |
| 110 Bay Eddy Ct | 0.47mi | 4/2.5 | 2,185 (+6%) | 3mo | $357,000 | $163 | 64 |
| 85 Morning Song St | 0.38mi | 4/2.5 | 2,272 (+10%) | 2mo | $399,900 | $176 | 62 |
| 340 Pink Azalea St | 0.30mi | 4/2.5 | 2,296 (+11%) | 6mo | $360,000 | $157 | 61 |
| 219 Pink Azalea St | 0.39mi | 4/2.5 | 2,294 (+11%) | 5mo | $365,000 | $159 | 57 |
| 105 Bay Eddy Ct | 0.43mi | 4/2.5 | 2,302 (+11%) | 3mo | $370,000 | $161 | 57 |
| 146 Wood Sage Run Run | 0.39mi | 4/2.5 | 2,301 (+11%) | 7mo | $353,000 | $153 | 55 |
| 67 Morning Song St | 0.47mi | 3/2.0 (-1) | 2,295 (+11%) | 5mo | $425,000 | $185 | 51 |
| 117 Oyster Tide Ave | 0.50mi | 3/2.0 (-1) | 1,817 (-12%) | 4mo | $375,000 | $206 | 49 |
Match score weights: distance 35% · size 25% · config 20% · recency 20%. Top-matched comps best support the ARV.
Projected returns pro-forma
-3.0% appreciation · 3.93% rent growth · sell at horizon
- IRR
- -18.8%
- Equity multiple
- 0.33×
- Total profit
- $-61,487
- Equity at exit
- $49,204
- IRR
- -9.5%
- Equity multiple
- 0.39×
- Total profit
- $-56,187
- Equity at exit
- $28,532
Cash invested: $92,400 (down + closing). Projections, not guarantees.
Landlord ↔ Tenant lean methodology
- Overall (STATE)
- 90 Strongly Landlord-Friendly
- State South Carolina
- 90 Strongly Landlord-Friendly · R+6
- County
- — inherits STATE
- City
- — inherits STATE
ZIP-level market 29485
- Rents YoY
- 3.9%
- Active inventory
- 691
- Price-to-rent
- 10.1×
Monthly cashflow live
- Estimated rent
- $2,735 medium interval (Pro) →
- Mortgage (P&I)
- −$1,731
- Tax from tax record
- −$260 /mo · $3,123/yr
- Insurance
- −$138
- HOA
- −$200
- Vacancy / Maint / Mgmt
- −$574
- Net cashflow
- $-167
Break-even live
UW: 25.0% down · 7.5% · 30yr · 1.5% tax · 5.0% vac · 8.0% maint · 8.0% mgmt
Financing live
Cash to close
- Down payment
- $82,500
- Closing costs
- $9,900
- Reserves months
- —
- Total cash needed
- —
Loan-product check · same deal, 3 products live
Conventional
25% down · 7.5% · 30yr
- Down + closing
- —
- Monthly P&I
- —
- Monthly cashflow
- —
- DSCR
- —
- Eligible?
- —
Personal DTI + credit; lowest rate.
DSCR
20% down · 8.5% · 30yr
- Down + closing
- —
- Monthly P&I
- —
- Monthly cashflow
- —
- DSCR
- —
- Eligible?
- —
No personal income docs; deal must DSCR.
Hard money
10% down · 12.0% · 12mo
- Down + closing
- —
- Monthly P&I
- —
- Monthly cashflow
- —
- DSCR
- —
- Eligible?
- —
Short-term bridge; refi at stabilization.
Rent comps 4 comps
| Address | Beds | Baths | Sqft | Rent | $/sqft | DOM | Units | Dist |
|---|---|---|---|---|---|---|---|---|
| 240 Morning Song St Summerville, SC | 4.0 | 2.5 | 2307 | $2,750 | $1.19 | 2d | 1 | 0.15mi |
| 1360 Clay Field Trl Summerville, SC | 4.0 | 2.5 | 2503 | $2,600 | $1.04 | 2d | 1 | 0.27mi |
| 214 Narrowleaf Ave Summerville, SC | 4.0 | 2.5 | 2277 | $2,900 | $1.27 | 2d | 1 | 0.46mi |
| 2048 Longhorn Ln Ridgeville, SC | 4.0 | 3.5 | 2993 | $3,500 | $1.17 | 2d | 1 | 0.92mi |
HOA detail
- Monthly dues
- $200 · $2,400/yr
Listing history 3 events
-
2026-05-22$330,000 Active
-
2021-10-01soldstatus $279,380 22-char remark
Show marketing remark (22 chars)
For comp purposes only
-
2021-10-01$279,380 22-char remark
Show marketing remark (22 chars)
For comp purposes only
ⓘ Source: listings_history table (triggers on properties + properties_extension) + one-shot
backfill from property_details.listing_events for pre-trigger history.
Tax reassessment forecast SC · Resets to sale price
- Current annual tax
- $3,123 · $260/mo
- Projected year-2 tax
- $3,123 · $260/mo
- Expected delta
- $0/yr ($0/mo · 0.0%)
ⓘ Screening estimate from a state-policy table — verify with the county assessor before closing.
Climate risk First Street
- Flood 1/10 Low FEMA zone X (unshaded) · 0% chance over 30 yrs
- Wildfire 4/10 Moderate
- Heat 8/10 Severe 7 d/yr ≥109°F today · 17 d/yr by 30 yrs out
- Wind 8/10 Severe 99% chance of damaging wind over 30 yrs
- Air quality 2/10 Low 2 unhealthy d/yr today · 2 by 30 yrs out
Nearby sold comps map
Loading sold comps map…
Walkable amenities ~0.75 mi
Loading nearby amenities…
Taxation est. · year 1
- Rental income
- $32,823
- − Mortgage interest
- −$18,485
- − Property taxes
- −$3,123
- − Insurance
- −$1,650
- − Repairs & maintenance
- −$2,626
- − Management
- −$2,626
- − HOA
- −$2,400
- − Depreciation
- −$9,600
- Taxable loss
- −$7,687
- Est. tax savings @ 24.0%
- +$1,845
- After-tax cash flow
- $-165/yr
For passive investors: Depreciation is non-cash, so a rental often shows a tax loss while cash-flowing — sheltering income. Rental losses are passive: they offset passive income freely, and up to $25,000/yr can offset ordinary (W-2) income if you actively participate and your MAGI is under $100k (phasing out to $0 by $150k); unused losses carry forward. On sale, claimed depreciation is recaptured at up to 25%, and gains may owe capital-gains tax (a 1031 exchange can defer both). Figures are a year-1 estimate at your 24.0% rate — not tax advice; consult a CPA.
Condition & rehab AI · 12 photos
This well-maintained single-family home in North Charleston, SC, offers a good condition with minimal repairs needed. It's ideal for both resale and rental due to its good curb appeal and location.
Value-add opportunities
- Resale Paint exterior trim — Enhances curb appeal and home value
- Rental Trim overgrown grass — Maintains property's neat appearance and attracts tenants
Renovation cost estimate screening
Value-add ROI direction
- Resale Paint exterior trim — Enhances curb appeal and home value ↑
- Rental Trim overgrown grass — Maintains property's neat appearance and attracts tenants ↑
ⓘ Cost ranges are severity-bucket heuristics (US national rule-of-thumb). Get contractor quotes + a written scope before underwriting a rehab budget.
Schools (NCES district)
- District
- Dorchester 02
- NCES district ID
- 4502010
- Math proficiency
- 40% ▼ -13.00%
- Reading proficiency
- 55% ▼ -4.00%
- Median HH income
- $57,937
- Composite
- 41.41/100
- National rank
- #3475
- State rank
- #12 of 80 in SC
Livability — North Charleston
- Score
- 66/100
- State rank
- #122
- US rank
- #12222
Category grades
Schools grade is shown separately in the Schools card above.
Census & demographics
- County
- Dorchester County · 182,866 people
- City population
- 108,266
- Metro
- Charleston-North Charleston, SC
- Population (ZIP)
- 58,507
- Household income
- $82,987
- Rent vs Own
- Severe rent burden
- 1302.0
Population outlook (Dorchester County) Hauer SSP2
- Today (2025)
- 186,982 people
- By 2030
- 203,967 · +9.1%
- By 2040
- 237,160 · +26.8%
- By 2050
- 267,479 · +43.1%
- By 2075
- 333,025 · +78.1%
- By 2100
- 366,560 · +96.0%
Race, ethnicity, and origin ACS 2023
- Neighborhood character
- Diverse neighborhood (Simpson 0.57)
- Race & ethnicity
- White 61% Black 23% Hispanic / Latino 7% Two or more races 7% Asian 3% Pacific Islander 2%
- Hispanic origin (detail)
- Mexican 4% Puerto Rican 1%
- Common ancestry
- Slovak 3% Italian 2% Lithuanian 2%
- Foreign-born
- 7% · Canada, China, Vietnam
- Languages at home
- 92% English-only · Spanish 4% Chinese 1% Russian/Polish/Slavic 1%
Political lean MEDSL · Dorchester
- 2024 margin
- R (+14.6) · D 41.8% · R 56.4% · Other 1.9%
- 2008→2024 swing
- +0.9pp no change · 2008: -15.5pp · 2024: -14.6pp
- All cycles
- 2024: R+14.6 2020: R+10.5 2016: R+17.5 2012: R+16.0 2008: R+15.5
Not yet ingested
- Civics
- —
Market trends
- HPI YoY
- ▼ -305.43%
- Current HPI
- 210.8607
- Rent YoY
- ▲ 3.93%
- Metro
- Charleston-North Charleston, SC
- State GDP YoY
- ▲ 4.51%
- F500 in state
- 2
Industry mix (Fortune 500 HQ in SC)
| Industry | F500 HQs | Revenue |
|---|---|---|
| Packaging | 1 | $7B |
|
||
Price history
+18.1% since first listed3 events — show timeline
- 2026-05-22 Listed $330,000 Charleston Trident MLS
- 2021-10-01 Listed $279,380 Charleston Trident MLS
- 2021-10-01 Sold (MLS) $279,380 Charleston Trident MLS
Property tax history
+3.4%/yrLatest (2025): $3,123 · +0.6% YoY. Source: county tax records.
Cash-flow waterfall
monthlySold comps — $/sqft
last 12 mo · ≤1 miLoading sold comps…