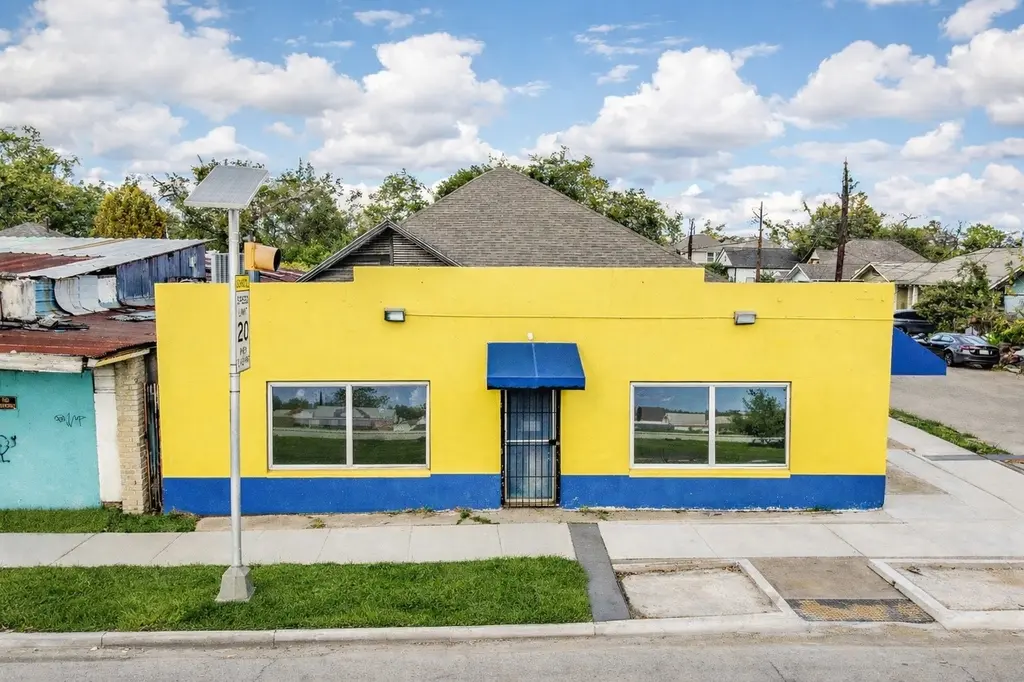
 Fourplex
815 Quitman St · Houston, TX
Flood risk No data
- FEMA flood zone
- —
- Chance of flooding over 30 yrs
- —
- Est. flood insurance / yr
- —
Fire risk No data
- Est. fire insurance / yr
- —
Heat risk No data
- Hot days now (above threshold)
- —
- Hot days in 30 yrs
- —
Wind risk No data
- Chance of severe wind over 30 yrs
- —
Air-quality risk No data
- Unhealthy air days now
- —
- Unhealthy air days in 30 yrs
- —
Risk factors via First Street. Map © Google.
Why this score? — see what drove the B grade
The composite is a weighted blend of 9 inputs, each scored 0–100. Each bar is that input's sub-score; the figure is the points it added to the 100-point composite (weight × sub-score).
- Cash flow +30.0/30.0
- ARV discount +10.8/15.0
- DSCR +10.0/10.0
- 1% rule +8.5/10.0
- Livability +3.7/5.0
- Rent growth +2.7/5.0
- Schools +2.7/10.0
- Condition / age +2.2/5.0
- Appreciation +0.0/10.0
$449,000
🖨 Deal sheet (PDF) 📄 Offer letter ✓ Due diligence
Multi-family units
County records classify this as Multi-Family (2-4 Unit). Listing-text estimate: 4 units. confirmed
Listing remarks MLS
Welcome to 815 Quitman St, a versatile 4-unit property in Houston’s booming Near Northside. The mix includes a 1,000 SF commercial storefront, two 1 bed/1 bath units, and one 2 bed/1 bath unit. Currently 50% occupied, producing $1,650/mo, with two turnkey units ready to lease, this asset offers immediate cash flow and strong upside potential. Ideal for buy-and-hold, BRRRR, or fix-and-flip investors, the location is unbeatable—just 5 minutes from Downtown and in between all major freeways. This property is surrounded by rapid appreciation including new townhomes, Hardy Yards, the brand-new White Oak Station development, and the future Hardy Toll Road expansion into Downtown. Call today to unlock its full potential.
Key facts
- New townhomes
- 5,000 sq ft lot
- Built 1930
Tags
Neighborhood map
What this means for you Summary
Snapshot
- This is a 3×1bd/1ba + 1×2bd/1ba units multifamily listed at $449k. Condition is rated fair.
Deal economics
- At list price, monthly cash flow is $2k ($20k/yr) — positive. Per door: $419/mo.
- The deal already cash-flows at list — no discount required.
- Meets the 1% rule at list price ($6k rent vs $449k).
- Recommended offer: $409k (9.0% below list) — sets the bar for market timing.
- Cap rate 10.8% vs local median 3.2% in Houston — top-decile yield for the area; either an underpriced asset or a hidden risk that comps aren't pricing in. Stress-test before assuming the spread holds.
Location & tenants
- Location reads 74/100 on livability (#184 in TX, #4,771 nationally) — a middle-class / working-renter tenant base. Strengths: amenities A+, cost of living A+, housing A+; Watch: schools D, crime F.
- Houston ISD (urban): math 27% / reading 35% proficiency, ranked #593 of 826 in TX (top 72%) — families likely to look elsewhere, expect single-tenant / working-renter base with shorter leases; 71% free/reduced lunch — lower-income household profile, screen leases tightly.
- Market conditions: Rents flat; 595 active listings in the ZIP; solid renter incomes; 29,883 units permitted in Harris County in 2024 (8,621 in 5+ unit buildings).
- At $6,048/mo this rent would consume 87% of the median local household income ($83k/yr) (locally 994% of renters already pay >50% of income on rent) — very limited rent-growth headroom before tenants either downsize or default.
Forward outlook
- Local home prices are declining (-3.0%/yr); year-one equity from $3k of loan paydown is wiped out by about $13k of value loss. Plan a longer hold.
- Harris County population projected at +47% by 2050 — long-run rental-demand tailwind backs the buy-and-hold thesis.
- At projected returns (-3.0% appreciation + 0.8% rent growth), your $126k cash investment doubles in ~10 years — after that, you're playing with house money.
Negotiation context
- It's been on market 94 days — a 9% lower offer ($409k) is reasonable based on typical stale-listing flexibility.
- 4 sale attempts since 4y ago; this cycle's ask has dropped $50k (10%) from the opening price — seller is motivated, your offer sets the floor, not the list.
Risks & watch-outs
- Watch-outs: built in 1930 — expect roof / HVAC / electrical / plumbing capex.
Questions for the listing agent
- It's been on market 94 days. Have you received any prior offers? Is the seller open to a 9% concession, seller financing, or rate buy-down credit?
- Can we see the unit-by-unit rent roll, current vacancy, and any below-market leases? What's the average tenancy length?
- What capital expenditures (roof, boiler, parking lot, exteriors) have been made in the last 5 years, and what's planned in the next 2?
- Have any recent inspections been done? Can we get a copy of the seller's disclosures and any deferred-maintenance estimates?
- Built in 1930 — when were the roof, HVAC, electrical panel, plumbing, and water heater last replaced?
- Why hasn't it sold? Are there any deal-killer items the seller is aware of (foundation, flood, title, zoning, code violations)?
- Is there a deadline driving the sale (1031 exchange, divorce, estate, relocation)? That informs how much negotiation room exists.
- Schools are D-rated, which usually means shorter tenancies and higher turnover. Who's the typical renter profile here, and what's been the actual vacancy rate?
- Crime grade is F in this area — have there been break-ins, vandalism, or insurance claims at this property in the last 3 years? What carrier currently insures it and at what premium?
- What's the average days-on-market for RENTAL listings here right now (not sales)? A rising rental-DOM trend means longer vacancies and softer asking-rent achievability than the comps imply.
- What's the recent tenant-quality profile in this submarket — average credit score on applications, eviction rate, late-payment / NSF rate, and stable-employment percentage? A property-management company in the area should have these aggregated.
- How much new apartment / multifamily construction is in the pipeline within 1–3 miles? Heavy new supply (>2% of stock underway) typically softens rents 12–24 months out; light construction supports rent growth.
Investment metrics
- 1% rule
- 1.35% ✓
- Cap rate
- 10.77%
- Cash-on-cash
- 15.99%
- DSCR
- 1.71
- GRM
- 6.2
CMA / ARV
- ARV (median comp)
- $484,101
- List price
- $449,000
- Delta
- -7.25%
- Verdict
- FAIR
- Comps
- 16 within 1.0 mi
Projected returns pro-forma
-3.0% appreciation · 0.84% rent growth · sell at horizon
- IRR
- 4.5%
- Equity multiple
- 1.17×
- Total profit
- $21,147
- Equity at exit
- $66,947
- IRR
- 11.8%
- Equity multiple
- 1.84×
- Total profit
- $105,592
- Equity at exit
- $38,821
Cash invested: $125,720 (down + closing). Projections, not guarantees.
Landlord ↔ Tenant lean methodology
- Overall (STATE)
- 87 Strongly Landlord-Friendly
- State Texas
- 87 Strongly Landlord-Friendly · R+5
- County
- — inherits STATE
- City
- — inherits STATE
ZIP-level market 77009
- Rents YoY
- 0.8%
- Active inventory
- 595
- Price-to-rent
- 25.3×
Monthly cashflow live
- Estimated rent
- $6,048 high interval (Pro) →
- Mortgage (P&I)
- −$2,355
- Tax est. 1.5%
- −$561 /mo · $6,735/yr
- Insurance
- −$187
- HOA
- −$0
- Vacancy / Maint / Mgmt
- −$1,270
- Net cashflow
- $1,675
Break-even live
Sensitivity live
| Price | -10% $1,985 | -5% $1,830 | +0% $1,675 | +5% $1,520 | +10% $1,365 |
|---|---|---|---|---|---|
| Rent | -10% $1,197 | -5% $1,436 | +0% $1,675 | +5% $1,914 | +10% $2,153 |
| Rate | -1.0pp $1,901 | -0.5pp $1,789 | base $1,675 | +0.5pp $1,559 | +1.0pp $1,440 |
4-unit breakdown (identical units grouped — click to expand)
| Units | Beds | Baths | Est. rent |
|---|---|---|---|
| 3× units | 1 | 1 | $4,440 |
| #1 | 1 | 1 | $1,480 |
| #2 | 1 | 1 | $1,480 |
| #4 | 1 | 1 | $1,480 |
| 1× unit | 2 | 1 | $1,609 |
| Total (4 units) | $6,048 | ||
UW: 25.0% down · 7.5% · 30yr · 1.5% tax · 5.0% vac · 8.0% maint · 8.0% mgmt
Financing live
Cash to close
- Down payment
- $112,250
- Closing costs
- $13,470
- Reserves months
- —
- Total cash needed
- —
Loan-product check · same deal, 3 products live
Conventional
25% down · 7.5% · 30yr
- Down + closing
- —
- Monthly P&I
- —
- Monthly cashflow
- —
- DSCR
- —
- Eligible?
- —
Personal DTI + credit; lowest rate.
DSCR
20% down · 8.5% · 30yr
- Down + closing
- —
- Monthly P&I
- —
- Monthly cashflow
- —
- DSCR
- —
- Eligible?
- —
No personal income docs; deal must DSCR.
Hard money
10% down · 12.0% · 12mo
- Down + closing
- —
- Monthly P&I
- —
- Monthly cashflow
- —
- DSCR
- —
- Eligible?
- —
Short-term bridge; refi at stabilization.
Listing history 14 events
-
2026-06-04days on market $449,000 Active 94 DOM
-
2026-06-01days on market $449,000 Active 91 DOM
-
2026-05-31days on market $449,000 Active 90 DOM
-
2026-04-15price $449,000 735-char remark
Show marketing remark (735 chars)
Welcome to 815 Quitman St, a versatile 4-unit property in Houston’s booming Near Northside. The mix includes a 1,000 SF commercial storefront, two 1 bed/1 bath units, and one 2 bed/1 bath unit. Currently 50% occupied, producing $1,650/mo, with two turnkey units ready to lease, this asset offers immediate cash flow and strong upside potential. Ideal for buy-and-hold, BRRRR, or fix-and-flip investors, the location is unbeatable—just 5 minutes from Downtown and in between all major freeways. This property is surrounded by rapid appreciation including new townhomes, Hardy Yards, the brand-new White Oak Station development, and the future Hardy Toll Road expansion into Downtown. Call today to unlock its full potential.
-
2026-03-02$499,000 Active 735-char remark
Show marketing remark (735 chars)
Welcome to 815 Quitman St, a versatile 4-unit property in Houston’s booming Near Northside. The mix includes a 1,000 SF commercial storefront, two 1 bed/1 bath units, and one 2 bed/1 bath unit. Currently 50% occupied, producing $1,650/mo, with two turnkey units ready to lease, this asset offers immediate cash flow and strong upside potential. Ideal for buy-and-hold, BRRRR, or fix-and-flip investors, the location is unbeatable—just 5 minutes from Downtown and in between all major freeways. This property is surrounded by rapid appreciation including new townhomes, Hardy Yards, the brand-new White Oak Station development, and the future Hardy Toll Road expansion into Downtown. Call today to unlock its full potential.
-
2025-12-23historical
-
2025-11-24$540,000 Active
-
2023-07-14historical
-
2023-04-28historical
-
2023-03-25$495,000 Active
-
2022-12-16historical
-
2022-09-18price $549,000
-
2022-07-22price $597,500
-
2022-05-17$639,000 Active
ⓘ Source: listings_history table (triggers on properties + properties_extension) + one-shot
backfill from property_details.listing_events for pre-trigger history.
Nearby sold comps map
Loading sold comps map…
Walkable amenities ~0.75 mi
Loading nearby amenities…
Taxation est. · year 1
- Rental income
- $72,576
- − Mortgage interest
- −$25,151
- − Property taxes
- −$6,735
- − Insurance
- −$2,245
- − Repairs & maintenance
- −$5,806
- − Management
- −$5,806
- − Depreciation
- −$13,062
- Taxable income
- $13,771
- Est. tax owed @ 24.0%
- −$3,305
- After-tax cash flow
- $16,795/yr
For passive investors: Depreciation is non-cash, so a rental often shows a tax loss while cash-flowing — sheltering income. Rental losses are passive: they offset passive income freely, and up to $25,000/yr can offset ordinary (W-2) income if you actively participate and your MAGI is under $100k (phasing out to $0 by $150k); unused losses carry forward. On sale, claimed depreciation is recaptured at up to 25%, and gains may owe capital-gains tax (a 1031 exchange can defer both). Figures are a year-1 estimate at your 24.0% rate — not tax advice; consult a CPA.
Condition & rehab AI · 12 photos
This 4-unit property requires moderate rehabilitation to improve its condition and increase its value. Immediate repairs and maintenance are needed to address structural and functional issues.
Repairs flagged
- Major kitchen appliances — need replacement for functionality
- Major bathroom fixtures — need replacement for functionality
- Major exterior paint — peeling and worn
- Major HVAC system — visible wear and potential inefficiency
Value-add opportunities
- Both paint interior walls — enhances curb appeal and interior aesthetics
- Both repair exterior siding — improves curb appeal and structural integrity
- Both replace worn flooring — enhances interior aesthetics and functionality
- Both replace worn kitchen countertops — enhances functionality and aesthetics
- Both replace worn bathroom tiles — enhances functionality and aesthetics
- Both repair HVAC system — improves comfort and energy efficiency
Renovation cost estimate screening
| Repair item | Severity | Est. cost |
|---|---|---|
| kitchen appliances · need replacement for functionality | Major | $15,000–50,000 |
| bathroom fixtures · need replacement for functionality | Major | $15,000–50,000 |
| exterior paint · peeling and worn | Major | $15,000–50,000 |
| HVAC system · visible wear and potential inefficiency | Major | $15,000–50,000 |
| Total estimated repair cost · 4 items | $60,000–200,000 |
Value-add ROI direction
- Both paint interior walls — enhances curb appeal and interior aesthetics ↑
- Both repair exterior siding — improves curb appeal and structural integrity ↑
- Both replace worn flooring — enhances interior aesthetics and functionality ↑
- Both replace worn kitchen countertops — enhances functionality and aesthetics ↑
- Both replace worn bathroom tiles — enhances functionality and aesthetics ↑
- Both repair HVAC system — improves comfort and energy efficiency ↑
ⓘ Cost ranges are severity-bucket heuristics (US national rule-of-thumb). Get contractor quotes + a written scope before underwriting a rehab budget.
Schools (NCES district)
- District
- Houston ISD
- NCES district ID
- 4823640
- Math proficiency
- 27% ▼ -18.00%
- Reading proficiency
- 35% ▼ -6.00%
- Median HH income
- $46,054
- Composite
- 26.63/100
- National rank
- #7173
- State rank
- #593 of 826 in TX
Livability — Houston
- Score
- 74/100
- State rank
- #184
- US rank
- #4771
Category grades
Schools grade is shown separately in the Schools card above.
Census & demographics
- Census place
- Houston, TX
- County
- Harris County · 4,702,590 people
- City population
- 3,226,434
- Metro
- Houston-The Woodlands-Sugar Land, TX
- Population (ZIP)
- 35,769
- Household income
- $83,148
- Rent vs Own
- Severe rent burden
- 994.0
Population outlook (Harris County) Hauer SSP2
- Today (2025)
- 5,571,493 people
- By 2030
- 6,089,821 · +9.3%
- By 2040
- 7,142,806 · +28.2%
- By 2050
- 8,185,864 · +46.9%
- By 2075
- 10,574,329 · +89.8%
- By 2100
- 12,109,958 · +117.4%
Race, ethnicity, and origin ACS 2023
- Neighborhood character
- Diverse neighborhood (Simpson 0.60)
- Race & ethnicity
- Hispanic / Latino 53% White 33% Two or more races 22% Black 8% Asian 3%
- Hispanic origin (detail)
- Mexican 46%
- Common ancestry
- Italian 2% Lithuanian 2% Slovak 1%
- Foreign-born
- 20% · Canada
- Languages at home
- 55% English-only · Spanish 40% Other Indo-European 2% Other Asian/Pacific 1%
Political lean MEDSL · Harris
- 2024 margin
- Lean D (+5.5) · D 52.0% · R 46.4% · Other 1.6%
- 2008→2024 swing
- +3.9pp toward D · 2008: 1.6pp · 2024: 5.5pp
- All cycles
- 2024: D+5.5 2020: D+13.3 2016: D+12.4 2012: D+0.1 2008: D+1.6
Not yet ingested
- Civics
- —
Market trends
- HPI YoY
- ▼ -533.57%
- Current HPI
- 219.5037
- Rent YoY
- ▲ 0.84%
- Metro
- Houston-The Woodlands-Sugar Land, TX
- State GDP YoY
- ▲ 3.95%
- F500 in state
- 110
Industry mix (Fortune 500 HQ in TX)
| Industry | F500 HQs | Revenue |
|---|---|---|
| Energy | 16 | $1,198B |
|
||
| Technology | 5 | $198B |
|
||
| Engineering / Construction | 4 | $72B |
|
||
| Energy Services | 3 | $60B |
|
||
| Utilities | 3 | $41B |
|
||
| Healthcare | 2 | $330B |
|
||
Price history
-29.7% since first listed11 events — show timeline
- 2026-04-15 Price Changed $449,000 HARMLS
- 2026-03-02 Listed $499,000 HARMLS
- 2025-12-23 Listing Removed — HARMLS
- 2025-11-24 Listed $540,000 HARMLS
- 2023-07-14 Rental Removed — HARMLS
- 2023-04-28 Listing Removed — HARMLS
- 2023-03-25 Listed $495,000 HARMLS
- 2022-12-16 Listing Removed — HARMLS
- 2022-09-18 Price Changed $549,000 HARMLS
- 2022-07-22 Price Changed $597,500 HARMLS
- 2022-05-17 Listed $639,000 HARMLS
Cash-flow waterfall
monthlySold comps — $/sqft
last 12 mo · ≤1 miLoading sold comps…