1220 Saint Johns Church Rd · Hampstead, NC
Flood risk 1/10 · Minimal
- FEMA flood zone
- X (unshaded)
- Chance of flooding over 30 yrs
- 0.0%
- Est. flood insurance / yr
- $507 – $1,088
Fire risk 6/10 · Moderate
- Est. fire insurance / yr
- $906 – $1,684
Heat risk 9/10 · Severe
- Hot days now (above 103°F)
- 7 days/yr
- Hot days in 30 yrs
- 19 days/yr
Wind risk 9/10 · Severe
- Chance of severe wind over 30 yrs
- 99.0%
Air-quality risk 1/10 · Minimal
- Unhealthy air days now
- 0 days/yr
- Unhealthy air days in 30 yrs
- 0 days/yr
Risk factors via First Street. Map © Google.
Why this score? — see what drove the C+ grade
The composite is a weighted blend of 9 inputs, each scored 0–100. Each bar is that input's sub-score; the figure is the points it added to the 100-point composite (weight × sub-score).
- Cash flow +25.4/30.0
- DSCR +8.4/10.0
- ARV discount +7.5/15.0
- 1% rule +5.7/10.0
- Schools +4.2/10.0
- Rent growth +3.6/5.0
- Livability +3.6/5.0
- Condition / age +2.5/5.0
- Appreciation +0.0/10.0
$250,000
🖨 Deal sheet (PDF) 📄 Offer letter ✓ Due diligence
Listing remarks
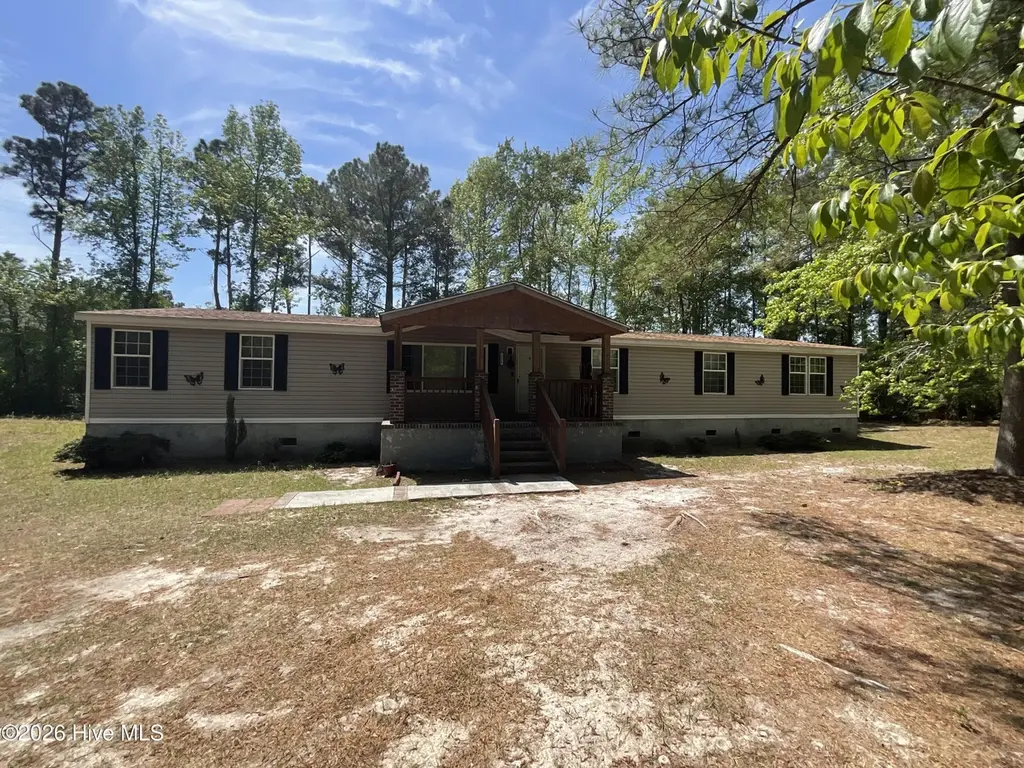
Tucked away on a generous 0.46-acre lot, this spacious 4-bedroom, 2-bathroom home offers over 2,300 square feet of comfortable living space in highly sought-after Hampstead. Built in 2003 and legally converted to real property, this home delivers the perfect blend of privacy, functionality, and everyday convenience. Step inside to discover a thoughtfully designed floor plan featuring multiple living areas -- ideal for hosting gatherings or simply giving everyone room to spread out. The heart of the home is a large kitchen with ample cabinetry and workspace that flows seamlessly into the dining and main living rooms. You will love the desirable split-bedroom layout, which ensures maximum pri
Key facts
- Split-bedroom layout
- Walk-in closet
- Large kitchen
Tags
Property features AI
Finance
- Other: Property is residential, zoned RP; Views present; Horses allowed
Exterior
- Parking: On-site unpaved parking
- Utilities: No utilities listed
- Home design: Manufactured home; One level entry; Single-story
- Construction: Vinyl siding and frame construction; Block foundation; Shingle roof; Built as a manufactured home
- Exterior features: Covered front porch; Porch
Interior
- Bathrooms: 2 full bathrooms
- Heating & cooling: Heat pump; Electric heating; Forced air heating; Central air conditioning
- Interior features: Ceiling fans; Window coverings; Total of 9 rooms
Neighborhood map
What this means for you Summary
Snapshot
- This is a 4-bed/3.0-bath manufactured listed at $250k.
Deal economics
- At list price, monthly cash flow is $577 ($7k/yr) — positive.
- The deal already cash-flows at list — no discount required.
- Meets the 1% rule at list price ($3k rent vs $250k).
- Recommended offer: $242k (3.0% below list) — sets the bar for market timing.
- Cap rate 9.1% vs local median 3.1% in Hampstead — top-decile yield for the area; either an underpriced asset or a hidden risk that comps aren't pricing in. Stress-test before assuming the spread holds.
Location & tenants
- Location reads 71/100 on livability (#109 in NC) — a middle-class / working-renter tenant base. Strengths: crime A+, housing A+, employment A; Watch: health & safety D, amenities F, commute F.
- Pender County Schools (rural): math 49% / reading 50% proficiency, ranked #66 of 178 in NC (top 37%) — families likely to look elsewhere, expect single-tenant / working-renter base with shorter leases.
- Zoned schools: South Topsail Elementary (math 61% / reading 58%, grade B-, #205 of 1,410 statewide, top 16%, 557 students, 34% FRL); Topsail Middle (math 64% / reading 65%, grade A-, #30 of 475 statewide, top 7%, 807 students, 20% FRL); Topsail High (math 67% / reading 72%, grade B, #121 of 535 statewide, top 24%, 1,777 students, 22% FRL) — zoned schools average 25% FRL vs 47% district-wide (22 pts lower); this property's tenant base skews higher-income than the district average.
- Zoned-school proficiency averages 64% at this address vs 50% district-wide (+15 pts) — the actual schools serving this property are materially stronger than the Pender County Schools average implies; a family-tenant draw the district grade alone would hide.
- Market conditions: Rents rising fast (+4.6%/yr); 509 active listings in the ZIP; 2 comparable units currently listed for rent nearby; solid renter incomes; 943 units permitted in Pender County in 2024 (0 in 5+ unit buildings).
- This rent runs 36% of the median local income ($90k/yr) — at the standard rent-burdened threshold; future hikes will face affordability resistance.
Forward outlook
- Local home prices are declining (-3.0%/yr); year-one equity from $2k of loan paydown is wiped out by about $8k of value loss. Plan a longer hold.
- Pender County population projected at +38% by 2050 — long-run rental-demand tailwind backs the buy-and-hold thesis.
- At projected returns (-3.0% appreciation + 4.6% rent growth), your $70k cash investment doubles in ~10 years — after that, you're playing with house money.
Negotiation context
- It's been on market 45 days — a 3% lower offer ($242k) is reasonable based on typical stale-listing flexibility.
Risks & watch-outs
- Climate carrying-cost: severe wind risk, 99% chance of damaging wind over 30y; major wildfire risk; extreme-heat days projected 7→19/yr by 2055 (HVAC capex compounding) — expect insurance premiums to compound above CPI over the hold.
Questions for the listing agent
- It's been on market 45 days. Have you received any prior offers? Is the seller open to a 3% concession, seller financing, or rate buy-down credit?
- Is there a deadline driving the sale (1031 exchange, divorce, estate, relocation)? That informs how much negotiation room exists.
- What's the average days-on-market for RENTAL listings here right now (not sales)? A rising rental-DOM trend means longer vacancies and softer asking-rent achievability than the comps imply.
- What's the recent tenant-quality profile in this submarket — average credit score on applications, eviction rate, late-payment / NSF rate, and stable-employment percentage? A property-management company in the area should have these aggregated.
- How much new for-sale + rental construction is in the pipeline within 1–3 miles? Heavy new supply typically softens prices + rents 12–24 months out; constrained supply supports both.
Investment metrics
- 1% rule
- 1.07% ✓
- Cap rate
- 9.06%
- Cash-on-cash
- 9.88%
- DSCR
- 1.44
- GRM
- 7.8
CMA / ARV
No comps found within radius.
Projected returns pro-forma
-3.0% appreciation · 4.57% rent growth · sell at horizon
- IRR
- 0.2%
- Equity multiple
- 1.01×
- Total profit
- $429
- Equity at exit
- $37,276
- IRR
- 11.2%
- Equity multiple
- 1.94×
- Total profit
- $65,556
- Equity at exit
- $21,615
Cash invested: $70,000 (down + closing). Projections, not guarantees.
Landlord ↔ Tenant lean methodology
- Overall (STATE)
- 85 Strongly Landlord-Friendly
- State North Carolina
- 85 Strongly Landlord-Friendly · R+3
- County
- — inherits STATE
- City
- — inherits STATE
ZIP-level market 28443
- Rents YoY
- 4.6%
- Active inventory
- 509
- Price-to-rent
- 7.8×
Monthly cashflow live
- Estimated rent
- $2,678 medium interval (Pro) →
- Mortgage (P&I)
- −$1,311
- Tax from tax record
- −$124 /mo · $1,492/yr
- Insurance
- −$104
- HOA
- −$0
- Vacancy / Maint / Mgmt
- −$562
- Net cashflow
- $577
Break-even live
Sensitivity live
| Price | -10% $718 | -5% $647 | +0% $577 | +5% $506 | +10% $435 |
|---|---|---|---|---|---|
| Rent | -10% $365 | -5% $471 | +0% $577 | +5% $682 | +10% $788 |
| Rate | -1.0pp $702 | -0.5pp $640 | base $577 | +0.5pp $512 | +1.0pp $446 |
UW: 25.0% down · 7.5% · 30yr · 1.5% tax · 5.0% vac · 8.0% maint · 8.0% mgmt
Financing live
Cash to close
- Down payment
- $62,500
- Closing costs
- $7,500
- Reserves months
- —
- Total cash needed
- —
Loan-product check · same deal, 3 products live
Conventional
25% down · 7.5% · 30yr
- Down + closing
- —
- Monthly P&I
- —
- Monthly cashflow
- —
- DSCR
- —
- Eligible?
- —
Personal DTI + credit; lowest rate.
DSCR
20% down · 8.5% · 30yr
- Down + closing
- —
- Monthly P&I
- —
- Monthly cashflow
- —
- DSCR
- —
- Eligible?
- —
No personal income docs; deal must DSCR.
Hard money
10% down · 12.0% · 12mo
- Down + closing
- —
- Monthly P&I
- —
- Monthly cashflow
- —
- DSCR
- —
- Eligible?
- —
Short-term bridge; refi at stabilization.
Rent comps 2 comps
| Address | Beds | Baths | Sqft | Rent | $/sqft | DOM | Units | Dist |
|---|---|---|---|---|---|---|---|---|
| 78 Violetear Rdg Hampstead, NC | 5.0 | 3.0 | 2331 | $3,000 | $1.29 | 14d | 1 | 0.84mi |
| 125 Egret Ct Unit 305 Hampstead, NC | 3.0 | 2.5 | 1628 | $2,175 | $1.34 | 22d | 1 | 0.85mi |
Listing history 16 events
-
2026-06-18days on market $250,000 Active 45 DOM
-
2026-06-17days on market $250,000 Active 44 DOM
-
2026-06-16days on market $250,000 Active 43 DOM
-
2026-06-15days on market $250,000 Active 42 DOM
-
2026-06-14days on market $250,000 Active 40 DOM
-
2026-06-13days on market $250,000 Active 39 DOM
-
2026-06-10days on market $250,000 Active 37 DOM
-
2026-06-09days on market $250,000 Active 36 DOM
-
2026-06-08days on market $250,000 Active 35 DOM
-
2026-06-07days on market $250,000 Active 34 DOM
-
2026-06-03days on market $250,000 Active 30 DOM
-
2026-06-03days on market $250,000 Active 29 DOM
-
2026-06-01days on market $250,000 Active 28 DOM
-
2026-05-31days on market $250,000 Active 27 DOM
-
2026-05-30days on market $250,000 Active 26 DOM
-
2026-05-04$250,000 Active
ⓘ Source: listings_history table (triggers on properties + properties_extension) + one-shot
backfill from property_details.listing_events for pre-trigger history.
Tax reassessment forecast NC · Resets to sale price
- Current annual tax
- $1,492 · $124/mo
- Projected year-2 tax
- $2,050 · $171/mo
- Expected delta
- +$558/yr (+$47/mo · 37.4%)
ⓘ Screening estimate from a state-policy table — verify with the county assessor before closing.
Climate risk First Street
- Flood 1/10 Low FEMA zone X (unshaded) · 0% chance over 30 yrs
- Wildfire 6/10 Major
- Heat 9/10 Extreme 7 d/yr ≥103°F today · 19 d/yr by 30 yrs out
- Wind 9/10 Extreme 99% chance of damaging wind over 30 yrs
- Air quality 1/10 Low 0 unhealthy d/yr today · 0 by 30 yrs out
Nearby sold comps map
Loading sold comps map…
Walkable amenities ~0.75 mi
Loading nearby amenities…
Taxation est. · year 1
- Rental income
- $32,142
- − Mortgage interest
- −$14,004
- − Property taxes
- −$1,492
- − Insurance
- −$1,250
- − Repairs & maintenance
- −$2,571
- − Management
- −$2,571
- − Depreciation
- −$7,273
- Taxable income
- $2,981
- Est. tax owed @ 24.0%
- −$715
- After-tax cash flow
- $6,203/yr
For passive investors: Depreciation is non-cash, so a rental often shows a tax loss while cash-flowing — sheltering income. Rental losses are passive: they offset passive income freely, and up to $25,000/yr can offset ordinary (W-2) income if you actively participate and your MAGI is under $100k (phasing out to $0 by $150k); unused losses carry forward. On sale, claimed depreciation is recaptured at up to 25%, and gains may owe capital-gains tax (a 1031 exchange can defer both). Figures are a year-1 estimate at your 24.0% rate — not tax advice; consult a CPA.
Schools (NCES district)
- District
- Pender County Schools
- NCES district ID
- 3703570
- Math proficiency
- 49% ▲ 3.00%
- Reading proficiency
- 50% ▬ 0.00%
- Median HH income
- $45,792
- Composite
- 41.97/100
- National rank
- #3342
- State rank
- #66 of 178 in NC
Livability — Hampstead
- Score
- 71/100
- State rank
- #109
- US rank
- #6880
Category grades
Schools grade is shown separately in the Schools card above.
Census & demographics
- Census place
- Hampstead, NC
- County
- Pender County · 28,416 people
- City population
- 28,416
- Metro
- Wilmington, NC
- Population (ZIP)
- 28,416
- Household income
- $90,477
- Rent vs Own
- Severe rent burden
- 700.0
Population outlook (Pender County) Hauer SSP2
- Today (2025)
- 69,295 people
- By 2030
- 74,990 · +8.2%
- By 2040
- 85,954 · +24.0%
- By 2050
- 95,925 · +38.4%
- By 2075
- 117,525 · +69.6%
- By 2100
- 129,074 · +86.3%
Race, ethnicity, and origin ACS 2023
- Neighborhood character
- Predominantly White (82%)
- Race & ethnicity
- White 82% Two or more races 7% Black 5% Hispanic / Latino 5% Asian 1%
- Hispanic origin (detail)
- Mexican 4%
- Common ancestry
- Slovak 3% Romanian 3% Serbian 2%
- Foreign-born
- 4% · Canada
- Languages at home
- 94% English-only · Spanish 4% Other Indo-European 1%
Political lean MEDSL · Pender
- 2024 margin
- Solid R (+35.0) · D 32.1% · R 67.0%
- 2008→2024 swing
- -19.4pp toward R · 2008: -15.6pp · 2024: -35.0pp
- All cycles
- 2024: R+35.0 2020: R+29.9 2016: R+30.4 2012: R+20.4 2008: R+15.6
Not yet ingested
- Civics
- —
Market trends
- HPI YoY
- ▼ -125.51%
- Current HPI
- 188.426
- Rent YoY
- ▲ 4.57%
- Metro
- Wilmington, NC
- State GDP YoY
- ▲ 3.28%
- F500 in state
- 26
Industry mix (Fortune 500 HQ in NC)
| Industry | F500 HQs | Revenue |
|---|---|---|
| Financial Services | 2 | $213B |
|
||
| Retail | 2 | $95B |
|
||
| Industrial Conglomerate | 1 | $38B |
|
||
| Metals / Steel | 1 | $35B |
|
||
| Utilities | 1 | $30B |
|
||
| Industrial Machinery | 1 | $19B |
|
||
Price history
1 event — show timeline
- 2026-05-04 Listed $250,000 Hive MLS
Property tax history
+7.7%/yrLatest (2025): $1,492 · +0.0% YoY. Source: county tax records.
Cash-flow waterfall
monthlySold comps — $/sqft
last 12 mo · ≤1 miLoading sold comps…