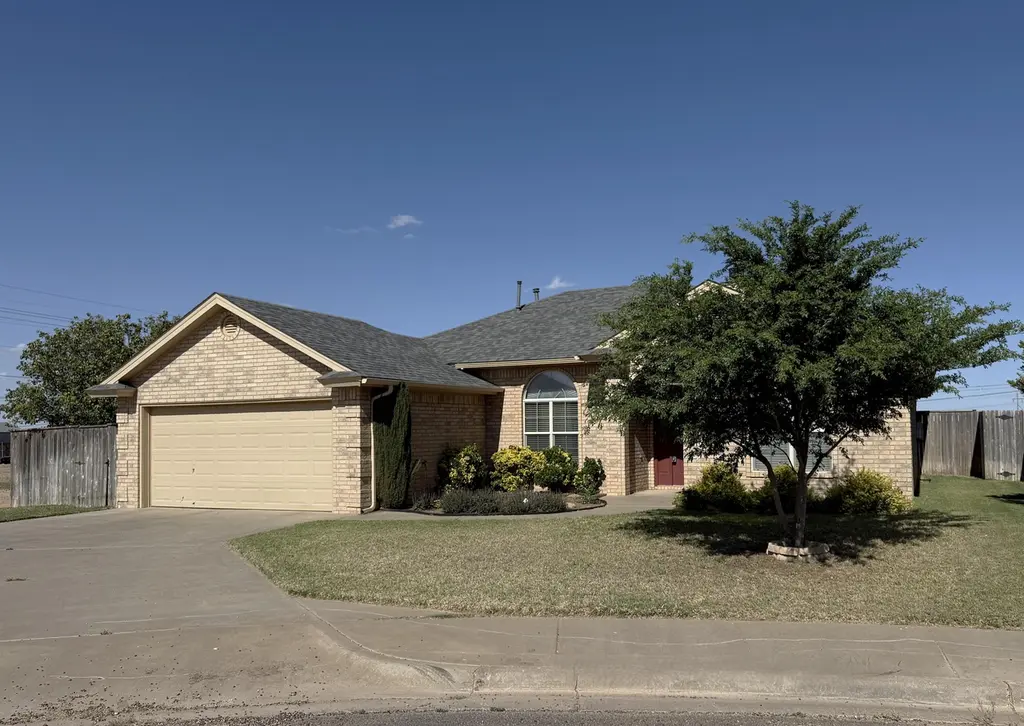
1515 Yorkshire Ave · Wolfforth, TX
Flood risk 1/10 · Minimal
- FEMA flood zone
- X (unshaded)
- Chance of flooding over 30 yrs
- 0.0%
- Est. flood insurance / yr
- $507 – $1,088
Fire risk 7/10 · Major
- Est. fire insurance / yr
- $1,222 – $2,270
Heat risk 5/10 · Moderate
- Hot days now (above 99°F)
- 7 days/yr
- Hot days in 30 yrs
- 20 days/yr
Wind risk 2/10 · Minimal
- Chance of severe wind over 30 yrs
- —
Air-quality risk 2/10 · Minimal
- Unhealthy air days now
- 1 days/yr
- Unhealthy air days in 30 yrs
- 1 days/yr
Risk factors via First Street. Map © Google.
Why this score? — see what drove the D grade
The composite is a weighted blend of 9 inputs, each scored 0–100. Each bar is that input's sub-score; the figure is the points it added to the 100-point composite (weight × sub-score).
- ARV discount +10.6/15.0
- Appreciation +10.0/10.0
- Cash flow +5.7/30.0
- Schools +4.4/10.0
- Livability +4.0/5.0
- Rent growth +2.5/5.0
- Condition / age +2.5/5.0
- 1% rule +1.9/10.0
- DSCR +0.1/10.0
$249,000
🖨 Deal sheet (PDF) 📄 Offer letter ✓ Due diligence
Listing remarks MLS
An Amazing Home that has been Incredibly Updated from the Stunning Backsplash and Counters to the Jaw Dropping Wood Floors. DO NOT Miss this Home! Additional features include an Isolated Master Suite with His & Her Closets, Separate Shower and Tub. Beautiful color scheme and decor are absolutely amazing. Quiet Backyard with additional sitting areas to enjoy cookouts and family time.
Key facts
- Open floor plan
- Two dining areas
- Quiet cul-de-sac
Tags
Neighborhood map
What this means for you Summary
Snapshot
- This is a 3-bed/2.0-bath single-family listed at $249k.
Deal economics
- At list price, monthly cash flow is $-504 ($-6k/yr) — negative.
- To cash-flow at today's rent, offer at most $160k (35.8% below list).
- To meet the 1% rule (rent ≥ 1% of price), the offer needs to be $172k (30.8% below list).
- Recommended offer: $160k (35.8% below list) — sets the bar for cash-flow.
Location & tenants
- Location reads 80/100 on livability (#43 in TX, #1,872 nationally) — a professional / high-income tenant draw. Strengths: cost of living A+, housing A+, health & safety A+; Watch: amenities F, commute F.
- Frenship ISD (urban): math 47% / reading 54% proficiency, ranked #162 of 826 in TX (top 20%) — acceptable for families but not a draw, mixed tenant base, ~2y average lease.
- Zoned schools: Bennett El (math 62% / reading 64%, grade B, #300 of 4,322 statewide, top 7%, 876 students, 43% FRL); Frenship Middle (math 46% / reading 50%, grade C-, #400 of 1,662 statewide, top 24%, 833 students, 47% FRL); Frenship H S (math 44% / reading 65%, grade C-, #379 of 1,632 statewide, top 26%, 3,247 students, 46% FRL).
- Market conditions: 474 active listings in the ZIP; 12 comparable units currently listed for rent nearby; rentals lingering (median 46d on market — plan ~5-8 weeks vacancy on turnover, expect pricing pressure); 58% of comp listings sitting > 30 days — soft ceiling on asking rent; solid renter incomes; 2,219 units permitted in Lubbock County in 2024 (252 in 5+ unit buildings).
Forward outlook
- In year one you build about $27k of equity ($2k loan paydown + $25k appreciation (10.0% local appreciation)).
- Lubbock County population projected at +39% by 2050 — long-run rental-demand tailwind backs the buy-and-hold thesis.
- By year 2, paydown + projected appreciation supports a ~$43k cash-out refi (75% LTV) — recoverable capital for the next deal without selling this one.
Negotiation context
- It's been on market 23 days — a 2% lower offer ($245k) is reasonable based on typical stale-listing flexibility.
Risks & watch-outs
- Climate carrying-cost: major wildfire risk; extreme-heat days projected 7→20/yr by 2055 (HVAC capex compounding) — expect insurance premiums to compound above CPI over the hold.
Questions for the listing agent
- What do current leases actually rent for vs. the listed asking? Can we see a recent rent roll and the last 12 months of T-12 income?
- Is there a deadline driving the sale (1031 exchange, divorce, estate, relocation)? That informs how much negotiation room exists.
- Schools are B-rated — typically a magnet for longer-tenancy family renters. What's the average tenant stay here, and is there a school-zone premium baked into asking?
- The area grade is low — what's the realistic commute time and amenity access for the typical tenant pool here? Any planned neighborhood developments (good or bad) we should know about?
- What's the average days-on-market for RENTAL listings here right now (not sales)? A rising rental-DOM trend means longer vacancies and softer asking-rent achievability than the comps imply.
- What's the recent tenant-quality profile in this submarket — average credit score on applications, eviction rate, late-payment / NSF rate, and stable-employment percentage? A property-management company in the area should have these aggregated.
- How much new for-sale + rental construction is in the pipeline within 1–3 miles? Heavy new supply typically softens prices + rents 12–24 months out; constrained supply supports both.
Investment metrics
- 1% rule
- 0.69% ✗
- Cap rate
- 3.86%
- Cash-on-cash
- -8.68%
- DSCR
- 0.61
- GRM
- 12.0
CMA / ARV
- ARV (median comp)
- $267,559
- List price
- $249,000
- Delta
- -6.94%
- Verdict
- FAIR
- Comps
- 1 within 2.0 mi
Projected returns pro-forma
10.0% appreciation · 3.0% rent growth · sell at horizon
- IRR
- 18.2%
- Equity multiple
- 2.49×
- Total profit
- $103,602
- Equity at exit
- $224,319
- IRR
- 17.0%
- Equity multiple
- 5.74×
- Total profit
- $330,580
- Equity at exit
- $483,752
Cash invested: $69,720 (down + closing). Projections, not guarantees.
Landlord ↔ Tenant lean methodology
- Overall (STATE)
- 87 Strongly Landlord-Friendly
- State Texas
- 87 Strongly Landlord-Friendly · R+5
- County
- — inherits STATE
- City
- — inherits STATE
ZIP-level market 79382
- Active inventory
- 474
- Price-to-rent
- 12.0×
Monthly cashflow live
- Estimated rent
- $1,722 high interval (Pro) →
- Mortgage (P&I)
- −$1,306
- Tax from tax record
- −$455 /mo · $5,465/yr
- Insurance
- −$104
- HOA
- −$0
- Vacancy / Maint / Mgmt
- −$362
- Net cashflow
- $-504
Break-even live
Sensitivity live
| Price | -10% $-363 | -5% $-434 | +0% $-504 | +5% $-575 | +10% $-645 |
|---|---|---|---|---|---|
| Rent | -10% $-640 | -5% $-572 | +0% $-504 | +5% $-436 | +10% $-368 |
| Rate | -1.0pp $-379 | -0.5pp $-441 | base $-504 | +0.5pp $-569 | +1.0pp $-635 |
UW: 25.0% down · 7.5% · 30yr · 1.5% tax · 5.0% vac · 8.0% maint · 8.0% mgmt
Financing live
Cash to close
- Down payment
- $62,250
- Closing costs
- $7,470
- Reserves months
- —
- Total cash needed
- —
Loan-product check · same deal, 3 products live
Conventional
25% down · 7.5% · 30yr
- Down + closing
- —
- Monthly P&I
- —
- Monthly cashflow
- —
- DSCR
- —
- Eligible?
- —
Personal DTI + credit; lowest rate.
DSCR
20% down · 8.5% · 30yr
- Down + closing
- —
- Monthly P&I
- —
- Monthly cashflow
- —
- DSCR
- —
- Eligible?
- —
No personal income docs; deal must DSCR.
Hard money
10% down · 12.0% · 12mo
- Down + closing
- —
- Monthly P&I
- —
- Monthly cashflow
- —
- DSCR
- —
- Eligible?
- —
Short-term bridge; refi at stabilization.
Rent comps 12 comps
| Address | Beds | Baths | Sqft | Rent | $/sqft | DOM | Units | Dist |
|---|---|---|---|---|---|---|---|---|
| 1517 Westminister Ave Wolfforth, TX | 3.0 | 2.0 | 1552 | $1,600 | $1.03 | 15d | 1 | 0.10mi |
| 1218 Preston TRL Unit A Wolfforth, TX | 3.0 | 2.0 | 1420 | $1,500 | $1.06 | 23d | 1 | 0.44mi |
| 816 N 4th St Wolfforth, TX | 4.0 | 2.0 | 1750 | $2,100 | $1.20 | 45d | 1 | 0.75mi |
| 5865 Virginia Ave Lubbock, TX | 3.0 | 2.0 | 1500 | $1,749 | $1.17 | 45d | 1 | 0.79mi |
| 6003 Venita Ave Lubbock, TX | 4.0 | 2.0 | 1600 | $1,800 | $1.12 | 45d | 1 | 0.85mi |
| 5805 Virginia Ave Lubbock, TX | 3.0 | 2.0 | 1377 | $1,800 | $1.31 | 45d | 1 | 0.88mi |
| 132 Calvin Dr Wolfforth, TX | 4.0 | 2.0 | 1652 | $2,300 | $1.39 | 15d | 1 | 0.90mi |
| 1224 Donald Preston Dr Unit B Wolfforth, TX | 3.0 | 2.0 | 1400 | $1,550 | $1.11 | 45d | 1 | 1.01mi |
| 1216 Donald Preston Dr Unit B Wolfforth, TX | 3.0 | 2.0 | 1450 | $1,400 | $0.97 | 45d | 1 | 1.01mi |
| 1019 Donald Preston Dr Unit A Wolfforth, TX | 3.0 | 2.0 | 1400 | $1,275 | $0.91 | 23d | 1 | 1.04mi |
| 1019 Donald Preston Dr Unit A Wolfforth, TX | 3.0 | 2.0 | 1400 | $1,275 | $0.91 | 45d | 1 | 1.04mi |
| 7811 86th St Lubbock, TX | 3.0 | 2.0 | 1710 | $2,025 | $1.18 | 23d | 1 | 1.26mi |
Listing history 16 events
-
2026-06-22days on market $249,000 Active 23 DOM
-
2026-06-19days on market $249,000 Active 20 DOM
-
2026-06-05days on market $249,000 Active 19 DOM
-
2026-06-03days on market $249,000 Active 18 DOM
-
2026-06-02days on market $249,000 Active 17 DOM
-
2026-06-01days on market $249,000 Active 16 DOM
-
2026-05-31days on market $249,000 Active 15 DOM
-
2026-05-30days on market $249,000 Active 14 DOM
-
2026-05-18status Pending 1481-char remark
-
2026-05-07$249,000 Active 1481-char remark
-
2022-09-26price $252,000
-
2022-09-06price $257,000
-
2017-08-03soldstatus
-
2017-08-02soldstatus
Show marketing remark (391 chars)
An Amazing Home that has been Incredibly Updated from the Stunning Backsplash and Counters to the Jaw Dropping Wood Floors. DO NOT Miss this Home! Additional features include an Isolated Master Suite with His & Her Closets, Separate Shower and Tub. Beautiful color scheme and decor are absolutely amazing. Quiet Backyard with additional sitting areas to enjoy cookouts and family time.
-
2017-06-29$179,900
Show marketing remark (391 chars)
An Amazing Home that has been Incredibly Updated from the Stunning Backsplash and Counters to the Jaw Dropping Wood Floors. DO NOT Miss this Home! Additional features include an Isolated Master Suite with His & Her Closets, Separate Shower and Tub. Beautiful color scheme and decor are absolutely amazing. Quiet Backyard with additional sitting areas to enjoy cookouts and family time.
-
2013-07-08soldstatus
ⓘ Source: listings_history table (triggers on properties + properties_extension) + one-shot
backfill from property_details.listing_events for pre-trigger history.
Tax reassessment forecast TX · Resets to sale price
- Current annual tax
- $5,465 · $455/mo
- Projected year-2 tax
- $5,465 · $455/mo
- Expected delta
- $0/yr ($0/mo · 0.0%)
ⓘ Screening estimate from a state-policy table — verify with the county assessor before closing.
Climate risk First Street
- Flood 1/10 Low FEMA zone X (unshaded) · 0% chance over 30 yrs
- Wildfire 7/10 Severe
- Heat 5/10 Major 7 d/yr ≥99°F today · 20 d/yr by 30 yrs out
- Wind 2/10 Low
- Air quality 2/10 Low 1 unhealthy d/yr today · 1 by 30 yrs out
Nearby sold comps map
Loading sold comps map…
Walkable amenities ~0.75 mi
Loading nearby amenities…
Taxation est. · year 1
- Rental income
- $20,666
- − Mortgage interest
- −$13,948
- − Property taxes
- −$5,465
- − Insurance
- −$1,245
- − Repairs & maintenance
- −$1,653
- − Management
- −$1,653
- − Depreciation
- −$7,244
- Taxable loss
- −$10,542
- Est. tax savings @ 24.0%
- +$2,530
- After-tax cash flow
- $-3,523/yr
For passive investors: Depreciation is non-cash, so a rental often shows a tax loss while cash-flowing — sheltering income. Rental losses are passive: they offset passive income freely, and up to $25,000/yr can offset ordinary (W-2) income if you actively participate and your MAGI is under $100k (phasing out to $0 by $150k); unused losses carry forward. On sale, claimed depreciation is recaptured at up to 25%, and gains may owe capital-gains tax (a 1031 exchange can defer both). Figures are a year-1 estimate at your 24.0% rate — not tax advice; consult a CPA.
Schools (NCES district)
- District
- Frenship ISD
- NCES district ID
- 4819830
- Math proficiency
- 47% ▼ -8.00%
- Reading proficiency
- 54% ▬ 0.00%
- Median HH income
- $54,376
- Composite
- 43.59/100
- National rank
- #2976
- State rank
- #162 of 826 in TX
Livability — Wolfforth
- Score
- 80/100
- State rank
- #43
- US rank
- #1872
Category grades
Schools grade is shown separately in the Schools card above.
Census & demographics
- Census place
- Wolfforth, TX
- County
- Lubbock County · 293,542 people
- City population
- 10,512
- Metro
- Lubbock, TX
- Population (ZIP)
- 10,512
- Household income
- $84,457
- Rent vs Own
- Severe rent burden
- 135.0
Population outlook (Lubbock County) Hauer SSP2
- Today (2025)
- 345,960 people
- By 2030
- 371,449 · +7.4%
- By 2040
- 424,539 · +22.7%
- By 2050
- 481,150 · +39.1%
- By 2075
- 633,467 · +83.1%
- By 2100
- 746,853 · +115.9%
Race, ethnicity, and origin ACS 2023
- Neighborhood character
- Majority White (64%)
- Race & ethnicity
- White 64% Hispanic / Latino 31% Two or more races 18% Black 1%
- Hispanic origin (detail)
- Mexican 28%
- Common ancestry
- Italian 4% Slovak 2% Lithuanian 2%
- Foreign-born
- 4% · Canada
- Languages at home
- 85% English-only · Spanish 14%
Political lean MEDSL · Lubbock
- 2024 margin
- Solid R (+39.5) · D 29.7% · R 69.2% · Other 1.0%
- 2008→2024 swing
- -2.8pp toward R · 2008: -36.7pp · 2024: -39.5pp
- All cycles
- 2024: R+39.5 2020: R+32.2 2016: R+38.4 2012: R+40.9 2008: R+36.7
Not yet ingested
- Civics
- —
Market trends
- HPI YoY
- ▲ 166.08%
- Current HPI
- 561.4491
- Rent YoY
- —
- Metro
- Lubbock, TX
- State GDP YoY
- ▲ 3.95%
- F500 in state
- 110
Industry mix (Fortune 500 HQ in TX)
| Industry | F500 HQs | Revenue |
|---|---|---|
| Energy | 16 | $1,198B |
|
||
| Technology | 5 | $198B |
|
||
| Engineering / Construction | 4 | $72B |
|
||
| Energy Services | 3 | $60B |
|
||
| Utilities | 3 | $41B |
|
||
| Healthcare | 2 | $330B |
|
||
Price history
+40.1% since first listed6 events — show timeline
- 2022-09-26 Price Changed $252,000 LARMLS
- 2022-09-06 Price Changed $257,000 LARMLS
- 2017-08-03 Sold (Public Records) — Public Records
- 2017-08-02 Sold (MLS) — LARMLS
- 2017-06-29 Listed $179,900 LARMLS
- 2013-07-08 Sold (Public Records) — Public Records
Property tax history
+2.2%/yrLatest (2025): $5,465 · +12.8% YoY. Source: county tax records.
Cash-flow waterfall
monthlySold comps — $/sqft
last 12 mo · ≤1 miLoading sold comps…