 Multi-family
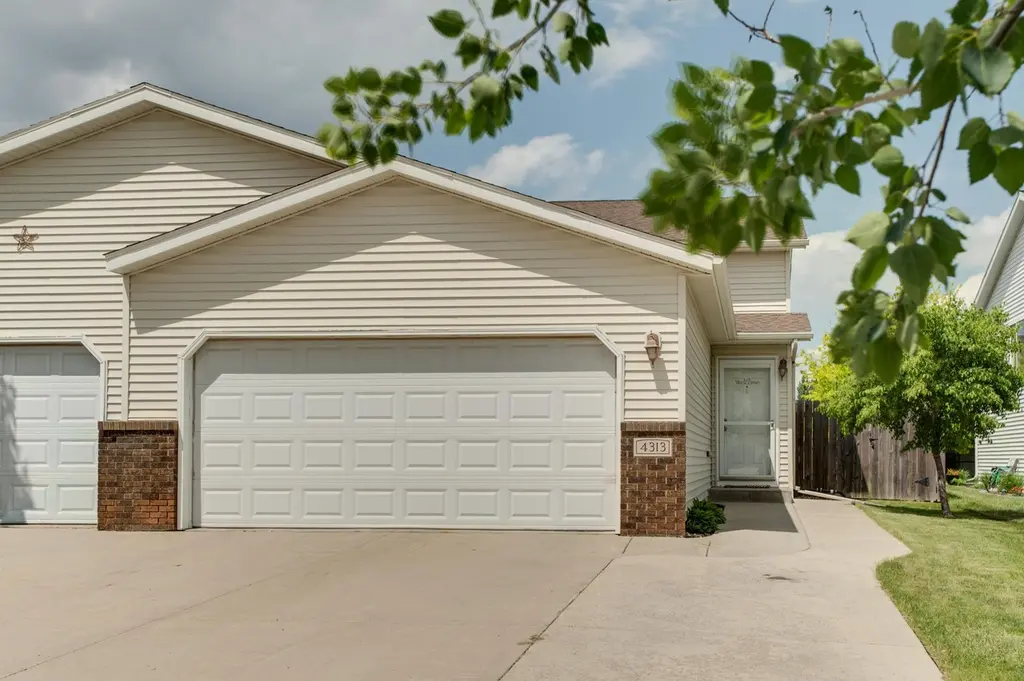
4313 39 1/2 Ave S · Fargo, ND
Flood risk 1/10 · Minimal
- FEMA flood zone
- X (shaded)
- Chance of flooding over 30 yrs
- 0.0%
- Est. flood insurance / yr
- $473 – $860
Fire risk 1/10 · Minimal
- Est. fire insurance / yr
- $1,289 – $2,393
Heat risk 2/10 · Minimal
- Hot days now (above 98°F)
- 7 days/yr
- Hot days in 30 yrs
- 12 days/yr
Wind risk 2/10 · Minimal
- Chance of severe wind over 30 yrs
- —
Air-quality risk 3/10 · Minor
- Unhealthy air days now
- 3 days/yr
- Unhealthy air days in 30 yrs
- 3 days/yr
Risk factors via First Street. Map © Google.
Why this score? — see what drove the C- grade
The composite is a weighted blend of 9 inputs, each scored 0–100. Each bar is that input's sub-score; the figure is the points it added to the 100-point composite (weight × sub-score).
- Cash flow +18.4/30.0
- ARV discount +7.5/15.0
- DSCR +5.8/10.0
- 1% rule +4.2/10.0
- Livability +4.2/5.0
- Rent growth +3.8/5.0
- Schools +3.6/10.0
- Condition / age +2.5/5.0
- Appreciation +0.0/10.0
$289,900
🖨 Deal sheet 📄 Offer letter ✓ Due diligence
Multi-family units
County records classify this as Multi-Family (2-4 Unit). Listing-text estimate: 1 unit. estimate disagrees with records
Listing remarks MLS
Easy living this nicely appointed twin-home, New Shingles & Skylights, Carpet and Fresh paint,Extra Wide Driveway and Sidewalk, Fenced Yard, Stainless Steel Appliances, Eat up Center Island, Extra Deep Garage. Convenient location. See it today!
Key facts
- Drain tile system
- Fresh paint
- New carpet
Tags
Property features AI
Finance
- Other: Above-grade and below-grade finished areas present (both levels finished)
Exterior
- Parking: Attached garage with space for 2 cars
- Utilities: City water connected; City sewer connected; Electric service (fuel: electric)
- Home design: Residential attached property; Split-entry (bi-level) design; Entry levels on upper and lower levels
- Construction: Poured concrete foundation
- Exterior features: Vinyl exterior; Deck; Full yard fencing; Lot approximately 33 x 116 feet
Interior
- Kitchen: Range; Microwave; Dishwasher; Refrigerator; Disposal
- Bedrooms: 3 bedrooms (bedrooms located on upper and lower levels)
- Flooring: Tile floors (in some areas)
- Bathrooms: 2 full bathrooms (Hollywood bath configuration)
- Heating & cooling: Forced-air heating; Central air conditioning
- Interior features: Window coverings; Drain-tiled basement with sump pump; Primary bedroom with walk-in closet; Tile floors in at least some areas
- Laundry & utility: Washer and dryer included; Laundry room on lower level; Electric water heater; Utility room on lower level
Neighborhood map
What this means for you Summary
Snapshot
- This is a 3-bed/2.0-bath multifamily listed at $290k.
Deal economics
- At list price, monthly cash flow is $273 ($3k/yr) — positive.
- The deal already cash-flows at list — no discount required.
- To meet the 1% rule (rent ≥ 1% of price), the offer needs to be $268k (7.7% below list).
- Recommended offer: $268k (7.7% below list) — sets the bar for 1% rule.
- Cap rate 7.4% vs local median 2.5% in Fargo — top-decile yield for the area; either an underpriced asset or a hidden risk that comps aren't pricing in. Stress-test before assuming the spread holds.
Location & tenants
- Location reads 85/100 on livability (#1 in ND, #605 nationally) — a professional / high-income tenant draw. Strengths: amenities A+, commute A+, cost of living A+; Watch: crime F.
- Fargo 1 (urban): math 41% / reading 44% proficiency, ranked #28 of 53 in ND (top 53%) — families likely to look elsewhere, expect single-tenant / working-renter base with shorter leases.
- Market conditions: Rents rising fast (+5.1%/yr); 358 active listings in the ZIP; 35 comparable units currently listed for rent nearby; rentals leasing fast (median 14d on market — plan ~1-2 weeks tenant-placement turnaround); solid renter incomes; 1,218 units permitted in Cass County in 2024 (410 in 5+ unit buildings).
- This rent runs 37% of the median local income ($86k/yr) — at the standard rent-burdened threshold; future hikes will face affordability resistance.
Forward outlook
- Local home prices are declining (-3.0%/yr); year-one equity from $2k of loan paydown is wiped out by about $9k of value loss. Plan a longer hold.
- Cass County population projected at +69% by 2050 — long-run rental-demand tailwind backs the buy-and-hold thesis.
Negotiation context
- Only 10 days on market — expect competitive offers; lowballing is unlikely to land.
- 6 sale attempts since 13y ago with the ask held roughly flat each time — persistent listings suggest the price (not the market) is what's stuck; bring a comps-based counter.
Questions for the listing agent
- Is there a deadline driving the sale (1031 exchange, divorce, estate, relocation)? That informs how much negotiation room exists.
- Crime grade is F in this area — have there been break-ins, vandalism, or insurance claims at this property in the last 3 years? What carrier currently insures it and at what premium?
- What's the average days-on-market for RENTAL listings here right now (not sales)? A rising rental-DOM trend means longer vacancies and softer asking-rent achievability than the comps imply.
- What's the recent tenant-quality profile in this submarket — average credit score on applications, eviction rate, late-payment / NSF rate, and stable-employment percentage? A property-management company in the area should have these aggregated.
- How much new apartment / multifamily construction is in the pipeline within 1–3 miles? Heavy new supply (>2% of stock underway) typically softens rents 12–24 months out; light construction supports rent growth.
Investment metrics
- 1% rule
- 0.92% ✗
- Cap rate
- 7.42%
- Cash-on-cash
- 4.03%
- DSCR
- 1.18
- GRM
- 9.0
CMA / ARV
No comps found within radius.
Projected returns pro-forma
-3.0% appreciation · 5.13% rent growth · sell at horizon
- IRR
- -7.8%
- Equity multiple
- 0.71×
- Total profit
- $-23,816
- Equity at exit
- $43,225
- IRR
- 4.1%
- Equity multiple
- 1.33×
- Total profit
- $26,483
- Equity at exit
- $25,065
Cash invested: $81,172 (down + closing). Projections, not guarantees.
Landlord ↔ Tenant lean methodology
- Overall (STATE)
- 82 Strongly Landlord-Friendly
- State North Dakota
- 82 Strongly Landlord-Friendly · R+20
- County
- — inherits STATE
- City
- — inherits STATE
ZIP-level market 58104
- Home prices YoY
- -29.6%
- Rents YoY
- 5.1%
- Active inventory
- 358
- Price-to-rent
- 18.1×
Monthly cashflow live
- Estimated rent
- $2,676 medium interval (Pro) →
- Mortgage (P&I)
- −$1,520
- Tax from tax record
- −$200 /mo · $2,404/yr
- Insurance
- −$121
- HOA
- −$0
- Vacancy / Maint / Mgmt
- −$562
- Net cashflow
- $273
Break-even live
2-unit breakdown (identical units grouped — click to expand)
| Units | Beds | Baths | Est. rent |
|---|---|---|---|
| 2× units | 3 | 2 | $2,676 |
| #1 | 3 | 2 | $1,338 |
| #2 | 3 | 2 | $1,338 |
| Total (2 units) | $2,676 | ||
UW: 25.0% down · 7.5% · 30yr · 1.5% tax · 5.0% vac · 8.0% maint · 8.0% mgmt
Financing live
Cash to close
- Down payment
- $72,475
- Closing costs
- $8,697
- Reserves months
- —
- Total cash needed
- —
Loan-product check · same deal, 3 products live
Conventional
25% down · 7.5% · 30yr
- Down + closing
- —
- Monthly P&I
- —
- Monthly cashflow
- —
- DSCR
- —
- Eligible?
- —
Personal DTI + credit; lowest rate.
DSCR
20% down · 8.5% · 30yr
- Down + closing
- —
- Monthly P&I
- —
- Monthly cashflow
- —
- DSCR
- —
- Eligible?
- —
No personal income docs; deal must DSCR.
Hard money
10% down · 12.0% · 12mo
- Down + closing
- —
- Monthly P&I
- —
- Monthly cashflow
- —
- DSCR
- —
- Eligible?
- —
Short-term bridge; refi at stabilization.
Rent comps 35 comps
| Address | Beds | Baths | Sqft | Rent | $/sqft | DOM | Units | Dist |
|---|---|---|---|---|---|---|---|---|
| 3720 42nd St S Fargo, ND | 2.0–4.0 | 1.0–2.0 | 1105 | $1,118 | $1.01 | 21d | 1 | 0.32mi |
| 4452 47th St S Fargo, ND | 1.0–3.0 | 1.0–2.0 | 956 | $1,313 | $1.37 | 13d | 10 | 0.63mi |
| 4551 47th Ave S Fargo, ND | 2.0 | 1.0–2.0 | 987 | $1,475 | $1.49 | 13d | 21 | 0.68mi |
| 4901 44th Ave S Fargo, ND | 1.0–3.0 | 1.0–2.0 | 948 | $1,325 | $1.40 | 13d | 22 | 0.71mi |
| 3548 47th St S Fargo, ND | 1.0–2.0 | 1.0–2.0 | 892 | $1,235 | $1.38 | 13d | 3 | 0.72mi |
| 4251 33rd Ave S Fargo, ND | 1.0–3.0 | 1.0–2.0 | 975 | $1,115 | $1.14 | 21d | 2 | 0.78mi |
| 4261 33rd Ave S Fargo, ND | 2.0 | 1.0 | 1000 | $950 | $0.95 | 21d | 1 | 0.78mi |
| 4281 33rd Ave S Fargo, ND | 1.0–3.0 | 1.0–2.0 | 975 | $1,165 | $1.19 | 13d | 2 | 0.78mi |
| 4231 33rd Ave S Fargo, ND | 2.0 | 1.0 | 900 | $900 | $1.00 | 21d | 1 | 0.79mi |
| 4221 33rd Ave S Fargo, ND | 2.0 | 1.0 | 900 | $900 | $1.00 | 21d | 1 | 0.79mi |
| 4045 34th Ave S Fargo, ND | 1.0–2.0 | 1.0–2.0 | 886 | $1,265 | $1.43 | 13d | 15 | 0.79mi |
| 4201 33rd Ave S Fargo, ND | 2.0 | 1.0 | 900 | $900 | $1.00 | 13d | 2 | 0.80mi |
| 3330 42nd St SW Fargo, ND | 1.0–3.0 | 1.0–2.0 | 1051 | $1,095 | $1.04 | 21d | 1 | 0.81mi |
| 4835 38th St S Fargo, ND | 3.0 | 1.0–2.0 | 956 | $1,765 | $1.85 | 13d | 36 | 0.89mi |
| 4550 49th Ave S Fargo, ND | 3.0 | 1.0–2.0 | 996 | $1,945 | $1.95 | 13d | 25 | 0.98mi |
| 5100 44th Ave S Fargo, ND | 1.0–3.0 | 1.0–2.0 | 979 | $1,380 | $1.41 | 13d | 15 | 0.98mi |
| 4425 31st Ave S Fargo, ND | 1.0–2.0 | 1.0–2.0 | 1111 | $1,285 | $1.16 | 13d | 2 | 1.11mi |
| 5207 33rd Ave S Fargo, ND | 1.0–3.0 | 1.0–2.0 | 1090 | $1,350 | $1.24 | 21d | 1 | 1.15mi |
| 4422 30th Ave S Fargo, ND | 1.0–2.0 | 1.0–2.0 | 834 | $1,139 | $1.36 | 13d | 3 | 1.17mi |
| 4240 53rd Ave S Unit 4240-202 Fargo, ND | 2.0 | 2.0 | 982 | $1,275 | $1.30 | 21d | 1 | 1.20mi |
| 5599 36th Ave S Fargo, ND | 1.0–3.0 | 1.0–2.0 | 1351 | $2,400 | $1.78 | 13d | 9 | 1.24mi |
| 4920 30th Ave S Fargo, ND | 3.0 | 1.0–2.0 | 999 | $1,765 | $1.77 | 13d | 41 | 1.30mi |
| 5601 34th Ave S Fargo, ND | 2.0 | 1.0–2.0 | 918 | $1,830 | $1.99 | 13d | 11 | 1.32mi |
| 4389 Calico Dr S Fargo, ND | 2.0 | 2.0 | 1100 | $1,195 | $1.09 | 21d | 1 | 1.34mi |
| 2836 41st St S Fargo, ND | 2.0 | 1.0–2.0 | 965 | $1,480 | $1.53 | 13d | 13 | 1.35mi |
| 5671 34th Ave S Fargo, ND | 3.0 | 1.0–2.0 | 1008 | $2,795 | $2.77 | 13d | 33 | 1.38mi |
| 3230 Seter Pkwy S Fargo, ND | 1.0–3.0 | 1.0–2.0 | 1227 | $1,825 | $1.49 | 13d | 7 | 1.38mi |
| 4385 Calico Dr S Fargo, ND | 1.0–2.0 | 1.0–2.0 | 900 | $1,195 | $1.33 | 21d | 1 | 1.39mi |
| 5400 42nd St S Fargo, ND | 1.0–3.0 | 1.0–2.0 | 978 | $1,390 | $1.42 | 13d | 6 | 1.39mi |
| 5601 33rd Ave S Fargo, ND | 3.0 | 1.0–3.0 | 1009 | $2,695 | $2.67 | 13d | 50 | 1.41mi |
| 3301 32nd St S Fargo, ND | 3.0 | 1.0–2.0 | 808 | $1,483 | $1.83 | 13d | 9 | 1.41mi |
| 2777 47th St S Fargo, ND | 1.0–3.0 | 1.0–2.0 | 1075 | $1,295 | $1.20 | 21d | 1 | 1.43mi |
| 4393 Calico Dr S Fargo, ND | 1.0–2.0 | 1.0–2.0 | 950 | $1,195 | $1.26 | 21d | 2 | 1.44mi |
| 4431 Calico Dr S Fargo, ND | 1.0–2.0 | 1.0–2.0 | 950 | $1,195 | $1.26 | 21d | 1 | 1.45mi |
| 3760 55th Ave S Fargo, ND | 3.0 | 1.0–2.0 | 910 | $1,900 | $2.09 | 13d | 37 | 1.46mi |
Listing history 8 events
-
2026-06-18days on market $289,900 Active 10 DOM
-
2026-06-17days on market $289,900 Active 9 DOM
-
2026-06-16days on market $289,900 Active 8 DOM
-
2026-06-15days on market $289,900 Active 7 DOM
-
2026-06-14days on market $289,900 Active 5 DOM
-
2026-06-13days on market $289,900 Active 4 DOM
-
2026-06-10days on market $289,900 Active 2 DOM
-
2026-06-09$289,900 Active 1 DOM
ⓘ Source: listings_history table (triggers on properties + properties_extension) + one-shot
backfill from property_details.listing_events for pre-trigger history.
Tax reassessment forecast ND · Resets to sale price
- Current annual tax
- $2,404 · $200/mo
- Projected year-2 tax
- $2,841 · $237/mo
- Expected delta
- +$437/yr (+$36/mo · 18.2%)
ⓘ Screening estimate from a state-policy table — verify with the county assessor before closing.
Climate risk First Street
- Flood 1/10 Low FEMA zone X (shaded) · 0% chance over 30 yrs
- Wildfire 1/10 Low
- Heat 2/10 Low 7 d/yr ≥98°F today · 12 d/yr by 30 yrs out
- Wind 2/10 Low
- Air quality 3/10 Moderate 3 unhealthy d/yr today · 3 by 30 yrs out
Nearby sold comps map
Loading sold comps map…
Walkable amenities ~0.75 mi
Loading nearby amenities…
Taxation est. · year 1
- Rental income
- $32,112
- − Mortgage interest
- −$16,239
- − Property taxes
- −$2,404
- − Insurance
- −$1,450
- − Repairs & maintenance
- −$2,569
- − Management
- −$2,569
- − Depreciation
- −$8,433
- Taxable loss
- −$1,552
- Est. tax savings @ 24.0%
- +$373
- After-tax cash flow
- $3,644/yr
For passive investors: Depreciation is non-cash, so a rental often shows a tax loss while cash-flowing — sheltering income. Rental losses are passive: they offset passive income freely, and up to $25,000/yr can offset ordinary (W-2) income if you actively participate and your MAGI is under $100k (phasing out to $0 by $150k); unused losses carry forward. On sale, claimed depreciation is recaptured at up to 25%, and gains may owe capital-gains tax (a 1031 exchange can defer both). Figures are a year-1 estimate at your 24.0% rate — not tax advice; consult a CPA.
Schools (NCES district)
- District
- Fargo 1
- NCES district ID
- 3806780
- Math proficiency
- 41% ▼ -7.00%
- Reading proficiency
- 44% ▼ -7.00%
- Median HH income
- $46,524
- Composite
- 36.23/100
- National rank
- #4721
- State rank
- #28 of 53 in ND
Livability — Fargo
- Score
- 85/100
- State rank
- #1
- US rank
- #605
Category grades
Schools grade is shown separately in the Schools card above.
Census & demographics
- Census place
- Fargo, ND
- County
- Cass County · 177,143 people
- City population
- 130,876
- Metro
- Fargo, ND-MN
- Population (ZIP)
- 49,168
- Household income
- $85,747
- Rent vs Own
- Severe rent burden
- 2039.0
Population outlook (Cass County) Hauer SSP2
- Today (2025)
- 223,771 people
- By 2030
- 251,835 · +12.5%
- By 2040
- 311,816 · +39.3%
- By 2050
- 378,694 · +69.2%
- By 2075
- 571,386 · +155.3%
- By 2100
- 769,727 · +244.0%
Race, ethnicity, and origin ACS 2023
- Neighborhood character
- Predominantly White (83%)
- Race & ethnicity
- White 83% Black 7% Two or more races 5% Asian 4% Hispanic / Latino 2%
- Common ancestry
- Portuguese 27% Lithuanian 4% Romanian 2%
- Foreign-born
- 9% · Canada, China
- Languages at home
- 92% English-only · Korean 1% Spanish 1% Russian/Polish/Slavic 1%
Political lean MEDSL · Cass
- 2024 margin
- Lean R (+8.4) · D 44.9% · R 53.3% · Other 1.9%
- 2008→2024 swing
- -15.5pp toward R · 2008: 7.1pp · 2024: -8.4pp
- All cycles
- 2024: R+8.4 2020: R+2.7 2016: R+10.7 2012: R+3.0 2008: D+7.1
Not yet ingested
- Civics
- —
Market trends
- HPI YoY
- ▼ -78.58%
- Current HPI
- 187.1707
- Rent YoY
- ▲ 5.13%
- Metro
- Fargo, ND-MN
- State GDP YoY
- ▲ 2.09%
- F500 in state
- 2
Industry mix (Fortune 500 HQ in ND)
| Industry | F500 HQs | Revenue |
|---|---|---|
| Utilities / Construction | 1 | $6B |
|
||
Price history
+117.2% since first listed18 events — show timeline
- 2026-06-08 Listed $289,900 NORTHSTARMLS as Distributed by MLS Grid
- 2024-04-24 Sold (Public Records) $262,000 Public Records
- 2024-04-18 Sold (MLS) $262,000 NORTHSTARMLS as Distributed by MLS Grid
- 2024-03-18 Listing Removed — NORTHSTARMLS as Distributed by MLS Grid
- 2024-03-02 Listed $262,000 NORTHSTARMLS as Distributed by MLS Grid
- 2023-11-17 Listing Removed — NORTHSTARMLS as Distributed by MLS Grid
- 2023-10-08 Listed $245,000 NORTHSTARMLS as Distributed by MLS Grid
- 2022-05-12 Sold (Public Records) $232,700 Public Records
- 2022-05-12 Sold (MLS) $232,700 NORTHSTARMLS as Distributed by MLS Grid
- 2022-03-15 Listed $219,900 NORTHSTARMLS as Distributed by MLS Grid
- 2015-06-04 Sold (Public Records) $176,900 Public Records
- 2015-06-03 Sold (MLS) $176,900 NORTHSTARMLS as Distributed by MLS Grid
- 2015-03-15 Listed $172,900 NORTHSTARMLS as Distributed by MLS Grid
- 2013-05-16 Sold (Public Records) $136,000 Public Records
- 2013-05-16 Sold (MLS) $136,000 NORTHSTARMLS as Distributed by MLS Grid
- 2013-02-22 Listed $139,900 NORTHSTARMLS as Distributed by MLS Grid
- 2010-10-29 Sold (Public Records) $135,000 Public Records
- 2006-10-09 Sold (Public Records) $133,500 Public Records
Property tax history
-0.2%/yrLatest (2025): $2,404 · -37.3% YoY. Source: county tax records.
Cash-flow waterfall
monthlySold comps — $/sqft
last 12 mo · ≤1 miLoading sold comps…