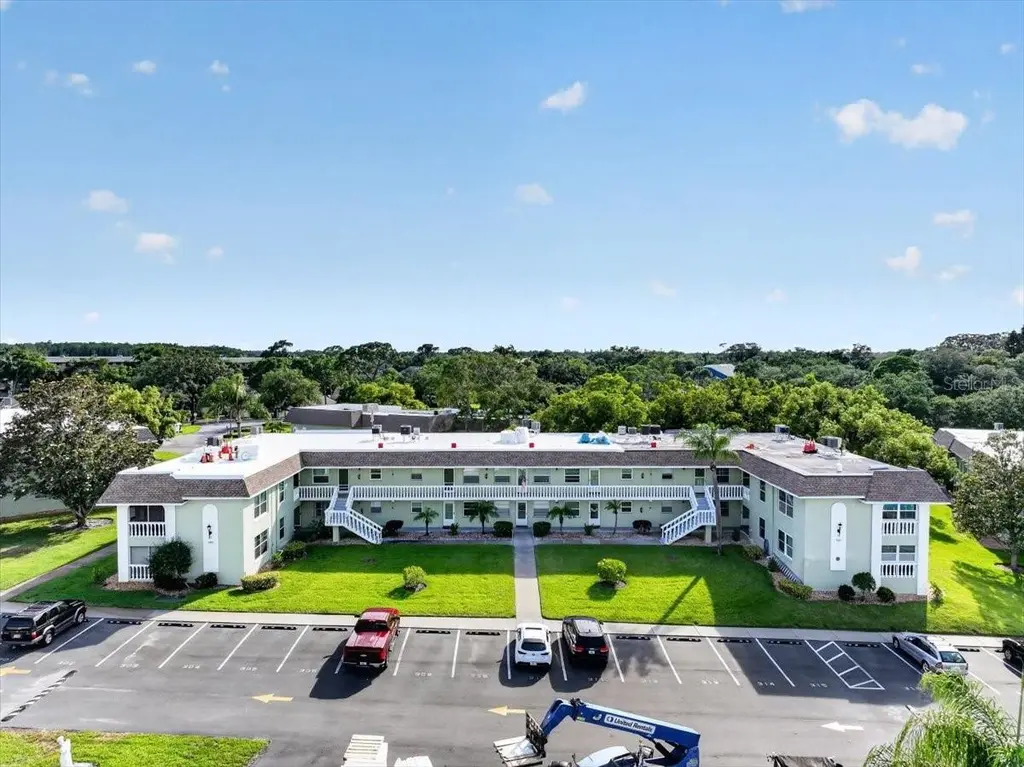
1250 S Pinellas Ave #306 · Tarpon Springs, FL
Flood risk No data
- FEMA flood zone
- —
- Chance of flooding over 30 yrs
- —
- Est. flood insurance / yr
- —
Fire risk No data
- Est. fire insurance / yr
- —
Heat risk No data
- Hot days now (above threshold)
- —
- Hot days in 30 yrs
- —
Wind risk No data
- Chance of severe wind over 30 yrs
- —
Air-quality risk No data
- Unhealthy air days now
- —
- Unhealthy air days in 30 yrs
- —
Risk factors via First Street. Map © Google.
Why this score? — see what drove the C grade
The composite is a weighted blend of 9 inputs, each scored 0–100. Each bar is that input's sub-score; the figure is the points it added to the 100-point composite (weight × sub-score).
- Cash flow +20.4/30.0
- 1% rule +10.0/10.0
- ARV discount +7.5/15.0
- DSCR +6.5/10.0
- Schools +4.3/10.0
- Livability +3.4/5.0
- Condition / age +2.5/5.0
- Rent growth +2.2/5.0
- Appreciation +0.0/10.0
$89,900
🖨 Deal sheet (PDF) 📄 Offer letter ✓ Due diligence
Listing remarks MLS
Remodeled 1 Bedroom, 1 Bathroom ground floor unit condo.
Key facts
- New walk in shower
- Enclosed sunroom
- Updated kitchen
Tags
Property features AI
Finance
- Other: Unit is offered furnished
- Financial info: Monthly condo/HOA fee $460; total annual fees $5,520; Lease restrictions apply
- HOA & community: Monthly condo/association fee of $460 (includes cable TV, pool, insurance, internet, structure and grounds maintenance, pest control, recreational facilities, sewer, trash, water); Association required with approval process; Association name: Toucan Property Management; Community features include clubhouse and pool; Community has deed restrictions and sidewalks; Senior community; Pets allowed (max weight 24 lbs)
Exterior
- Parking: Details not provided
- Utilities: Public water; Public sewer; Cable connected; Electricity connected
- Home design: Condominium; 2-story building; Unit on floor 1; Faces east; Located within city limits; Paved road access
- Construction: Block construction; Membrane and shingle roof; Slab foundation; Building/complex identified as Building 300
- Exterior features: Enclosed patio/porch; Porch; Exterior lighting; Sidewalks; Sliding doors; Tennis courts; Private heated gunite in-ground pool
Interior
- Kitchen: Dishwasher; Disposal; Microwave; Range; Refrigerator
- Bedrooms: 1 bedroom
- Flooring: Carpet; Ceramic tile; Laminate
- Bathrooms: 1 full bathroom
- Heating & cooling: Central heating; Central air conditioning
- Interior features: Ceiling fans; Thermostat; Window treatments; Blinds; Storage rooms
- Laundry & utility: No in-unit laundry (none listed)
Neighborhood map
What this means for you Summary
Snapshot
- This is a 1-bed/1.0-bath condo listed at $90k.
Deal economics
- At list price, monthly cash flow is $117 ($1k/yr) — positive.
- The deal already cash-flows at list — no discount required.
- Meets the 1% rule at list price ($1k rent vs $90k).
- Cap rate 7.9% vs local median 3.3% in Tarpon Springs — top-decile yield for the area; either an underpriced asset or a hidden risk that comps aren't pricing in. Stress-test before assuming the spread holds.
Location & tenants
- Location reads 68/100 on livability (#502 in FL) — a middle-class / working-renter tenant base. Strengths: housing A+, cost of living A; Watch: employment C-, amenities F, commute F.
- Pinellas (suburban): math 51% / reading 51% proficiency, ranked #31 of 73 in FL (top 42%) — acceptable for families but not a draw, mixed tenant base, ~2y average lease.
- Zoned schools: Sunset Hills Elementary School (math 72% / reading 72%, grade A-, #288 of 2,144 statewide, top 15%, 451 students, 52% FRL); Tarpon Springs Middle School (math 59% / reading 61%, grade B, #135 of 571 statewide, top 24%, 644 students, 50% FRL); Tarpon Springs High School (math 30% / reading 47%, grade F, #321 of 667 statewide, top 49%, 1,139 students, 46% FRL) — zoned schools at 49% FRL track the district average.
- Market conditions: Rents soft (-1.2%/yr); 404 active listings in the ZIP; 10 comparable units currently listed for rent nearby; rentals at typical pace (median 16d on market — plan ~3-4 weeks tenant-placement turnaround); 2,676 units permitted in Pinellas County in 2024 (1,422 in 5+ unit buildings).
Forward outlook
- Local home prices are declining (-3.0%/yr); year-one equity from $622 of loan paydown is wiped out by about $3k of value loss. Plan a longer hold.
- Pinellas County population projected at +14% by 2050 — modest demand growth; plan on rents tracking national, not racing it.
Negotiation context
- Only 7 days on market — expect competitive offers; lowballing is unlikely to land.
- 2 sale attempts since 7y ago with the ask held roughly flat each time — persistent listings suggest the price (not the market) is what's stuck; bring a comps-based counter.
- Current owner paid $70k; 28% above their basis — modest negotiation headroom, anchor on the comps not their cost.
Risks & watch-outs
- Watch-outs: HOA is 32% of rent.
Questions for the listing agent
- Built in 1974 — when were the roof, HVAC, electrical panel, plumbing, and water heater last replaced?
- What does the HOA fee cover, when was the last increase, and are there any pending special assessments or reserve-fund shortfalls?
- Any open or pending special assessments — roof, HVAC, plumbing, elevator, façade? What's the per-unit balance and payoff schedule, and is the seller paying it off at close or rolling it to the buyer?
- Is there a deadline driving the sale (1031 exchange, divorce, estate, relocation)? That informs how much negotiation room exists.
- Schools are A-rated — typically a magnet for longer-tenancy family renters. What's the average tenant stay here, and is there a school-zone premium baked into asking?
- What's the average days-on-market for RENTAL listings here right now (not sales)? A rising rental-DOM trend means longer vacancies and softer asking-rent achievability than the comps imply.
- What's the recent tenant-quality profile in this submarket — average credit score on applications, eviction rate, late-payment / NSF rate, and stable-employment percentage? A property-management company in the area should have these aggregated.
- How much new apartment / multifamily construction is in the pipeline within 1–3 miles? Heavy new supply (>2% of stock underway) typically softens rents 12–24 months out; light construction supports rent growth.
Investment metrics
- 1% rule
- 1.59% ✓
- Cap rate
- 7.86%
- Cash-on-cash
- 5.58%
- DSCR
- 1.25
- GRM
- 5.2
CMA / ARV
No comps found within radius.
Projected returns pro-forma
-3.0% appreciation · 0.0% rent growth · sell at horizon
- IRR
- -12.7%
- Equity multiple
- 0.56×
- Total profit
- $-11,041
- Equity at exit
- $13,404
- IRR
- -13.1%
- Equity multiple
- 0.40×
- Total profit
- $-15,158
- Equity at exit
- $7,773
Cash invested: $25,172 (down + closing). Projections, not guarantees.
Landlord ↔ Tenant lean methodology
- Overall (STATE)
- 87 Strongly Landlord-Friendly
- State Florida
- 87 Strongly Landlord-Friendly · R+3
- County
- — inherits STATE
- City
- — inherits STATE
ZIP-level market 34689
- Rents YoY
- -1.2%
- Active inventory
- 404
- Price-to-rent
- 5.2×
Monthly cashflow live
- Estimated rent
- $1,432 high interval (Pro) →
- Mortgage (P&I)
- −$471
- Tax from tax record
- −$45 /mo · $544/yr
- Insurance
- −$37
- HOA
- −$460
- Vacancy / Maint / Mgmt
- −$301
- Net cashflow
- $117
Break-even live
Sensitivity live
| Price | -10% $168 | -5% $143 | +0% $117 | +5% $92 | +10% $66 |
|---|---|---|---|---|---|
| Rent | -10% $4 | -5% $61 | +0% $117 | +5% $174 | +10% $230 |
| Rate | -1.0pp $162 | -0.5pp $140 | base $117 | +0.5pp $94 | +1.0pp $70 |
UW: 25.0% down · 7.5% · 30yr · 1.5% tax · 5.0% vac · 8.0% maint · 8.0% mgmt
Financing live
Cash to close
- Down payment
- $22,475
- Closing costs
- $2,697
- Reserves months
- —
- Total cash needed
- —
Loan-product check · same deal, 3 products live
Conventional
25% down · 7.5% · 30yr
- Down + closing
- —
- Monthly P&I
- —
- Monthly cashflow
- —
- DSCR
- —
- Eligible?
- —
Personal DTI + credit; lowest rate.
DSCR
20% down · 8.5% · 30yr
- Down + closing
- —
- Monthly P&I
- —
- Monthly cashflow
- —
- DSCR
- —
- Eligible?
- —
No personal income docs; deal must DSCR.
Hard money
10% down · 12.0% · 12mo
- Down + closing
- —
- Monthly P&I
- —
- Monthly cashflow
- —
- DSCR
- —
- Eligible?
- —
Short-term bridge; refi at stabilization.
Rent comps 10 comps
| Address | Beds | Baths | Sqft | Rent | $/sqft | DOM | Units | Dist |
|---|---|---|---|---|---|---|---|---|
| 1250 S Pinellas Ave #504 Tarpon Springs, FL | 1.0 | 1.0 | 565 | $1,099 | $1.95 | 26d | 1 | 0.06mi |
| 812 Bayou Ave Unit B Tarpon Springs, FL | 1.0 | 1.0 | 675 | $1,450 | $2.15 | 26d | 1 | 0.26mi |
| 1185 S Pinellas Ave Tarpon Springs, FL | 1.0–3.0 | 1.0–2.0 | 1013 | $1,572 | $1.55 | 0d | 20 | 0.27mi |
| 101 W Lemon St Apt 3 Tarpon Springs, FL | 1.0 | 1.0 | 650 | $1,350 | $2.08 | 23d | 1 | 0.55mi |
| 101 W Lemon St Unit 4 Tarpon Springs, FL | 1.0 | 1.0 | 650 | $1,450 | $2.23 | 16d | 1 | 0.55mi |
| 101 W Lemon St Tarpon Springs, FL | 1.0 | 1.0 | 650 | $1,450 | $2.23 | 6d | 1 | 0.55mi |
| 105 S Spring Blvd Unit 10 Tarpon Springs, FL | 1.0 | 1.0 | 700 | $1,350 | $1.93 | 26d | 1 | 0.60mi |
| 542 Division St Tarpon Springs, FL | 2.0 | 1.0 | 629 | $1,400 | $2.23 | 13d | 1 | 1.01mi |
| 606 Cross St Tarpon Springs, FL | 1.0 | 1.0 | 551 | $1,450 | $2.63 | 3d | 1 | 1.18mi |
| 825 Cypress St Tarpon Springs, FL | 1.0–2.0 | 1.0 | 750 | $1,284 | $1.71 | 0d | 6 | 1.36mi |
HOA detail condo
- Monthly dues
- $460 · $5,520/yr
- Assessments
- None detected in remarks — confirm with the listing agent.
Listing history 13 events
-
2026-06-02statusdays on market $89,900 Pending 7 DOM
-
2026-06-01days on market $89,900 Active 6 DOM
-
2026-05-31days on market $89,900 Active 5 DOM
-
2026-05-26$89,900 Active
-
2019-03-01soldstatus $70,000
-
2019-02-28soldstatus $70,000 Sold 56-char remark
Show marketing remark (56 chars)
Remodeled 1 Bedroom, 1 Bathroom ground floor unit condo.
-
2019-02-18$74,500 56-char remark
Show marketing remark (56 chars)
Remodeled 1 Bedroom, 1 Bathroom ground floor unit condo.
-
2019-02-18historical 56-char remark
Show marketing remark (56 chars)
Remodeled 1 Bedroom, 1 Bathroom ground floor unit condo.
-
2016-02-02soldstatus $45,500
-
2000-06-30soldstatus $37,000
-
1991-04-02soldstatus $31,500
-
1990-06-13soldstatus $31,500
-
1987-10-22soldstatus $30,600
ⓘ Source: listings_history table (triggers on properties + properties_extension) + one-shot
backfill from property_details.listing_events for pre-trigger history.
Tax reassessment forecast FL · Resets to sale price
- Current annual tax
- $544 · $45/mo
- Projected year-2 tax
- $746 · $62/mo
- Expected delta
- +$202/yr (+$17/mo · 37.1%)
ⓘ Screening estimate from a state-policy table — verify with the county assessor before closing.
Nearby sold comps map
Loading sold comps map…
Walkable amenities ~0.75 mi
Loading nearby amenities…
Taxation est. · year 1
- Rental income
- $17,186
- − Mortgage interest
- −$5,036
- − Property taxes
- −$544
- − Insurance
- −$450
- − Repairs & maintenance
- −$1,375
- − Management
- −$1,375
- − HOA
- −$5,520
- − Depreciation
- −$2,615
- Taxable income
- $271
- Est. tax owed @ 24.0%
- −$65
- After-tax cash flow
- $1,341/yr
For passive investors: Depreciation is non-cash, so a rental often shows a tax loss while cash-flowing — sheltering income. Rental losses are passive: they offset passive income freely, and up to $25,000/yr can offset ordinary (W-2) income if you actively participate and your MAGI is under $100k (phasing out to $0 by $150k); unused losses carry forward. On sale, claimed depreciation is recaptured at up to 25%, and gains may owe capital-gains tax (a 1031 exchange can defer both). Figures are a year-1 estimate at your 24.0% rate — not tax advice; consult a CPA.
Schools (NCES district)
- District
- Pinellas
- NCES district ID
- 1201560
- Math proficiency
- 51% ▼ -5.00%
- Reading proficiency
- 51% ▼ -3.00%
- Median HH income
- $46,270
- Composite
- 43.27/100
- National rank
- #3046
- State rank
- #31 of 73 in FL
Livability — Tarpon Springs
- Score
- 68/100
- State rank
- #502
- US rank
- #9244
Category grades
Schools grade is shown separately in the Schools card above.
Census & demographics
- Census place
- Tarpon Springs, FL
- County
- Pinellas County · 939,478 people
- City population
- 27,324
- Metro
- Tampa-St. Petersburg-Clearwater, FL
- Population (ZIP)
- 27,324
- Household income
- $74,854
- Rent vs Own
- Severe rent burden
- 721.0
Population outlook (Pinellas County) Hauer SSP2
- Today (2025)
- 1,027,532 people
- By 2030
- 1,063,586 · +3.5%
- By 2040
- 1,125,020 · +9.5%
- By 2050
- 1,168,637 · +13.7%
- By 2075
- 1,265,188 · +23.1%
- By 2100
- 1,260,357 · +22.7%
Race, ethnicity, and origin ACS 2023
- Neighborhood character
- Predominantly White (80%)
- Race & ethnicity
- White 80% Hispanic / Latino 10% Two or more races 7% Black 6%
- Hispanic origin (detail)
- Mexican 2% Puerto Rican 4%
- Common ancestry
- Romanian 6% Lithuanian 3% Slovak 2%
- Foreign-born
- 10% · Canada, Jamaica, Dominican Republic
- Languages at home
- 84% English-only · Other Indo-European 6% Spanish 6% French/Haitian/Cajun 1%
Political lean MEDSL · Pinellas
- 2024 margin
- Lean R (+5.2) · D 46.9% · R 52.1%
- 2008→2024 swing
- -13.5pp toward R · 2008: 8.3pp · 2024: -5.2pp
- All cycles
- 2024: R+5.2 2020: D+0.2 2016: R+1.1 2012: D+5.6 2008: D+8.3
Not yet ingested
- Civics
- —
Market trends
- HPI YoY
- ▼ -300.96%
- Current HPI
- 303.7434
- Rent YoY
- ▼ -1.16%
- Metro
- Tampa-St. Petersburg-Clearwater, FL
- State GDP YoY
- ▲ 3.28%
- F500 in state
- 36
Industry mix (Fortune 500 HQ in FL)
| Industry | F500 HQs | Revenue |
|---|---|---|
| Industrial Technology | 2 | $29B |
|
||
| Insurance | 2 | $17B |
|
||
| Retail | 1 | $60B |
|
||
| Technology Distribution | 1 | $58B |
|
||
| Homebuilding | 1 | $35B |
|
||
| Technology Manufacturing | 1 | $35B |
|
||
Price history
+193.8% since first listed10 events — show timeline
- 2026-05-26 Listed $89,900 Stellar MLS as Distributed by MLS Grid
- 2019-03-01 Sold (Public Records) $70,000 Public Records
- 2019-02-28 Sold (MLS) $70,000 Stellar MLS as Distributed by MLS Grid
- 2019-02-18 Listing Removed — Stellar MLS as Distributed by MLS Grid
- 2019-02-18 Listed $74,500 Stellar MLS as Distributed by MLS Grid
- 2016-02-02 Sold (Public Records) $45,500 Public Records
- 2000-06-30 Sold (Public Records) $37,000 Public Records
- 1991-04-02 Sold (Public Records) $31,500 Public Records
- 1990-06-13 Sold (Public Records) $31,500 Public Records
- 1987-10-22 Sold (Public Records) $30,600 Public Records
Property tax history
-1.5%/yrLatest (2025): $544 · +5.0% YoY. Source: county tax records.
Cash-flow waterfall
monthlySold comps — $/sqft
last 12 mo · ≤1 miLoading sold comps…