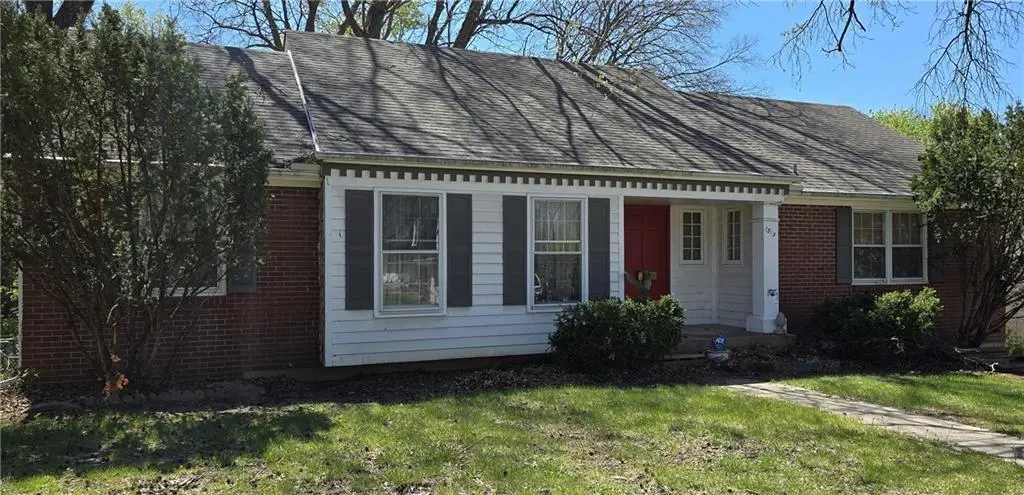
1313 E 98th Ter · Kansas City, MO
Flood risk 1/10 · Minimal
- FEMA flood zone
- X (unshaded)
- Chance of flooding over 30 yrs
- 0.0%
- Est. flood insurance / yr
- $473 – $860
Fire risk 1/10 · Minimal
- Est. fire insurance / yr
- $1,054 – $1,958
Heat risk 4/10 · Minor
- Hot days now (above 107°F)
- 7 days/yr
- Hot days in 30 yrs
- 17 days/yr
Wind risk 2/10 · Minimal
- Chance of severe wind over 30 yrs
- —
Air-quality risk 3/10 · Minor
- Unhealthy air days now
- 3 days/yr
- Unhealthy air days in 30 yrs
- 3 days/yr
Risk factors via First Street. Map © Google.
Why this score? — see what drove the D grade
The composite is a weighted blend of 9 inputs, each scored 0–100. Each bar is that input's sub-score; the figure is the points it added to the 100-point composite (weight × sub-score).
- ARV discount +15.0/15.0
- Cash flow +9.1/30.0
- Livability +3.9/5.0
- Rent growth +3.5/5.0
- 1% rule +2.6/10.0
- DSCR +2.5/10.0
- Condition / age +2.5/5.0
- Schools +1.8/10.0
- Appreciation +0.0/10.0
$225,000
🖨 Deal sheet 📄 Offer letter ✓ Due diligence
Listing remarks MLS
Experience peace of mind in this classic 3-bedroom, 2-bathroom ranch located in the quiet, tree-lined streets of Linden Hill. While the home is a blank canvas ready for your cosmetic "vision, " all the major mechanicals are brand new! Enjoy a new HVAC system, furnace, and hot water heater (all replaced in 2024), plus a young roof from 2017. The interior features a functional layout with two bathrooms that have already been updated for a modern feel. Nestled in a community known for its active volunteer-led HOA, you'll be just minutes from local favorites like Second Best Coffee and the scenic trails at Alex George Park. This is the perfect foundation for a buyer looking to build equity through simple cosmetic updates.
Key facts
- 9,561 sq ft lot
- 2 garage spots
- Built 1965
Neighborhood map
What this means for you Summary
Snapshot
- This is a 3-bed/2.0-bath single-family listed at $225k.
Deal economics
- At list price, monthly cash flow is $-172 ($-2k/yr) — negative.
- To cash-flow at today's rent, offer at most $195k (13.5% below list).
- To meet the 1% rule (rent ≥ 1% of price), the offer needs to be $171k (24.0% below list).
- Recommended offer: $171k (24.0% below list) — sets the bar for 1% rule.
- Cap rate 5.4% vs local median 3.9% in Kansas City — top-decile yield for the area; either an underpriced asset or a hidden risk that comps aren't pricing in. Stress-test before assuming the spread holds.
Location & tenants
- Location reads 78/100 on livability (#28 in MO, #2,671 nationally) — a middle-class / working-renter tenant base. Strengths: amenities A+, commute A+, cost of living A+; Watch: schools C-, crime F.
- Center 58 (urban): math 12% / reading 29% proficiency, ranked #301 of 324 in MO (top 93%) — low school quality limits family demand, transient renter base, plan for 1-2y turnover; 63% free/reduced lunch — lower-income household profile, screen leases tightly.
- Market conditions: Rents rising (+4.0%/yr); 131 active listings in the ZIP; 9 comparable units currently listed for rent nearby; rentals leasing fast (median 4d on market — plan ~1-2 weeks tenant-placement turnaround); 4,002 units permitted in Jackson County in 2024 (2,271 in 5+ unit buildings).
- This rent runs 32% of the median local income ($64k/yr) — at the standard rent-burdened threshold; future hikes will face affordability resistance.
Forward outlook
- Local home prices are declining (-3.0%/yr); year-one equity from $2k of loan paydown is wiped out by about $7k of value loss. Plan a longer hold.
- Jackson County population projected at +4% by 2050 — modest demand growth; plan on rents tracking national, not racing it.
Negotiation context
- Only 2 days on market — expect competitive offers; lowballing is unlikely to land.
Questions for the listing agent
- What do current leases actually rent for vs. the listed asking? Can we see a recent rent roll and the last 12 months of T-12 income?
- Built in 1965 — when were the roof, HVAC, electrical panel, plumbing, and water heater last replaced?
- What does the HOA fee cover, when was the last increase, and are there any pending special assessments or reserve-fund shortfalls?
- Is there a deadline driving the sale (1031 exchange, divorce, estate, relocation)? That informs how much negotiation room exists.
- Crime grade is F in this area — have there been break-ins, vandalism, or insurance claims at this property in the last 3 years? What carrier currently insures it and at what premium?
- The area grade is low — what's the realistic commute time and amenity access for the typical tenant pool here? Any planned neighborhood developments (good or bad) we should know about?
- What's the average days-on-market for RENTAL listings here right now (not sales)? A rising rental-DOM trend means longer vacancies and softer asking-rent achievability than the comps imply.
- What's the recent tenant-quality profile in this submarket — average credit score on applications, eviction rate, late-payment / NSF rate, and stable-employment percentage? A property-management company in the area should have these aggregated.
- How much new for-sale + rental construction is in the pipeline within 1–3 miles? Heavy new supply typically softens prices + rents 12–24 months out; constrained supply supports both.
Investment metrics
- 1% rule
- 0.76% ✗
- Cap rate
- 5.38%
- Cash-on-cash
- -3.27%
- DSCR
- 0.85
- GRM
- 11.0
CMA / ARV
- ARV (median comp)
- $285,085
- List price
- $225,000
- Delta
- -21.08%
- Verdict
- UNDERPRICED
- Comps
- 20 within 1.0 mi
Show comp detail 12 sales within ~0.75 mi
| Address | Dist | Beds/Ba | Sqft | Sold | Price | $/sf | Match |
|---|---|---|---|---|---|---|---|
| 1313 E 98th Ter | 0.00mi | 3/2.0 | 1,752 (0%) | 1mo | $225,000 | $128 | 100 |
| 1222 Queens Pl | 0.07mi | 3/2.5 | 1,731 (-1%) | 7mo | $315,000 | $182 | 87 |
| 9919 Harrison St | 0.20mi | 3/2.0 | 1,746 (-0%) | 13mo | $240,000 | $137 | 79 |
| 9901 Wayne Ave | 0.19mi | 3/2.0 | 1,554 (-11%) | 0mo | $335,000 | $216 | 72 |
| 9905 Campbell St | 0.20mi | 3/1.5 | 1,920 (+10%) | 2mo | $243,500 | $127 | 71 |
| 505 E 97th St | 0.75mi | 3/1.0 | 1,713 (-2%) | 1mo | $250,000 | $146 | 57 |
| 10218 Tracy St | 0.54mi | 3/2.0 | 1,884 (+8%) | 7mo | $295,000 | $157 | 56 |
| 1305 E 101st St | 0.34mi | 3/2.5 | 1,920 (+10%) | 12mo | $309,000 | $161 | 56 |
| 708 E 97th St | 0.41mi | 3/1.5 | 1,903 (+9%) | 10mo | $250,000 | $131 | 56 |
| 10205 Tracy Ave | 0.49mi | 3/2.0 | 1,528 (-13%) | 2mo | $305,000 | $200 | 54 |
| 9734 Shepherds Dr | 0.35mi | 3/3.5 | 1,890 (+8%) | 13mo | $300,000 | $159 | 54 |
| 9725 Locust Ln | 0.74mi | 2/1.5 (-1) | 1,793 (+2%) | 6mo | $235,000 | $131 | 50 |
Match score weights: distance 35% · size 25% · config 20% · recency 20%. Top-matched comps best support the ARV.
Projected returns pro-forma
-3.0% appreciation · 3.97% rent growth · sell at horizon
- IRR
- -20.7%
- Equity multiple
- 0.27×
- Total profit
- $-45,704
- Equity at exit
- $33,548
- IRR
- -12.0%
- Equity multiple
- 0.26×
- Total profit
- $-46,803
- Equity at exit
- $19,454
Cash invested: $63,000 (down + closing). Projections, not guarantees.
Landlord ↔ Tenant lean methodology
- Overall (STATE)
- 81 Strongly Landlord-Friendly
- State Missouri
- 81 Strongly Landlord-Friendly · R+10
- County
- — inherits STATE
- City
- — inherits STATE
ZIP-level market 64131
- Rents YoY
- 4.0%
- Active inventory
- 131
- Price-to-rent
- 11.0×
Monthly cashflow live
- Estimated rent
- $1,710 high interval (Pro) →
- Mortgage (P&I)
- −$1,180
- Tax from tax record
- −$243 /mo · $2,915/yr
- Insurance
- −$94
- HOA
- −$6
- Vacancy / Maint / Mgmt
- −$359
- Net cashflow
- $-172
Break-even live
UW: 25.0% down · 7.5% · 30yr · 1.5% tax · 5.0% vac · 8.0% maint · 8.0% mgmt
Financing live
Cash to close
- Down payment
- $56,250
- Closing costs
- $6,750
- Reserves months
- —
- Total cash needed
- —
Loan-product check · same deal, 3 products live
Conventional
25% down · 7.5% · 30yr
- Down + closing
- —
- Monthly P&I
- —
- Monthly cashflow
- —
- DSCR
- —
- Eligible?
- —
Personal DTI + credit; lowest rate.
DSCR
20% down · 8.5% · 30yr
- Down + closing
- —
- Monthly P&I
- —
- Monthly cashflow
- —
- DSCR
- —
- Eligible?
- —
No personal income docs; deal must DSCR.
Hard money
10% down · 12.0% · 12mo
- Down + closing
- —
- Monthly P&I
- —
- Monthly cashflow
- —
- DSCR
- —
- Eligible?
- —
Short-term bridge; refi at stabilization.
Rent comps 9 comps
| Address | Beds | Baths | Sqft | Rent | $/sqft | DOM | Units | Dist |
|---|---|---|---|---|---|---|---|---|
| 1415 E 97th St Kansas City, MO | 3.0 | 2.0 | 1350 | $1,695 | $1.26 | 2d | 1 | 0.22mi |
| 1520 E 97th St Kansas City, MO | 1.0–3.0 | 1.0–2.0 | 1163 | $1,595 | $1.37 | 2d | 7 | 0.25mi |
| 1617 E 97th St Kansas City, MO | 3.0 | 2.0 | 1350 | $1,695 | $1.26 | 2d | 1 | 0.31mi |
| 9702 Shepherds Dr Unit B Kansas City, MO | 3.0 | 2.0 | 1350 | $1,695 | $1.26 | 4d | 1 | 0.45mi |
| 9615 Holmes Rd Kansas City, MO | 4.0 | 2.0 | 1442 | $2,300 | $1.60 | 15d | 1 | 0.50mi |
| 408 E 92nd St Kansas City, MO | 3.0 | 1.0 | 1274 | $1,595 | $1.25 | 4d | 1 | 1.07mi |
| 201 W 99th Ter Kansas City, MO | 1.0–2.0 | 1.0–2.5 | 1262 | $1,962 | $1.55 | 2d | 52 | 1.08mi |
| 9108 Oak St Kansas City, MO | 3.0 | 2.0 | 1966 | $2,295 | $1.17 | 21d | 1 | 1.19mi |
| 9706 Wornall Rd Kansas City, MO | 2.0 | 2.5 | 1400 | $1,395 | $1.00 | 17d | 1 | 1.25mi |
HOA detail
- Monthly dues
- $6 · $72/yr
- Likely covers
- water
Listing history 4 events
-
2026-05-10status Pending 739-char remark
Show marketing remark (739 chars)
Experience peace of mind in this classic 3-bedroom, 2-bathroom ranch located in the quiet, tree-lined streets of Linden Hill. While the home is a blank canvas ready for your cosmetic "vision, " all the major mechanicals are brand new! Enjoy a new HVAC system, furnace, and hot water heater (all replaced in 2024), plus a young roof from 2017. The interior features a functional layout with two bathrooms that have already been updated for a modern feel. Nestled in a community known for its active volunteer-led HOA, you'll be just minutes from local favorites like Second Best Coffee and the scenic trails at Alex George Park. This is the perfect foundation for a buyer looking to build equity through simple cosmetic updates.
-
2026-05-08$225,000 Active 739-char remark
Show marketing remark (739 chars)
Experience peace of mind in this classic 3-bedroom, 2-bathroom ranch located in the quiet, tree-lined streets of Linden Hill. While the home is a blank canvas ready for your cosmetic "vision, " all the major mechanicals are brand new! Enjoy a new HVAC system, furnace, and hot water heater (all replaced in 2024), plus a young roof from 2017. The interior features a functional layout with two bathrooms that have already been updated for a modern feel. Nestled in a community known for its active volunteer-led HOA, you'll be just minutes from local favorites like Second Best Coffee and the scenic trails at Alex George Park. This is the perfect foundation for a buyer looking to build equity through simple cosmetic updates.
-
2026-04-10historical $225,000 739-char remark
Show marketing remark (739 chars)
Experience peace of mind in this classic 3-bedroom, 2-bathroom ranch located in the quiet, tree-lined streets of Linden Hill. While the home is a blank canvas ready for your cosmetic "vision, " all the major mechanicals are brand new! Enjoy a new HVAC system, furnace, and hot water heater (all replaced in 2024), plus a young roof from 2017. The interior features a functional layout with two bathrooms that have already been updated for a modern feel. Nestled in a community known for its active volunteer-led HOA, you'll be just minutes from local favorites like Second Best Coffee and the scenic trails at Alex George Park. This is the perfect foundation for a buyer looking to build equity through simple cosmetic updates.
-
1988-12-02soldstatus
ⓘ Source: listings_history table (triggers on properties + properties_extension) + one-shot
backfill from property_details.listing_events for pre-trigger history.
Tax reassessment forecast MO · Resets to sale price
- Current annual tax
- $2,915 · $243/mo
- Projected year-2 tax
- $2,915 · $243/mo
- Expected delta
- $0/yr ($0/mo · 0.0%)
ⓘ Screening estimate from a state-policy table — verify with the county assessor before closing.
Climate risk First Street
- Flood 1/10 Low FEMA zone X (unshaded) · 0% chance over 30 yrs
- Wildfire 1/10 Low
- Heat 4/10 Moderate 7 d/yr ≥107°F today · 17 d/yr by 30 yrs out
- Wind 2/10 Low
- Air quality 3/10 Moderate 3 unhealthy d/yr today · 3 by 30 yrs out
Nearby sold comps map
Loading sold comps map…
Walkable amenities ~0.75 mi
Loading nearby amenities…
Taxation est. · year 1
- Rental income
- $20,520
- − Mortgage interest
- −$12,603
- − Property taxes
- −$2,915
- − Insurance
- −$1,125
- − Repairs & maintenance
- −$1,642
- − Management
- −$1,642
- − HOA
- −$72
- − Depreciation
- −$6,545
- Taxable loss
- −$6,024
- Est. tax savings @ 24.0%
- +$1,446
- After-tax cash flow
- $-615/yr
For passive investors: Depreciation is non-cash, so a rental often shows a tax loss while cash-flowing — sheltering income. Rental losses are passive: they offset passive income freely, and up to $25,000/yr can offset ordinary (W-2) income if you actively participate and your MAGI is under $100k (phasing out to $0 by $150k); unused losses carry forward. On sale, claimed depreciation is recaptured at up to 25%, and gains may owe capital-gains tax (a 1031 exchange can defer both). Figures are a year-1 estimate at your 24.0% rate — not tax advice; consult a CPA.
Schools (NCES district)
- District
- Center 58
- NCES district ID
- 2908250
- Math proficiency
- 12% ▼ -15.00%
- Reading proficiency
- 29% ▼ -6.00%
- Median HH income
- $43,544
- Composite
- 17.64/100
- National rank
- #9031
- State rank
- #301 of 324 in MO
Livability — Kansas City
- Score
- 78/100
- State rank
- #28
- US rank
- #2671
Category grades
Schools grade is shown separately in the Schools card above.
Census & demographics
- Census place
- Kansas City, MO
- County
- Jackson County · 687,798 people
- City population
- 439,467
- Metro
- Kansas City, MO-KS
- Population (ZIP)
- 21,942
- Household income
- $64,201
- Rent vs Own
- Severe rent burden
- 1249.0
Population outlook (Jackson County) Hauer SSP2
- Today (2025)
- 719,589 people
- By 2030
- 731,456 · +1.6%
- By 2040
- 746,689 · +3.8%
- By 2050
- 749,289 · +4.1%
- By 2075
- 736,227 · +2.3%
- By 2100
- 668,210 · -7.1%
Race, ethnicity, and origin ACS 2023
- Neighborhood character
- Diverse neighborhood (Simpson 0.61)
- Race & ethnicity
- White 48% Black 39% Hispanic / Latino 7% Two or more races 7% Asian 1%
- Hispanic origin (detail)
- Mexican 3%
- Common ancestry
- Italian 5% Slovak 1% Lithuanian 1%
- Foreign-born
- 5% · Canada, Vietnam
- Languages at home
- 93% English-only · Spanish 3% French/Haitian/Cajun 1%
Political lean MEDSL · Jackson
- 2024 margin
- D (+19.3) · D 58.9% · R 39.5% · Other 1.6%
- 2008→2024 swing
- -6.1pp toward R · 2008: 25.4pp · 2024: 19.3pp
- All cycles
- 2024: D+19.3 2020: D+22.0 2016: D+16.6 2012: D+19.0 2008: D+25.4
Not yet ingested
- Civics
- —
Market trends
- HPI YoY
- ▼ -253.25%
- Current HPI
- 340.8202
- Rent YoY
- ▲ 3.97%
- Metro
- Kansas City, MO-KS
- State GDP YoY
- ▲ 1.84%
- F500 in state
- 20
Industry mix (Fortune 500 HQ in MO)
| Industry | F500 HQs | Revenue |
|---|---|---|
| Healthcare | 1 | $163B |
|
||
| Insurance | 1 | $21B |
|
||
| Industrial Technology | 1 | $17B |
|
||
| Retail | 1 | $16B |
|
||
| Industrial Distribution | 1 | $10B |
|
||
| Utilities | 1 | $9B |
|
||
Price history
+0.0% since first listed4 events — show timeline
- 2026-05-10 Pending — Heartland MLS as Distributed by MLS Grid
- 2026-05-08 Listed $225,000 Heartland MLS as Distributed by MLS Grid
- 2026-04-10 Coming Soon $225,000 Heartland MLS as Distributed by MLS Grid
- 1988-12-02 Sold (Public Records) — Public Records
Property tax history
+0.6%/yrLatest (2025): $2,915 · -6.1% YoY. Source: county tax records.
Cash-flow waterfall
monthlySold comps — $/sqft
last 12 mo · ≤1 miLoading sold comps…