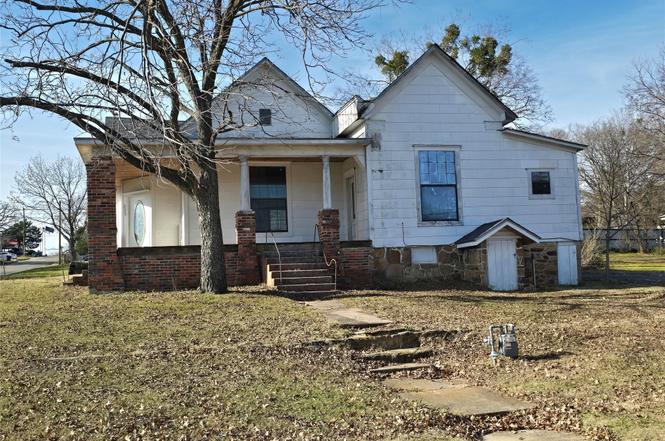
233 W 3rd · Atoka, OK
Flood risk 1/10 · Minimal
- FEMA flood zone
- X
- Chance of flooding over 30 yrs
- 0.0%
- Est. flood insurance / yr
- $507 – $1,088
Fire risk 5/10 · Moderate
- Est. fire insurance / yr
- $2,463 – $4,575
Heat risk 7/10 · Major
- Hot days now (above 113°F)
- 7 days/yr
- Hot days in 30 yrs
- 20 days/yr
Wind risk 4/10 · Minor
- Chance of severe wind over 30 yrs
- 11.0%
Air-quality risk 2/10 · Minimal
- Unhealthy air days now
- 0 days/yr
- Unhealthy air days in 30 yrs
- 1 days/yr
Risk factors via First Street. Map © Google.
Why this score? — see what drove the B+ grade
The composite is a weighted blend of 9 inputs, each scored 0–100. Each bar is that input's sub-score; the figure is the points it added to the 100-point composite (weight × sub-score).
- Cash flow +30.0/30.0
- ARV discount +15.0/15.0
- DSCR +10.0/10.0
- 1% rule +8.3/10.0
- Appreciation +6.2/10.0
- Rent growth +2.5/5.0
- Condition / age +2.5/5.0
- Livability +2.3/5.0
- Schools +1.9/10.0
$85,000
🖨 Deal sheet 📄 Offer letter ✓ Due diligence
Listing remarks
Charming Home in the Heart of Atoka Welcome to 233 W 3rd Street in Atoka, Oklahoma — a warm and inviting property located just moments from downtown. This home offers the perfect blend of small-town charm and everyday convenience, making it ideal for anyone seeking comfort, simplicity, and community. Situated in a quiet neighborhood, this property provides easy access to local shops, dining, schools, and the historic districts that make Atoka such a special place to live. Whether you're looking for your first home, an investment opportunity, or a peaceful place to settle, this location offers wonderful potential. There is a pecan tree in the front yard and the bricks that make up t
Key facts
- Spacious yard
- Flexible layout
- Quiet neighborhood
Tags
Property features AI
Exterior
- Security: No safety shelter
- Utilities: Public water; Public sewer
- Home design: Single-story; Faces east
- Exterior features: Enclosed porch; Porch
Interior
- Bathrooms: 1 full bathroom
- Heating & cooling: Electric heating
- Interior features: High ceilings; Other interior features
Neighborhood map
What this means for you Summary
Snapshot
- This is a 3-bed/1.0-bath single-family listed at $85k.
Deal economics
- At list price, monthly cash flow is $395 ($5k/yr) — positive.
- The deal already cash-flows at list — no discount required.
- Meets the 1% rule at list price ($1k rent vs $85k).
- Recommended offer: $75k (12.0% below list) — sets the bar for market timing.
Location & tenants
- Location reads 46/100 on livability (#698 in OK) — a working-class tenant base; expect higher turnover. Strengths: cost of living A+, housing A+; Watch: schools F, crime F, amenities F.
- Atoka (rural): math 19% / reading 27% proficiency, ranked #154 of 270 in OK (top 57%) — low school quality limits family demand, transient renter base, plan for 1-2y turnover; 67% free/reduced lunch — lower-income household profile, screen leases tightly.
- Market conditions: 57 active listings in the ZIP.
Forward outlook
- In year one you build about $3k of equity ($588 loan paydown + $2k appreciation (2.4% local appreciation)).
- Atoka County population projected at -18% by 2050 — secular population decline; favor cash flow + early exit over multi-decade hold.
- At projected returns (2.4% appreciation + 3.0% rent growth), your $24k cash investment doubles in ~4 years — after that, you're playing with house money.
Negotiation context
- It's been on market 189 days — a 12% lower offer ($75k) is reasonable based on typical stale-listing flexibility.
Risks & watch-outs
- Watch-outs: built in 1910 — expect roof / HVAC / electrical / plumbing capex.
- Climate carrying-cost: moderate wildfire risk; extreme-heat days projected 7→20/yr by 2055 (HVAC capex compounding) — expect insurance premiums to compound above CPI over the hold.
Questions for the listing agent
- It's been on market 189 days. Have you received any prior offers? Is the seller open to a 12% concession, seller financing, or rate buy-down credit?
- Built in 1910 — when were the roof, HVAC, electrical panel, plumbing, and water heater last replaced?
- Why hasn't it sold? Are there any deal-killer items the seller is aware of (foundation, flood, title, zoning, code violations)?
- Is there a deadline driving the sale (1031 exchange, divorce, estate, relocation)? That informs how much negotiation room exists.
- Schools are F-rated, which usually means shorter tenancies and higher turnover. Who's the typical renter profile here, and what's been the actual vacancy rate?
- Crime grade is F in this area — have there been break-ins, vandalism, or insurance claims at this property in the last 3 years? What carrier currently insures it and at what premium?
- What's the average days-on-market for RENTAL listings here right now (not sales)? A rising rental-DOM trend means longer vacancies and softer asking-rent achievability than the comps imply.
- What's the recent tenant-quality profile in this submarket — average credit score on applications, eviction rate, late-payment / NSF rate, and stable-employment percentage? A property-management company in the area should have these aggregated.
- How much new for-sale + rental construction is in the pipeline within 1–3 miles? Heavy new supply typically softens prices + rents 12–24 months out; constrained supply supports both.
Investment metrics
- 1% rule
- 1.33% ✓
- Cap rate
- 11.87%
- Cash-on-cash
- 19.93%
- DSCR
- 1.89
- GRM
- 6.2
CMA / ARV
- ARV (on-the-fly)
- $166,074
- Comps found
- 4
Show comp detail 4 sales within ~0.75 mi
| Address | Dist | Beds/Ba | Sqft | Sold | Price | $/sf | Match |
|---|---|---|---|---|---|---|---|
| 170 E 2nd | 0.23mi | 3/2.0 | 2,052 (+10%) | 13mo | $166,500 | $81 | 58 |
| 687 W 6th | 0.47mi | 3/2.0 | 1,929 (+3%) | 13mo | $283,000 | $147 | 58 |
| 377 W 1st | 0.18mi | 4/2.5 (+1) | 2,139 (+15%) | 12mo | $189,900 | $89 | 46 |
| 348 W Maple Ln | 0.59mi | 3/2.0 | 1,642 (-12%) | 4mo | $135,000 | $82 | 45 |
Match score weights: distance 35% · size 25% · config 20% · recency 20%. Top-matched comps best support the ARV.
Projected returns pro-forma
2.43% appreciation · 3.0% rent growth · sell at horizon
- IRR
- 25.0%
- Equity multiple
- 2.38×
- Total profit
- $32,826
- Equity at exit
- $35,509
- IRR
- 26.3%
- Equity multiple
- 4.56×
- Total profit
- $84,791
- Equity at exit
- $52,703
Cash invested: $23,800 (down + closing). Projections, not guarantees.
Landlord ↔ Tenant lean methodology
- Overall (STATE)
- 83 Strongly Landlord-Friendly
- State Oklahoma
- 83 Strongly Landlord-Friendly · R+20
- County
- — inherits STATE
- City
- — inherits STATE
ZIP-level market 74525
- Home prices YoY
- 1.1%
- Active inventory
- 57
- Price-to-rent
- 6.2×
Monthly cashflow live
- Estimated rent
- $1,135 medium interval (Pro) →
- Mortgage (P&I)
- −$446
- Tax from tax record
- −$20 /mo · $240/yr
- Insurance
- −$35
- HOA
- −$0
- Vacancy / Maint / Mgmt
- −$238
- Net cashflow
- $395
Break-even live
UW: 25.0% down · 7.5% · 30yr · 1.5% tax · 5.0% vac · 8.0% maint · 8.0% mgmt
Financing live
Cash to close
- Down payment
- $21,250
- Closing costs
- $2,550
- Reserves months
- —
- Total cash needed
- —
Loan-product check · same deal, 3 products live
Conventional
25% down · 7.5% · 30yr
- Down + closing
- —
- Monthly P&I
- —
- Monthly cashflow
- —
- DSCR
- —
- Eligible?
- —
Personal DTI + credit; lowest rate.
DSCR
20% down · 8.5% · 30yr
- Down + closing
- —
- Monthly P&I
- —
- Monthly cashflow
- —
- DSCR
- —
- Eligible?
- —
No personal income docs; deal must DSCR.
Hard money
10% down · 12.0% · 12mo
- Down + closing
- —
- Monthly P&I
- —
- Monthly cashflow
- —
- DSCR
- —
- Eligible?
- —
Short-term bridge; refi at stabilization.
Listing history 15 events
-
2026-06-18days on market $85,000 Active 189 DOM
-
2026-06-17days on market $85,000 Active 188 DOM
-
2026-06-16days on market $85,000 Active 187 DOM
-
2026-06-15days on market $85,000 Active 186 DOM
-
2026-06-13days on market $85,000 Active 184 DOM
-
2026-06-12days on market $85,000 Active 183 DOM
-
2026-06-09days on market $85,000 Active 180 DOM
-
2026-06-08days on market $85,000 Active 179 DOM
-
2026-06-08days on market $85,000 Active 178 DOM
-
2026-06-05days on market $85,000 Active 176 DOM
-
2026-06-04days on market $85,000 Active 174 DOM
-
2026-06-02days on market $85,000 Active 173 DOM
-
2026-06-01days on market $85,000 Active 172 DOM
-
2026-05-31days on market $85,000 Active 171 DOM
-
2025-12-10$85,000 Active
ⓘ Source: listings_history table (triggers on properties + properties_extension) + one-shot
backfill from property_details.listing_events for pre-trigger history.
Tax reassessment forecast OK · Resets to sale price
- Current annual tax
- $240 · $20/mo
- Projected year-2 tax
- $765 · $64/mo
- Expected delta
- +$525/yr (+$44/mo · 218.7%)
ⓘ Screening estimate from a state-policy table — verify with the county assessor before closing.
Climate risk First Street
- Flood 1/10 Low FEMA zone X · 0% chance over 30 yrs
- Wildfire 5/10 Major
- Heat 7/10 Severe 7 d/yr ≥113°F today · 20 d/yr by 30 yrs out
- Wind 4/10 Moderate 11% chance of damaging wind over 30 yrs
- Air quality 2/10 Low 0 unhealthy d/yr today · 1 by 30 yrs out
Nearby sold comps map
Loading sold comps map…
Walkable amenities ~0.75 mi
Loading nearby amenities…
Taxation est. · year 1
- Rental income
- $13,616
- − Mortgage interest
- −$4,761
- − Property taxes
- −$240
- − Insurance
- −$425
- − Repairs & maintenance
- −$1,089
- − Management
- −$1,089
- − Depreciation
- −$2,473
- Taxable income
- $3,538
- Est. tax owed @ 24.0%
- −$849
- After-tax cash flow
- $3,893/yr
For passive investors: Depreciation is non-cash, so a rental often shows a tax loss while cash-flowing — sheltering income. Rental losses are passive: they offset passive income freely, and up to $25,000/yr can offset ordinary (W-2) income if you actively participate and your MAGI is under $100k (phasing out to $0 by $150k); unused losses carry forward. On sale, claimed depreciation is recaptured at up to 25%, and gains may owe capital-gains tax (a 1031 exchange can defer both). Figures are a year-1 estimate at your 24.0% rate — not tax advice; consult a CPA.
Schools (NCES district)
- District
- Atoka
- NCES district ID
- 4003360
- Math proficiency
- 19% ▼ -15.00%
- Reading proficiency
- 27% ▼ -8.00%
- Median HH income
- $31,534
- Composite
- 18.61/100
- National rank
- #8901
- State rank
- #154 of 270 in OK
Livability — Atoka
- Score
- 46/100
- State rank
- #698
- US rank
- #26475
Category grades
Schools grade is shown separately in the Schools card above.
Census & demographics
- Census place
- Atoka, OK
- Population (ZIP)
- 10,420
Population outlook (Atoka County) Hauer SSP2
- Today (2025)
- 13,004 people
- By 2030
- 12,522 · -3.7%
- By 2040
- 11,595 · -10.8%
- By 2050
- 10,709 · -17.6%
- By 2075
- 8,957 · -31.1%
- By 2100
- 7,452 · -42.7%
Race, ethnicity, and origin ACS 2023
- Neighborhood character
- Diverse neighborhood (Simpson 0.56)
- Race & ethnicity
- White 66% Two or more races 18% Native American 9% Hispanic / Latino 5% Black 4%
- Hispanic origin (detail)
- Mexican 4%
- Common ancestry
- Lithuanian 1% European 1% Slovak 1%
- Foreign-born
- 2% · Philippines, Canada
- Languages at home
- 95% English-only · Spanish 3% Other Asian/Pacific 1%
Political lean MEDSL · Atoka
- 2024 margin
- Solid R (+71.6) · D 13.8% · R 85.3%
- 2008→2024 swing
- -27.7pp toward R · 2008: -43.9pp · 2024: -71.6pp
- All cycles
- 2024: R+71.6 2020: R+70.4 2016: R+65.4 2012: R+48.0 2008: R+43.9
Not yet ingested
- Civics
- —
Market trends
- HPI YoY
- ▲ 2.43%
- Current HPI
- 213.5144
- Rent YoY
- —
- Metro
- —
- State GDP YoY
- ▲ 1.55%
- F500 in state
- 6
Industry mix (Fortune 500 HQ in OK)
| Industry | F500 HQs | Revenue |
|---|---|---|
| Energy | 3 | $48B |
|
||
Price history
1 event — show timeline
- 2025-12-10 Listed $85,000 MLS Technology, Inc.
Property tax history
-1.4%/yrLatest (2025): $240 · +4.8% YoY. Source: county tax records.
Cash-flow waterfall
monthlySold comps — $/sqft
last 12 mo · ≤1 miLoading sold comps…