 🏗️ New Construction
The Laurel J Plan · Athens, AL
Flood risk No data
- FEMA flood zone
- —
- Chance of flooding over 30 yrs
- —
- Est. flood insurance / yr
- —
Fire risk No data
- Est. fire insurance / yr
- —
Heat risk No data
- Hot days now (above threshold)
- —
- Hot days in 30 yrs
- —
Wind risk No data
- Chance of severe wind over 30 yrs
- —
Air-quality risk No data
- Unhealthy air days now
- —
- Unhealthy air days in 30 yrs
- —
Risk factors via First Street. Map © Google.
Why this score? — see what drove the F grade
The composite is a weighted blend of 9 inputs, each scored 0–100. Each bar is that input's sub-score; the figure is the points it added to the 100-point composite (weight × sub-score).
- ARV discount +7.5/15.0
- Cash flow +5.6/30.0
- Livability +3.8/5.0
- Schools +3.3/10.0
- Rent growth +2.5/5.0
- Condition / age +2.5/5.0
- 1% rule +1.2/10.0
- DSCR +0.0/10.0
- Appreciation +0.0/10.0
$274,900
🖨 Deal sheet (PDF) 📄 Offer letter ✓ Due diligence
Listing remarks MLS
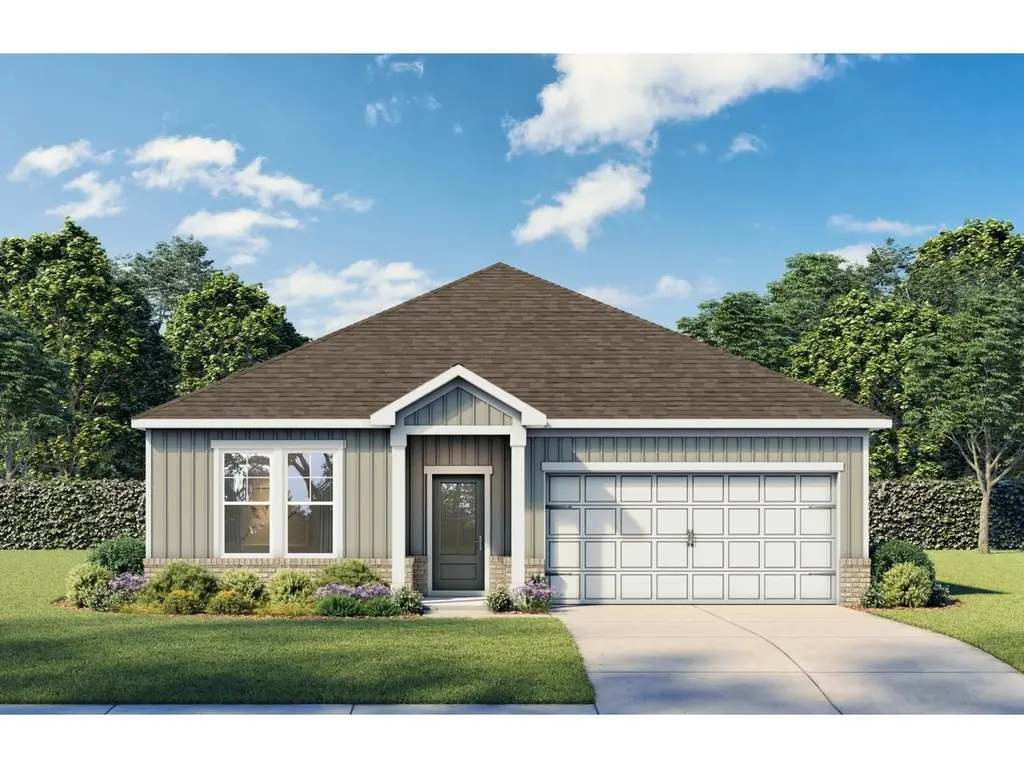
With its welcoming Hardie Board exterior and bright, open layout, The Laurel makes it easy to showcase your style. Sunlight fills the open-concept family room, creating an inviting space for entertaining or relaxing. The kitchen flows seamlessly into the living area and includes a charming breakfast nook and a spacious walk-in pantry, giving you both convenience and character. This thoughtfully designed plan offers three bedrooms, two full baths, and a dedicated study, providing the flexibility modern families need. The Primary Suite offers generous space to unwind, featuring a well-appointed bath with thoughtful finishes and a large walk-in closet. Personalize The Laurel with a variety of structural options, including a 4-bedroom / 3-bath configuration, three-car garage, side-entry garage, gourmet kitchen, two fireplace options, and an extended covered patio for even more outdoor living. As always, available features and upgrades vary by community. Our community NHC can walk you through the standard offerings and options for your neighborhood. * Attached photos may include upgrades and non-standard features.
Key facts
- Breakfast nook
- Well-appointed bath
- Walk-in pantry
Tags
Neighborhood map
What this means for you Summary
Snapshot
- This is a 3-bed/2.0-bath single-family listed at $275k.
Deal economics
- At list price, monthly cash flow is $-741 ($-9k/yr) — negative.
- To cash-flow at today's rent, offer at most $247k (10.3% below list).
- To meet the 1% rule (rent ≥ 1% of price), the offer needs to be $219k (20.4% below list).
- Recommended offer: $219k (20.4% below list) — sets the bar for 1% rule.
Location & tenants
- Location reads 75/100 on livability (#18 in AL, #4,019 nationally) — a middle-class / working-renter tenant base. Strengths: cost of living A+, housing A+, health & safety A+; Watch: employment C-, commute F.
- Athens City (town): math 27% / reading 51% proficiency, ranked #29 of 129 in AL (top 22%) — families likely to look elsewhere, expect single-tenant / working-renter base with shorter leases.
- Zoned schools: Brookhill Elementary School (math 44% / reading 64%, grade C, #87 of 627 statewide, top 15%, 366 students, 39% FRL); Athens Middle School (math 15% / reading 45%, grade F, #121 of 257 statewide, top 50%, 958 students, 59% FRL); Athens High School (math 29% / reading 38%, grade F, #56 of 305 statewide, top 18%, 1,173 students, 51% FRL) — zoned schools at 50% FRL track the district average.
- Market conditions: 821 active listings in the ZIP; 2 comparable units currently listed for rent nearby; solid renter incomes; 494 units permitted in Limestone County in 2024 (0 in 5+ unit buildings).
Forward outlook
- Local home prices are declining (-3.0%/yr); year-one equity from $2k of loan paydown is wiped out by about $11k of value loss. Plan a longer hold.
- Limestone County population projected at +43% by 2050 — long-run rental-demand tailwind backs the buy-and-hold thesis.
Negotiation context
- It's been on market 93 days — a 9% lower offer ($250k) is reasonable based on typical stale-listing flexibility.
Questions for the listing agent
- What do current leases actually rent for vs. the listed asking? Can we see a recent rent roll and the last 12 months of T-12 income?
- It's been on market 93 days. Have you received any prior offers? Is the seller open to a 20% concession, seller financing, or rate buy-down credit?
- What does the HOA fee cover, when was the last increase, and are there any pending special assessments or reserve-fund shortfalls?
- Why hasn't it sold? Are there any deal-killer items the seller is aware of (foundation, flood, title, zoning, code violations)?
- Is there a deadline driving the sale (1031 exchange, divorce, estate, relocation)? That informs how much negotiation room exists.
- The area grade is low — what's the realistic commute time and amenity access for the typical tenant pool here? Any planned neighborhood developments (good or bad) we should know about?
- What's the average days-on-market for RENTAL listings here right now (not sales)? A rising rental-DOM trend means longer vacancies and softer asking-rent achievability than the comps imply.
- What's the recent tenant-quality profile in this submarket — average credit score on applications, eviction rate, late-payment / NSF rate, and stable-employment percentage? A property-management company in the area should have these aggregated.
- How much new for-sale + rental construction is in the pipeline within 1–3 miles? Heavy new supply typically softens prices + rents 12–24 months out; constrained supply supports both.
Investment metrics
- 1% rule
- 0.62% ✗
- Cap rate
- 3.78%
- Cash-on-cash
- -8.98%
- DSCR
- 0.60
- GRM
- 13.5
CMA / ARV
- ARV (median comp)
- $353,784
- List price
- $274,900
- Delta
- -22.30%
- Verdict
- UNDERPRICED
- Comps
- 20 within 1.0 mi
Show comp detail 12 sales within ~0.75 mi
| Address | Dist | Beds/Ba | Sqft | Sold | Price | $/sf | Match |
|---|---|---|---|---|---|---|---|
| 12537 Dale Rd | 0.11mi | 4/2.0 (+1) | 1,895 (-3%) | 3mo | $290,265 | $153 | 83 |
| 12626 Dale Rd | 0.03mi | 4/2.0 (+1) | 1,866 (-4%) | 14mo | $348,090 | $187 | 75 |
| 12526 Dale Rd | 0.11mi | 4/2.0 (+1) | 2,005 (+3%) | 14mo | $340,500 | $170 | 74 |
| 12579 Buck Rd | 0.14mi | 4/2.0 (+1) | 2,005 (+3%) | 13mo | $338,150 | $169 | 73 |
| 12525 Dale Rd | 0.12mi | 4/2.0 (+1) | 1,866 (-4%) | 15mo | $295,000 | $158 | 70 |
| 12644 Buck Rd | 0.10mi | 4/2.0 (+1) | 2,005 (+3%) | 22mo | $361,679 | $180 | 68 |
| 12605 Buck Rd | 0.14mi | 3/2.0 | 1,746 (-10%) | 11mo | $299,900 | $172 | 67 |
| 12512 Dale Rd | 0.11mi | 4/2.0 (+1) | 1,866 (-4%) | 20mo | $342,985 | $184 | 66 |
| 12516 Buck Rd | 0.15mi | 4/2.0 (+1) | 1,866 (-4%) | 21mo | $355,529 | $191 | 64 |
| 12530 Buck Rd | 0.14mi | 3/2.0 | 1,746 (-10%) | 16mo | $300,000 | $172 | 63 |
| 12553 Buck Rd | 0.15mi | 4/2.5 (+1) | 2,155 (+11%) | 12mo | $340,000 | $158 | 58 |
| 2142 Lindsay Ln S | 0.48mi | 4/2.0 (+1) | 1,981 (+2%) | 20mo | $315,000 | $159 | 53 |
Match score weights: distance 35% · size 25% · config 20% · recency 20%. Top-matched comps best support the ARV.
Projected returns pro-forma
-3.0% appreciation · 3.0% rent growth · sell at horizon
- IRR
- -32.2%
- Equity multiple
- -0.05×
- Total profit
- $-104,473
- Equity at exit
- $52,750
- IRR
- -37.2%
- Equity multiple
- -0.53×
- Total profit
- $-151,545
- Equity at exit
- $30,589
Cash invested: $99,059 (down + closing). Projections, not guarantees.
Landlord ↔ Tenant lean methodology
- Overall (STATE)
- 90 Strongly Landlord-Friendly
- State Alabama
- 90 Strongly Landlord-Friendly · R+15
- County
- — inherits STATE
- City
- — inherits STATE
ZIP-level market 35613
- Home prices YoY
- -33.9%
- Active inventory
- 821
- Price-to-rent
- 10.5×
Monthly cashflow live
- Estimated rent
- $2,189 medium interval (Pro) →
- Mortgage (P&I)
- −$1,855
- Tax est. 1.5%
- −$442 /mo · $5,307/yr
- Insurance
- −$147
- HOA
- −$25
- Vacancy / Maint / Mgmt
- −$460
- Net cashflow
- $-741
Break-even live
Sensitivity live
| Price | -10% $-496 | -5% $-619 | +0% $-741 | +5% $-863 | +10% $-985 |
|---|---|---|---|---|---|
| Rent | -10% $-914 | -5% $-827 | +0% $-741 | +5% $-655 | +10% $-568 |
| Rate | -1.0pp $-563 | -0.5pp $-651 | base $-741 | +0.5pp $-833 | +1.0pp $-926 |
UW: 25.0% down · 7.5% · 30yr · 1.5% tax · 5.0% vac · 8.0% maint · 8.0% mgmt
Financing live
Cash to close
- Down payment
- $88,446
- Closing costs
- $10,614
- Reserves months
- —
- Total cash needed
- —
Loan-product check · same deal, 3 products live
Conventional
25% down · 7.5% · 30yr
- Down + closing
- —
- Monthly P&I
- —
- Monthly cashflow
- —
- DSCR
- —
- Eligible?
- —
Personal DTI + credit; lowest rate.
DSCR
20% down · 8.5% · 30yr
- Down + closing
- —
- Monthly P&I
- —
- Monthly cashflow
- —
- DSCR
- —
- Eligible?
- —
No personal income docs; deal must DSCR.
Hard money
10% down · 12.0% · 12mo
- Down + closing
- —
- Monthly P&I
- —
- Monthly cashflow
- —
- DSCR
- —
- Eligible?
- —
Short-term bridge; refi at stabilization.
Rent comps 2 comps
| Address | Beds | Baths | Sqft | Rent | $/sqft | DOM | Units | Dist |
|---|---|---|---|---|---|---|---|---|
| 12515 Buck Rd Athens, AL | 4.0 | 3.0 | 2043 | $2,100 | $1.03 | 45d | 1 | 0.15mi |
| 22772 Winged Foot Ln Athens, AL | 3.0 | 2.5 | 2438 | $2,495 | $1.02 | 25d | 1 | 1.45mi |
HOA detail
- Monthly dues
- $25 · $300/yr
Listing history 17 events
-
2026-06-21days on market $274,900 Active 93 DOM
-
2026-06-18days on market $274,900 Active 90 DOM
-
2026-06-17days on market $274,900 Active 89 DOM
-
2026-06-16days on market $274,900 Active 88 DOM
-
2026-06-15days on market $274,900 Active 87 DOM
-
2026-06-14days on market $274,900 Active 85 DOM
-
2026-06-10days on market $274,900 Active 82 DOM
-
2026-06-09days on market $274,900 Active 81 DOM
-
2026-06-08days on market $274,900 Active 80 DOM
-
2026-06-07days on market $274,900 Active 79 DOM
-
2026-06-05days on market $274,900 Active 76 DOM
-
2026-06-03days on market $274,900 Active 75 DOM
-
2026-06-02days on market $274,900 Active 74 DOM
-
2026-06-01days on market $274,900 Active 73 DOM
-
2026-05-31days on market $274,900 Active 72 DOM
-
2026-05-30days on market $274,900 Active 71 DOM
-
2026-03-21$274,900 Active 1126-char remark
Show marketing remark (1126 chars)
With its welcoming Hardie Board exterior and bright, open layout, The Laurel makes it easy to showcase your style. Sunlight fills the open-concept family room, creating an inviting space for entertaining or relaxing. The kitchen flows seamlessly into the living area and includes a charming breakfast nook and a spacious walk-in pantry, giving you both convenience and character. This thoughtfully designed plan offers three bedrooms, two full baths, and a dedicated study, providing the flexibility modern families need. The Primary Suite offers generous space to unwind, featuring a well-appointed bath with thoughtful finishes and a large walk-in closet. Personalize The Laurel with a variety of structural options, including a 4-bedroom / 3-bath configuration, three-car garage, side-entry garage, gourmet kitchen, two fireplace options, and an extended covered patio for even more outdoor living. As always, available features and upgrades vary by community. Our community NHC can walk you through the standard offerings and options for your neighborhood. * Attached photos may include upgrades and non-standard features.
ⓘ Source: listings_history table (triggers on properties + properties_extension) + one-shot
backfill from property_details.listing_events for pre-trigger history.
Nearby sold comps map
Loading sold comps map…
Walkable amenities ~0.75 mi
Loading nearby amenities…
Taxation est. · year 1
- Rental income
- $26,262
- − Mortgage interest
- −$19,817
- − Property taxes
- −$5,307
- − Insurance
- −$1,769
- − Repairs & maintenance
- −$2,101
- − Management
- −$2,101
- − HOA
- −$300
- − Depreciation
- −$10,292
- Taxable loss
- −$15,424
- Est. tax savings @ 24.0%
- +$3,702
- After-tax cash flow
- $-5,190/yr
For passive investors: Depreciation is non-cash, so a rental often shows a tax loss while cash-flowing — sheltering income. Rental losses are passive: they offset passive income freely, and up to $25,000/yr can offset ordinary (W-2) income if you actively participate and your MAGI is under $100k (phasing out to $0 by $150k); unused losses carry forward. On sale, claimed depreciation is recaptured at up to 25%, and gains may owe capital-gains tax (a 1031 exchange can defer both). Figures are a year-1 estimate at your 24.0% rate — not tax advice; consult a CPA.
Schools (NCES district)
- District
- Athens City
- NCES district ID
- 0100120
- Math proficiency
- 27% ▼ -23.00%
- Reading proficiency
- 51% ▬ 0.00%
- Median HH income
- $45,479
- Composite
- 33.14/100
- National rank
- #5555
- State rank
- #29 of 129 in AL
Livability — Athens
- Score
- 75/100
- State rank
- #18
- US rank
- #4019
Category grades
Schools grade is shown separately in the Schools card above.
Census & demographics
- Census place
- Athens, AL
- County
- Limestone County · 80,439 people
- City population
- 55,492
- Metro
- Huntsville, AL
- Population (ZIP)
- 25,523
- Household income
- $100,845
- Rent vs Own
- Severe rent burden
- 118.0
Population outlook (Limestone County) Hauer SSP2
- Today (2025)
- 111,441 people
- By 2030
- 121,272 · +8.8%
- By 2040
- 140,705 · +26.3%
- By 2050
- 159,069 · +42.7%
- By 2075
- 202,231 · +81.5%
- By 2100
- 230,608 · +106.9%
Race, ethnicity, and origin ACS 2023
- Neighborhood character
- Predominantly White (83%)
- Race & ethnicity
- White 83% Black 7% Hispanic / Latino 5% Two or more races 5%
- Hispanic origin (detail)
- Mexican 4%
- Common ancestry
- Slovak 3% Lithuanian 2% Romanian 2%
- Foreign-born
- 3% · Canada
- Languages at home
- 96% English-only · Spanish 3% Vietnamese 1%
Political lean MEDSL · Limestone
- 2024 margin
- Solid R (+43.9) · D 27.5% · R 71.4% · Other 1.2%
- 2008→2024 swing
- -2.0pp toward R · 2008: -41.9pp · 2024: -43.9pp
- All cycles
- 2024: R+43.9 2020: R+42.6 2016: R+49.5 2012: R+43.6 2008: R+41.9
Not yet ingested
- Civics
- —
Market trends
- HPI YoY
- ▼ -88.56%
- Current HPI
- 173.0763
- Rent YoY
- —
- Metro
- Huntsville, AL
- State GDP YoY
- ▲ 2.94%
- F500 in state
- 4
Industry mix (Fortune 500 HQ in AL)
| Industry | F500 HQs | Revenue |
|---|---|---|
| Financial Services | 1 | $8B |
|
||
| Healthcare | 1 | $5B |
|
||
Price history
1 event — show timeline
- 2026-03-21 Listed $274,900 Zillow
Cash-flow waterfall
monthlySold comps — $/sqft
last 12 mo · ≤1 miLoading sold comps…