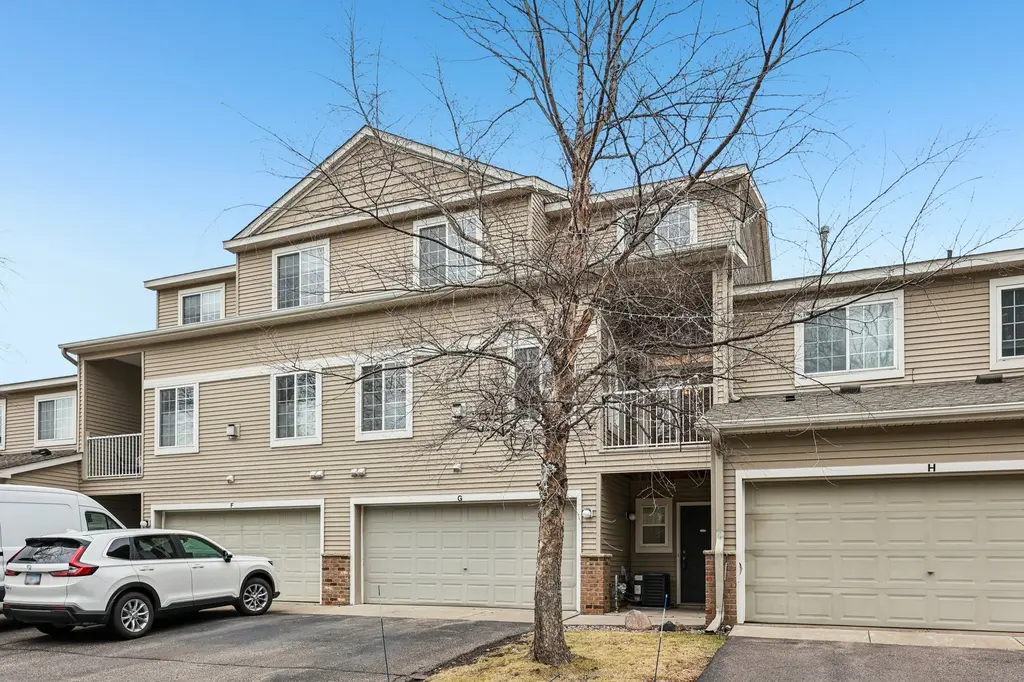
4980 Garland Ct N Unit G · Plymouth, MN
Flood risk No data
- FEMA flood zone
- —
- Chance of flooding over 30 yrs
- —
- Est. flood insurance / yr
- —
Fire risk No data
- Est. fire insurance / yr
- —
Heat risk No data
- Hot days now (above threshold)
- —
- Hot days in 30 yrs
- —
Wind risk No data
- Chance of severe wind over 30 yrs
- —
Air-quality risk No data
- Unhealthy air days now
- —
- Unhealthy air days in 30 yrs
- —
Risk factors via First Street. Map © Google.
Why this score? — see what drove the C- grade
The composite is a weighted blend of 9 inputs, each scored 0–100. Each bar is that input's sub-score; the figure is the points it added to the 100-point composite (weight × sub-score).
- ARV discount +15.0/15.0
- Cash flow +12.4/30.0
- Schools +6.9/10.0
- 1% rule +5.0/10.0
- Livability +4.2/5.0
- DSCR +3.7/10.0
- Rent growth +3.4/5.0
- Condition / age +2.5/5.0
- Appreciation +0.0/10.0
$249,900
🖨 Deal sheet (PDF) 📄 Offer letter ✓ Due diligence
Listing remarks
Welcome to this well-designed multi-level townhome in a desirable Plymouth location! Enter through the lower level with convenient access to the attached garage—perfect for everyday ease and Minnesota winters. Upstairs, the main level features an open-concept layout ideal for both daily living and entertaining. The kitchen flows seamlessly into the dining and living areas, highlighted by a cozy fireplace and abundant natural light. Step out onto the main-level balcony—perfect for morning coffee or relaxing evenings. A convenient half bath completes this level. The upper level offers a comfortable retreat with a spacious primary suite featuring a walk-in closet, along with a seco
Key facts
- Main-level balcony
- Attached garage
- Natural light
Tags
Property features AI
Finance
- HOA & community: Part of The Lodges at Timber Creek Crossing homeowners association; HOA fee $345 monthly covering lawn care and snow removal; Association reports no additional amenities
Exterior
- Parking: Attached garage with garage door opener; 2-car garage
- Utilities: City water (connected); City sewer (connected); Electric and natural gas service
- Home design: Residential attached property; Two levels; Main living room 26 x 24 (main level); Mud room 19 x 11 (lower level)
- Construction: Foundation described as other; Foundation area 672
- Exterior features: Vinyl exterior; No fencing; No pool; Lot approximately 4.342 acres; Common lot dimensions
Interior
- Kitchen: Cooktop; Double oven; Range; Dishwasher; Refrigerator
- Bedrooms: Two bedrooms (one upper bedroom 15 x 14; second upper bedroom 11 x 10)
- Bathrooms: One full bathroom; One half bathroom
- Heating & cooling: Forced air heating; Central air conditioning
- Interior features: Ceiling fan(s); Living/dining room layout; Balcony; Deck; Humidifier; ENERGY STAR qualified appliances; Exhaust fan
- Laundry & utility: In-unit laundry (washer and dryer listed among appliances); Utility room 7 x 13; Electric water heater; Gas water heater
Neighborhood map
What this means for you Summary
Snapshot
- This is a 2-bed/1.0-bath condo listed at $250k.
Deal economics
- At list price, monthly cash flow is $-41 ($-491/yr) — negative.
- To cash-flow at today's rent, offer at most $243k (2.9% below list).
- To meet the 1% rule (rent ≥ 1% of price), the offer needs to be $249k (0.3% below list).
- Recommended offer: $242k (3.0% below list) — sets the bar for market timing.
- Cap rate 6.1% vs local median 3.1% in Plymouth — top-decile yield for the area; either an underpriced asset or a hidden risk that comps aren't pricing in. Stress-test before assuming the spread holds.
Location & tenants
- Location reads 85/100 on livability (#17 in MN, #517 nationally) — a professional / high-income tenant draw. Strengths: schools A+, crime A+, commute A+; Watch: amenities F, cost of living F.
- Wayzata Public School District (urban): math 75% / reading 78% proficiency, ranked #2 of 301 in MN (top 1%) — strong family-tenant draw, lease renewals of 3-5y typical; only 11% free/reduced lunch — higher-income household profile.
- Market conditions: Rents rising (+3.7%/yr); 212 active listings in the ZIP; 2 comparable units currently listed for rent nearby; high-income renter base; 4,651 units permitted in Hennepin County in 2024 (2,443 in 5+ unit buildings).
- This rent is only 18% of the median local income ($171k/yr) — well below the 30% rent-burden line; pricing power to push rent on renewal without tenant pushback.
Forward outlook
- Local home prices are declining (-3.0%/yr); year-one equity from $2k of loan paydown is wiped out by about $7k of value loss. Plan a longer hold.
- Hennepin County population projected at +30% by 2050 — long-run rental-demand tailwind backs the buy-and-hold thesis.
Negotiation context
- It's been on market 34 days — a 3% lower offer ($242k) is reasonable based on typical stale-listing flexibility.
- 13 sale attempts since 17y ago with the ask held roughly flat each time — persistent listings suggest the price (not the market) is what's stuck; bring a comps-based counter.
- Current owner paid $154k; list at $250k implies a 62% gain — meaningful room to come down on a strong offer.
Questions for the listing agent
- What do current leases actually rent for vs. the listed asking? Can we see a recent rent roll and the last 12 months of T-12 income?
- It's been on market 34 days. Have you received any prior offers? Is the seller open to a 3% concession, seller financing, or rate buy-down credit?
- What does the HOA fee cover, when was the last increase, and are there any pending special assessments or reserve-fund shortfalls?
- Any open or pending special assessments — roof, HVAC, plumbing, elevator, façade? What's the per-unit balance and payoff schedule, and is the seller paying it off at close or rolling it to the buyer?
- Is there a deadline driving the sale (1031 exchange, divorce, estate, relocation)? That informs how much negotiation room exists.
- Schools are A-rated — typically a magnet for longer-tenancy family renters. What's the average tenant stay here, and is there a school-zone premium baked into asking?
- What's the average days-on-market for RENTAL listings here right now (not sales)? A rising rental-DOM trend means longer vacancies and softer asking-rent achievability than the comps imply.
- What's the recent tenant-quality profile in this submarket — average credit score on applications, eviction rate, late-payment / NSF rate, and stable-employment percentage? A property-management company in the area should have these aggregated.
- How much new apartment / multifamily construction is in the pipeline within 1–3 miles? Heavy new supply (>2% of stock underway) typically softens rents 12–24 months out; light construction supports rent growth.
Investment metrics
- 1% rule
- 1.00% ✗
- Cap rate
- 6.10%
- Cash-on-cash
- -0.70%
- DSCR
- 0.97
- GRM
- 8.4
CMA / ARV
- ARV (median comp)
- $308,444
- List price
- $249,900
- Delta
- -18.98%
- Verdict
- UNDERPRICED
- Comps
- 2 within 1.0 mi
Projected returns pro-forma
-3.0% appreciation · 3.7% rent growth · sell at horizon
- IRR
- -16.4%
- Equity multiple
- 0.41×
- Total profit
- $-41,122
- Equity at exit
- $37,261
- IRR
- -6.6%
- Equity multiple
- 0.56×
- Total profit
- $-30,947
- Equity at exit
- $21,607
Cash invested: $69,972 (down + closing). Projections, not guarantees.
Landlord ↔ Tenant lean methodology
- Overall (STATE)
- 46 Balanced
- State Minnesota
- 46 Balanced · D+2
- County
- — inherits STATE
- City
- — inherits STATE
ZIP-level market 55446
- Home prices YoY
- -24.0%
- Rents YoY
- 3.7%
- Active inventory
- 212
- Price-to-rent
- 8.4×
Monthly cashflow live
- Estimated rent
- $2,493 medium interval (Pro) →
- Mortgage (P&I)
- −$1,311
- Tax from tax record
- −$251 /mo · $3,006/yr
- Insurance
- −$104
- HOA
- −$345
- Vacancy / Maint / Mgmt
- −$523
- Net cashflow
- $-41
Break-even live
Sensitivity live
| Price | -10% $101 | -5% $30 | +0% $-41 | +5% $-112 | +10% $-182 |
|---|---|---|---|---|---|
| Rent | -10% $-238 | -5% $-139 | +0% $-41 | +5% $58 | +10% $156 |
| Rate | -1.0pp $85 | -0.5pp $23 | base $-41 | +0.5pp $-106 | +1.0pp $-172 |
UW: 25.0% down · 7.5% · 30yr · 1.5% tax · 5.0% vac · 8.0% maint · 8.0% mgmt
Financing live
Cash to close
- Down payment
- $62,475
- Closing costs
- $7,497
- Reserves months
- —
- Total cash needed
- —
Loan-product check · same deal, 3 products live
Conventional
25% down · 7.5% · 30yr
- Down + closing
- —
- Monthly P&I
- —
- Monthly cashflow
- —
- DSCR
- —
- Eligible?
- —
Personal DTI + credit; lowest rate.
DSCR
20% down · 8.5% · 30yr
- Down + closing
- —
- Monthly P&I
- —
- Monthly cashflow
- —
- DSCR
- —
- Eligible?
- —
No personal income docs; deal must DSCR.
Hard money
10% down · 12.0% · 12mo
- Down + closing
- —
- Monthly P&I
- —
- Monthly cashflow
- —
- DSCR
- —
- Eligible?
- —
Short-term bridge; refi at stabilization.
Rent comps 2 comps
| Address | Beds | Baths | Sqft | Rent | $/sqft | DOM | Units | Dist |
|---|---|---|---|---|---|---|---|---|
| 5305 Fountain Ln N Plymouth, MN | 3.0–4.0 | 2.5–3.5 | 2237 | $3,655 | $1.63 | 0d | 1 | 0.50mi |
| 4205 Merrimac Ln N Plymouth, MN | 2.0 | 1.5 | 1258 | $2,100 | $1.67 | 11d | 1 | 0.92mi |
HOA detail condo
- Monthly dues
- $345 · $4,140/yr
- Assessments
- None detected in remarks — confirm with the listing agent.
Listing history 46 events
-
2026-06-18days on market $249,900 Active 34 DOM
-
2026-06-17days on market $249,900 Active 33 DOM
-
2026-06-16days on market $249,900 Active 32 DOM
-
2026-06-15days on market $249,900 Active 31 DOM
-
2026-06-13days on market $249,900 Active 29 DOM
-
2026-06-09days on market $249,900 Active 25 DOM
-
2026-06-08days on market $249,900 Active 24 DOM
-
2026-06-07days on market $249,900 Active 23 DOM
-
2026-06-04days on market $249,900 Active 20 DOM
-
2026-06-03days on market $249,900 Active 19 DOM
-
2026-06-02days on market $249,900 Active 18 DOM
-
2026-06-01days on market $249,900 Active 17 DOM
-
2026-05-31days on market $249,900 Active 16 DOM
-
2026-05-15historical
-
2026-05-14$249,900 Active 891-char remark
-
2026-05-04price $255,000
-
2026-04-20price $264,900
-
2026-04-08$269,900 Active
-
2026-04-07historical
-
2026-03-31historical
-
2026-03-03price $274,900
-
2025-11-06price $279,900
-
2025-10-07price $284,500
-
2025-09-01$289,000 Active
-
2025-09-01historical
-
2025-08-31status Active
-
2025-08-09status Active
-
2025-07-25status Active
-
2025-07-19status Active
-
2025-07-12status Active
-
2025-07-05$289,000 Active
-
2022-07-03price $1,795
-
2013-12-12soldstatus $154,000
-
2013-12-06historical
-
2013-12-06soldstatus $154,000 Sold
-
2013-11-08status Pending
-
2013-11-07historical Contingent - Inspection
-
2013-10-17price $159,800
-
2013-09-07$164,800 Active
-
2011-07-25soldstatus $117,000
-
2011-05-20historical
-
2011-04-14$122,000
-
2011-02-02historical
-
2010-03-18$119,800
-
2010-02-28historical
-
2009-09-02$149,000
ⓘ Source: listings_history table (triggers on properties + properties_extension) + one-shot
backfill from property_details.listing_events for pre-trigger history.
Tax reassessment forecast MN · Partial reset (capped growth)
- Current annual tax
- $3,006 · $251/mo
- Projected year-2 tax
- $3,006 · $251/mo
- Expected delta
- $0/yr ($0/mo · 0.0%)
ⓘ Screening estimate from a state-policy table — verify with the county assessor before closing.
Nearby sold comps map
Loading sold comps map…
Walkable amenities ~0.75 mi
Loading nearby amenities…
Taxation est. · year 1
- Rental income
- $29,913
- − Mortgage interest
- −$13,998
- − Property taxes
- −$3,006
- − Insurance
- −$1,250
- − Repairs & maintenance
- −$2,393
- − Management
- −$2,393
- − HOA
- −$4,140
- − Depreciation
- −$7,270
- Taxable loss
- −$4,538
- Est. tax savings @ 24.0%
- +$1,089
- After-tax cash flow
- $598/yr
For passive investors: Depreciation is non-cash, so a rental often shows a tax loss while cash-flowing — sheltering income. Rental losses are passive: they offset passive income freely, and up to $25,000/yr can offset ordinary (W-2) income if you actively participate and your MAGI is under $100k (phasing out to $0 by $150k); unused losses carry forward. On sale, claimed depreciation is recaptured at up to 25%, and gains may owe capital-gains tax (a 1031 exchange can defer both). Figures are a year-1 estimate at your 24.0% rate — not tax advice; consult a CPA.
Schools (NCES district)
- District
- Wayzata Public School District
- NCES district ID
- 2742160
- Math proficiency
- 75% ▼ -4.00%
- Reading proficiency
- 78% ▼ -3.00%
- Median HH income
- $91,783
- Composite
- 68.75/100
- National rank
- #336
- State rank
- #2 of 301 in MN
Livability — Plymouth
- Score
- 85/100
- State rank
- #17
- US rank
- #517
Category grades
Schools grade is shown separately in the Schools card above.
Census & demographics
- Census place
- Plymouth, MN
- County
- Hennepin County · 1,150,272 people
- City population
- 79,816
- Metro
- Minneapolis-St. Paul-Bloomington, MN-WI
- Population (ZIP)
- 28,247
- Household income
- $170,625
- Rent vs Own
- Severe rent burden
- 364.0
Population outlook (Hennepin County) Hauer SSP2
- Today (2025)
- 1,405,227 people
- By 2030
- 1,492,650 · +6.2%
- By 2040
- 1,660,157 · +18.1%
- By 2050
- 1,823,498 · +29.8%
- By 2075
- 2,221,283 · +58.1%
- By 2100
- 2,509,976 · +78.6%
Race, ethnicity, and origin ACS 2023
- Neighborhood character
- Predominantly White (65%)
- Race & ethnicity
- White 65% Asian 20% Two or more races 7% Black 4% Hispanic / Latino 3%
- Common ancestry
- Portuguese 9% Romanian 4% Scottish 3%
- Foreign-born
- 18% · Canada, China, Vietnam
- Languages at home
- 77% English-only · Other Asian/Pacific 7% Other Indo-European 6% Spanish 2%
Political lean MEDSL · Hennepin
- 2024 margin
- Solid D (+42.6) · D 70.2% · R 27.5% · Other 2.3%
- 2008→2024 swing
- +14.0pp toward D · 2008: 28.6pp · 2024: 42.6pp
- All cycles
- 2024: D+42.6 2020: D+43.2 2016: D+35.3 2012: D+27.1 2008: D+28.6
Not yet ingested
- Civics
- —
Market trends
- HPI YoY
- ▼ -63.27%
- Current HPI
- 200.5438
- Rent YoY
- ▲ 3.70%
- Metro
- Minneapolis-St. Paul-Bloomington, MN-WI
- State GDP YoY
- ▲ 2.41%
- F500 in state
- 34
Industry mix (Fortune 500 HQ in MN)
| Industry | F500 HQs | Revenue |
|---|---|---|
| Healthcare | 2 | $407B |
|
||
| Retail | 2 | $150B |
|
||
| Consumer Goods | 2 | $32B |
|
||
| Industrial Machinery | 2 | $6B |
|
||
| Agriculture | 1 | $40B |
|
||
| Healthcare / Medical Devices | 1 | $32B |
|
||
Price history
+67.7% since first listed33 events — show timeline
- 2026-05-15 Listing Removed — NORTHSTARMLS as Distributed by MLS Grid
- 2026-05-14 Listed $249,900 NORTHSTARMLS as Distributed by MLS Grid
- 2026-05-04 Price Changed $255,000 NORTHSTARMLS as Distributed by MLS Grid
- 2026-04-20 Price Changed $264,900 NORTHSTARMLS as Distributed by MLS Grid
- 2026-04-08 Listed $269,900 NORTHSTARMLS as Distributed by MLS Grid
- 2026-04-07 Coming Soon — NORTHSTARMLS as Distributed by MLS Grid
- 2026-03-31 Listing Removed — NORTHSTARMLS as Distributed by MLS Grid
- 2026-03-03 Price Changed $274,900 NORTHSTARMLS as Distributed by MLS Grid
- 2025-11-06 Price Changed $279,900 NORTHSTARMLS as Distributed by MLS Grid
- 2025-10-07 Price Changed $284,500 NORTHSTARMLS as Distributed by MLS Grid
- 2025-09-01 Listing Removed — NORTHSTARMLS as Distributed by MLS Grid
- 2025-09-01 Listed $289,000 NORTHSTARMLS as Distributed by MLS Grid
- 2025-08-31 Relisted — NORTHSTARMLS as Distributed by MLS Grid
- 2025-08-09 Relisted — NORTHSTARMLS as Distributed by MLS Grid
- 2025-07-25 Relisted — NORTHSTARMLS as Distributed by MLS Grid
- 2025-07-19 Relisted — NORTHSTARMLS as Distributed by MLS Grid
- 2025-07-12 Relisted — NORTHSTARMLS as Distributed by MLS Grid
- 2025-07-05 Listed $289,000 NORTHSTARMLS as Distributed by MLS Grid
- 2022-07-03 Price Changed $1,795 RENT.
- 2013-12-12 Sold (Public Records) $154,000 Public Records
- 2013-12-06 Listing Removed — NORTHSTARMLS as Distributed by MLS Grid
- 2013-12-06 Sold (MLS) $154,000 NORTHSTARMLS as Distributed by MLS Grid
- 2013-11-08 Pending — NORTHSTARMLS as Distributed by MLS Grid
- 2013-11-07 Contingent — NORTHSTARMLS as Distributed by MLS Grid
- 2013-10-17 Price Changed $159,800 NORTHSTARMLS as Distributed by MLS Grid
- 2013-09-07 Listed $164,800 NORTHSTARMLS as Distributed by MLS Grid
- 2011-07-25 Sold (MLS) $117,000 NORTHSTARMLS as Distributed by MLS Grid
- 2011-05-20 Listing Removed — NORTHSTARMLS as Distributed by MLS Grid
- 2011-04-14 Listed $122,000 NORTHSTARMLS as Distributed by MLS Grid
- 2011-02-02 Listing Removed — NORTHSTARMLS as Distributed by MLS Grid
- 2010-03-18 Listed $119,800 NORTHSTARMLS as Distributed by MLS Grid
- 2010-02-28 Listing Removed — NORTHSTARMLS as Distributed by MLS Grid
- 2009-09-02 Listed $149,000 NORTHSTARMLS as Distributed by MLS Grid
Property tax history
+3.6%/yrLatest (2025): $3,006 · +9.1% YoY. Source: county tax records.
Cash-flow waterfall
monthlySold comps — $/sqft
last 12 mo · ≤1 miLoading sold comps…